Abstract
This paper explores the impact that large screen overview displays have on human performance in a nuclear power plant control room. We collected direct performance measures (accuracy and response time) in a full scope, digital research simulator, using a simplified task method. The participants were licensed operators who were asked to answer questions regarding process state. They provided answers in four types of trials combining two variables with two conditions each: individual or teamwork set-ups; and using the large screen display or the workstation displays to assess information. The results show that the operators were more accurate when the workstation displays were available than when the large screen display was available; there was a trend for quicker response times when the operators had the large screen available instead of the workstation displays; and finally, the operators were both most accurate and quicker responding in team conditions than individual conditions. We found an impact of the type of display on both the accuracy of the operators’ response (better in the workstation displays) and the response times (better in the large screen display). The results do not provide conclusive evidence in favor of any type of display. Performing the tasks in a team condition, however, seemed to have a systematic effect both on response time and accuracy. We close by discussing the contributions of this and describing future steps.
You have full access to this open access chapter, Download conference paper PDF
Keywords
1 Introduction
The first chapter frames the need for performing research on the effect on large-screen overview displays (LSOD) on human performance. Then, a framework for the assessment of LSOD is presented. Lastly, research questions for the current study are presented. Although the research is focusing on the nuclear domain, the contributions are relevant for other industries where centralized control of processes in present (such as chemical and petroleum).
1.1 Motivation
Advances in technology development lead to digitalization of modern control rooms, as found in nuclear industries. These technologies have the potential of reducing costs and improve flexibility in both new builds and in modernizing existing control rooms. One such technology is large-screen overview displays (LSODs). Governing nuclear standards and guidelines suggest LSODs have the potential of enhancing the crew’s situation awareness (SA) and to improve communication, leading to better control room performance [1]. Furthermore, it is described in literature [2] that operating complex plants using only smaller personal workstations can result in keyhole effects, where the crew can miss the bigger picture of the plant state by being over focused in selected aspects of the process [3].
These suggestions are supported by earlier field studies of conventional nuclear power plant control rooms, describing unfortunate effects by moving from larger analogue panels – where all actions were visible to the whole crew – to desktop-displays – where it is difficult to see what each crew member is doing [4]. The reduced transparency in crew actions as also shown that rapid process overview from personal workstations is worse compared to the larger analogue panels from the past [5]. There is, however, few conclusive evidences, based on empirical work, exploring the effects of using LSOD to mitigate these challenges [6].
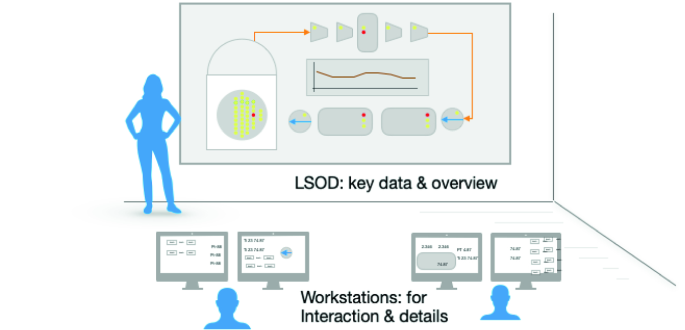
To assess the effect of LSOD on human performance, a framework was developed [7] defining what a LSOD is and how it could be assessed. Figure 1 illustrates the concept of LSOD in the current work. It suggests that: i) the LSOD should be centrally placed in the control room, being visible for the whole crew from their normal seated positions; and ii) it needs to be designed for its purpose from the ground up, focusing on key process components for overview purposes. In this approach, detailed interaction is enabled at the personal workstations only, with the LSOD being used exclusively for monitoring.
Further, this framework proposed to use the following dimensions for assessment of LSOD: i) Team performance; ii) Individual performance; iii) Top-down structured problem solving (where the work is goal-oriented, and the operators attempt to solve a generic task); and iv) Bottom-up reactive actions (where warnings and/or alarms inform the operators). The current work is one study of an incremental series of several studies that are deemed needed to understand the effects of LSOD on operator performance. The contribution of this paper is to explore bottom-up, data driven scenarios, for both individual and team performance. This is done by prompting operators to search for specific process information in difference trials, comparing the effects of using LSOD or smaller workstation displays (WSD). The next section presents the questions used to guide the research process.
1.2 Research Questions
In this work, three core research questions guided the design of the data collections. The first research question is linked with the assumption that the LSOD would support maintenance of awareness of plant status. The second question is linked with the assumption that the LSOD would make information more quickly accessible to the operators. The third question is exploring the way LSOD might be differentially affecting operator performance. The questions were formulated as:
-
1.
Does the use of LSOD, when compared to WSDs, have an impact on accuracy rates?
-
2.
Does the use of LSOD, when compared to WSDs, have an impact on response times?
-
3.
Are there different impacts of the use of LSOD, for individual and crew performance?
2 Method
In this chapter we describe the study design, participants, presented displays, materials and equipment used in the data collection, as well as the procedure for implementation. We close the sessions presenting a few relevant limitations of the current study that are important to understand the findings.
2.1 Design
The study had a within-subject design where all operators participated in all the test conditions. Two main variables were studied: the type of displays (LSOD/WSD) and way of working (Individual/Team). For the type of displays, the operators had access to either the LSOD or the WSD. For the way of working, the operators would perform the task individually, independently of other crew members, or simultaneously as a team, discussing the answers. This meant that on individual trials the operators were performing the task alone, not being allowed to talk with other crew members, while in the team conditions, the shift supervisor would hold a tablet computer with the questions, read them out loud, and then record the answer that all team members agreed upon. The participants were requested to answer 32 questions in each trial.
Two different scenarios representing snapshots of the plant status were presented to the participants. Each participant went through the tasks four times, two in individual trials and two in crew trials. As shown in Table 1, the participants saw each scenario two times, but in two different displays, to avoid exact repetition of the tasks.
The conditions in this study do not map to what it expected in a nuclear control room, where the LSOD is presented jointly with the WSDs. Since the goal in this study was to amplify potential effects of LSOD on human performance it seemed more likely to differentiate results when the two types of displays did not overlap (only LSOD versus only WSD).
In the condition where only the WSD were available, the operators had the required displays open in the screens and were not allowed to navigate the interface.
2.2 Participants
Ten licensed operators (based in the United States) participated in the study in three independent occasions in 2018 and 2019. The operators represented two different power plants: two crews of three operators from one plant; and a crew of four operators from a different plant. All participants were male and had an average age of 44.7 years old (SD = 6.5). Their experience with computerized interfaces was on average of 6.5 years (SD = 5.2) and they reported using it for some or most tasks at the home plant. All the participants were experienced operators, with more than six years of experience in control room context.
2.3 Displays
The operators were presented with a frozen simulator in a predefined status. In the trials they had access to the WSDs, only two screens were available, one showing the Safety Injection System/Residual Heat Remover (SIS/RHR), and another showing the Steam Generator/Auxiliary Feed Water (SG/AFW). Figure 2 shows the targeted displays during the data collection. The operators were not allowed to navigate in the system. An example of the LSOD and WSDs for the same plant status is shown below.
2.4 Materials and Equipment
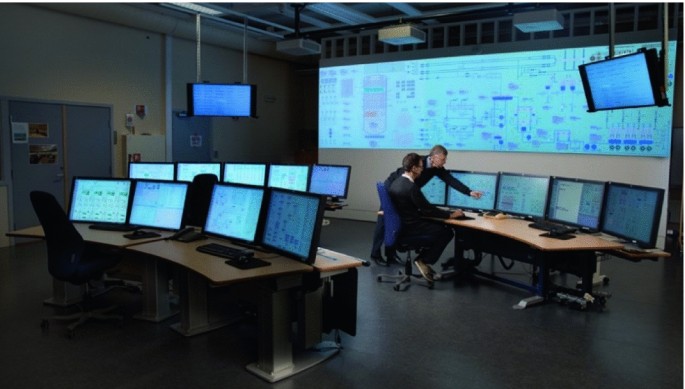
The study was conducted in the Halden Man-Machine Laboratory (HAMMLAB). Here, a full-scale nuclear reactor simulator is available, and the facilities emulate a fully digital main control room, with dedicated stations for reactor operator, turbine operator and shift supervisor. Figure 3 shows and overview of the simulator facilities.
Questions.
A set of 32 questions were selected for this pilot study from a pre-existing database and considering their applicability to the current test conditions in HAMMLAB.
The questions focused on detection of process parameters (example: What is SG B NR level?); comparison of different parameters (example: Which SG has the highest AFW flow?); calculations (example: What is the SG C feed flow - steam flow differential?); and knowledge-based questions (example: Is the RHR system line-up correct for this condition?). The questions presented different response options: insertion of numerical values, “yes/no” or “open/closed” questions, and “multiple-choice” questions.
Data Collection Application.
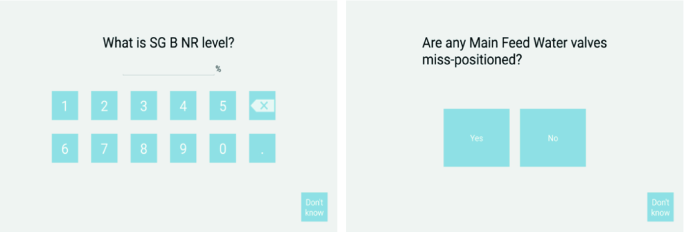
The tasks in this study were presented in a tablet through an application developed specifically for this purpose [8]. Figure 4 shows an example of how the questions are presented in the data collection app. There are different ways to answer the questions, such as inserting numbers or selecting one of the available options (as illustrated in the figure). The participants can also use the “Don’t know” button on the bottom right to skip a question they are not sure how to respond or where they are spending too much time. It is possible to edit the answer while on the page, but once the participants submit the answer (by swiping to the next question) it is not possible to go back to previous answers.
2.5 Procedure
The data collection occurred in the fourth day of interaction with the interface, following a separate study where the operators were handling full scope simulation scenarios for two days, after a day of training and familiarization with the interface.
The operators were informed that they would be performing simplified tasks, without interaction with the system, and that we would collect data on response accuracy and time.
Before the study the participants performed trials in order to familiarize with the data collection application by answering eight practice questions that illustrated all possible response possibilities in the study (yes/no; insert numbers; and multiple choice).
All participants answered the same questions in the four trials, but the order of the 32 questions was randomized every time. Also, the correct answers to the same questions were different for the two scenarios and could also variate between the LSOD and the WSD due to the format of the parameters (e.g. rounded or not rounded decimals).
For the individual trials, each participant sat at a specific workstation and answered the questions without interaction with the system or communication with the rest of the team. In the team trials, the shift supervisor had the tablet with the questions, read them out loud, and inserted the answer the team agreed upon.
2.6 Limitations
Here we describe limitations of the current study that should be considered. Microtasks are designed to address interface assessment, obtaining objective accuracy and response time data. They do not recreate realistic control room operation procedures and are focused on information gathering assignments (in opposition to control/execution). However, we argue that these tasks are seamless for interface evaluation, focusing on the impact that specific interface features (such as visualizations strategies and formats) can have in human performance and as such making them very relevant for the research problem we are addressing in this project.
For this data collection we were conducting a preliminary and exploratory pilot where the scientific rigor was not enforced – there were limitations we were aware of already before the data collection:
-
Narrow non-standardized question database, only 32 questions were available for the pilot study, after a selection of questions from previous studies that were applicable to the existing interface. This led to the need to repeat questions with the participants answering the same 32 questions 4 times, one in each trial. The questions had the same answers twice, one with each type of interface.
-
Restricted scenarios/plant status, only two scenarios were developed for the pilot study, meaning that the participants answered to the same questions with similar answers twice during the trials.
3 Results and Discussion
In this chapter we present the main findings and interpretations regarding the main studied variables: accuracy and response time variation according to the type of display used and the work condition the team was presented with.
3.1 Accuracy
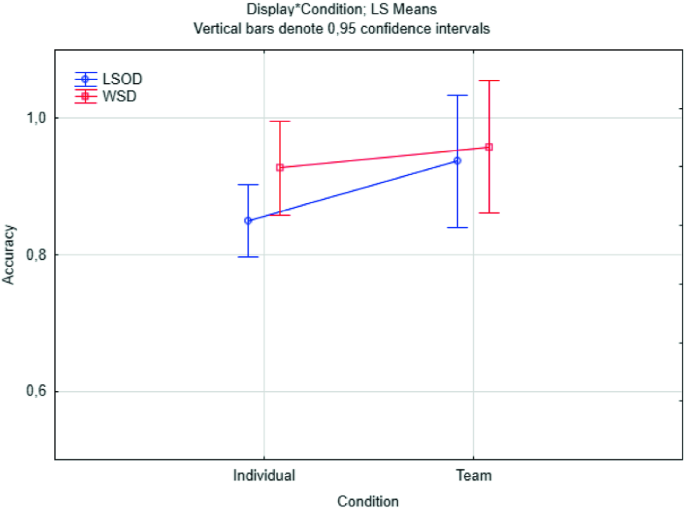
There was a global accuracy rate of 0.90 (SD = 0.09). The average accuracy for the trials with the LSOD was of 0.87 (SD = 0.10) and for the WSD was of 0.94 (SD = 0.03). Comparing the two ways of working, performance in the individual trials (M = 0.88, SD = 0.09) was lower than on the team trials (M = 0.95, SD = 0.01). Table 2 shows descriptive statistics for time and accuracy in each condition and display.
Figure 5 illustrates the accuracy ratings for each display (LSOD versus WSD) in each condition (individual versus team). The results show that performance was high in both conditions and for both types of displays (error rate was below 20%). This error rate is equivalent to the ones found in previous implementations of the Microtask method [8, 9]. It is possible to see that the team trials had higher accuracy rates than the individual trials and the performance was slightly better on the WSD than on the LSOD – this was particularly noticeable for the individual trials.
3.2 Response Time
The average response time was of 10.6 s per question (SD = 2.8). In the trials with the LSOD, the response time was of 10 s (SD = 2.7) and for the WSD was of 11.36 s (SD = 2.92). Regarding the two test conditions, the participants were faster in the team trials (M = 9.5, SD = 2.0) than on the individual trials (M = 11.0, SD = 3.0). Figure 6 shows the average response time for each display, according to the condition. It is possible to observe that the LSOD seemed to introduce and advantage in the response times with shorter response times than the WSD.
3.3 Speed-Accuracy Trade-off
The speed-accuracy trade-off is a phenomenon well described in the literature that refers to the phenomenon of slow responses with high accuracy rates and/or quick responses with low accuracy rates [10, 11]. This is a consistent behavioral phenomenon often reported in cognitive science. The absence of a speed-accuracy trade-off is seen as an indicator that the participants were able to follow the instructions of responding “as quickly and accurately as possible”, indicating that the participants were engaged and focused in the task.
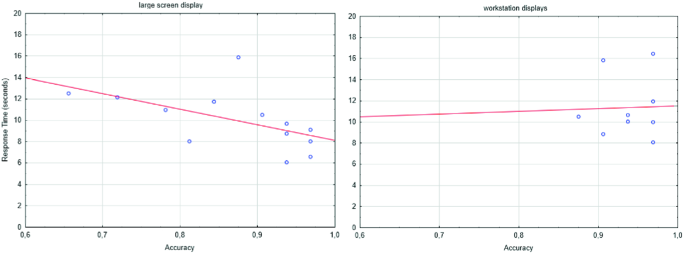
In the current study there was not a significant correlation between response time and accuracy for neither displays (p > 0.05). As shown in the trend in Fig. 7, for the LSOD the participants were quicker when answering correctly, while for the WSD no trend is visible (possibly due to the very high accuracy rates in this condition). This is an indicator that the operators were able to complete the requested task and shows an expected variability in the responses mediated by the difficulty of the task.
4 Conclusions
This chapter presents a summary of the findings of the study and highlights its contribution for understanding the effects of large screen overview displays on operators’ performance in nuclear control rooms. We end with references to future work.
4.1 Findings and Contributions
The impact of LSOD on human performance was explored, both on the individual and the team levels. These were our findings:
-
1.
Does the use of LSOD, when compared to WSD, have an impact on accuracy rates?
Combining the results from the individual and the team trials, we observed a trend that the participants were more accurate when using the WSDs than the LSOD. As such, for this study we found an impact of the type of display on the accuracy of the participants’ responses.
-
2.
Does the use of LSOD, when compared to WSD, have an impact on response times?
Combining the results from the individual and the team trials we found a trend for quicker response times when the participants had the LSOD available instead of the WSD. As such, we can infer that for this study, the response times were impacted by the type of display available.
-
3.
Are there different impacts of the use of LSOD, at the individual and the team operating levels?
It was possible to observe that the operators were more accurate and quicker when responding in the team conditions versus the individual condition. This variable seems to be a relevant variable mediating both response time and accuracy in control room performance. This is a relevant finding since the team condition brings more context to the proposed tasks, making it closer to real work conditions where communication, peer checking, and verification are part of the work processes. Nonetheless, other methods will be required to understand these results such as tools for assessing communication, teamwork and work processes.
The main contribution of this study is an assessment of differential impact of LSOD and WSD on individual and crews’ performance. We were able to identify advantages and disadvantages of each type of display. Considering that the data was collected only in one context (digital research simulator), no conclusive evidence of the advantages of LSOD versus WSD can be drawn from this pilot study. However, it was visible that team performance was consistently superior than individual performance, confirming the relevance of crew work for plant safety.
4.2 Further Work
Next steps in the project will involve a new study to further explore the impact of LSOD on human performance. This study will require a more complex design in order to tackle the identified relevant variables and overcome the limitations of the current study.
It will be required to generate a larger question database to avoid repetition between trials. In the current pilot we selected only 32 questions from previous studies which resulted in a high repetition rate. Ideally, we would develop a large database of questions (grouped by characteristics such as response type and/or nature of the task) and randomly extract between 30 to 40 questions to present in each trial. Such a database, where the questions are clearly categorized would support the comparison of results when using the same question category in different trials (e.g. What is the flow in pump x? could be asked about several different pumps without the need of repetition).
Further explorations of the individual versus team conditions will also be interesting, especially considering the potential benefits of team conditions/teamwork as a mitigating factor for response accuracy, contributing to overall plant safety and performance.
References
O ́Hara, J.M., Brown, W.S., Lewis, P.M., Persensky, J.J.: Human-system interface design review guidelines. (NUREG-0700, Rev. 2). U.S. Nuclear Regulatory Commission, Washington, USA (2002)
IEC 61772 International standard, Nuclear power plants – Control rooms – Application of visual display units (VDUs), Edition 2.0, International Electrotechnical Commission, Geneva, Switzerland, p. 22 (2009)
Woods, D.D.: Toward a theoretical base for representation design in the computer medium: ecological perception and aiding human-cognition. In: Flach, J., Hancock, P., Caird, J., Vicente, K. (eds.) Global Perspectives on the Ecology of Human-Machine Systems, vol. 1, pp. 157–188. Lawrence Erlbaum Associates Inc., Hillsdale (1995)
Vicente, K.J., Roth, E.M., Mumaw, R.J.: How do operators monitor a complex, dynamic work domain? The impact of control room technology. Int. J. Hum. Comput. Stud. 54(6), 831–856 (2001). https://doi.org/10.1006/ijhc.2001.0463
Salo, L., Laarni, J., Savioja, P.: Operator experiences on working in screen-based control rooms. In: Proceedings of the NPIC & HMIT Conference, Albuquerque, USA (2006)
Kortschot, S., Jamieson, G.A., Wheeler, C.: Efficacy of group view displays in nuclear control rooms. IEEE Trans. Hum.-Mach. Syst. 48(4), 408–414 (2018)
Braseth, A.O., Eitrheim, M.H.R., Fernandes, A.: A Theoretical Framework for Assessment of Large-Screen Displays in Nuclear Control Rooms (HWR-1245). OECD Halden Reactor Project, Halden (2019)
Hildebrandt, M., Fernandes, A.: Micro Task Evaluation of Innovative and Conventional Process Display Elements at a PWR Training Simulator (HWR-1169). OECD Halden Reactor Project, Halden (2016)
Hildebrandt, M., Eitrheim, M.H.R., Fernandes, A.: Pilot Test of a Micro Task method for Evaluating Control Room Interfaces (HWR-1130). OECD Halden Reactor Project, Halden (2016)
Bruyer, R., Brysbaert, M.: Combining speed and accuracy in cognitive psychology: is the inverse efficiency score (IES) a better dependent variable than the mean reaction time (RT) and the percentage of errors (PE)? Psychol. Belg. 51(1), 5–13 (2011). https://doi.org/10.5334/pb-51-1-5
Townsend, J.T., Ashby, F.G.: Methods of modeling capacity in simple processing systems. In: Castellan, J., Restle, F. (eds.) Cognitive Theory, vol. 3, pp. 200–239. Erlbaum, Hillsdale (1978)
Author information
Authors and Affiliations
Corresponding author
Editor information
Editors and Affiliations
Rights and permissions
Copyright information
© 2020 Springer Nature Switzerland AG
About this paper
Cite this paper
Fernandes, A., Braseth, A.O., McDonald, R., Eitrheim, M. (2020). Exploring the Effects of Large Screen Overview Displays in a Nuclear Control Room Setting. In: Harris, D., Li, WC. (eds) Engineering Psychology and Cognitive Ergonomics. Cognition and Design. HCII 2020. Lecture Notes in Computer Science(), vol 12187. Springer, Cham. https://doi.org/10.1007/978-3-030-49183-3_2
Download citation
DOI: https://doi.org/10.1007/978-3-030-49183-3_2
Published:
Publisher Name: Springer, Cham
Print ISBN: 978-3-030-49182-6
Online ISBN: 978-3-030-49183-3
eBook Packages: Computer ScienceComputer Science (R0)

