Abstract
Traditionally in large enterprises, budget cuts are a treat for IT departments. One way to guard IT budget is visualizing the impacts in IT services of such cuts. Data visualization tools are capable of bridging the gap between increased data availability and human cognitive capabilities. In this paper, we present a budget visualization tool that allows enterprise wide data-driven decision-making. Our proposal was developed in the context of a large multi-industry state-owned company, with rigid control structures and external pressures for cost reduction and investment optimization. Our tool promotes visualization as the main mechanism to justify IT budget requests and to defend from budget amendments and cuts. We propose a generic tool that might manage different perceptions from many parts of an organization. However, to evaluate our tool’s effectiveness we incorporated four stakeholder’s perspectives: financial, technical, business’ clients and supply chain. In our efforts, we developed a data model that encapsulates these four perspectives and improves communication capabilities between stakeholders.
You have full access to this open access chapter, Download conference paper PDF
Keywords
1 Introduction
Budget creation and allocation are an integral part of running any organization efficiently and effectively. Budgets not only serve as planning mechanisms but also as a starting point for controlling programs within organizations.
The traditional approach to understand budgets is: given a certain amount of money, how much will be allocated to each of the required expenses? Budgets serve both to determine how much to spend and to judge spending performances [1]. “A budget is a set of interlinked plans that quantitatively describe an entity’s projected future operations” [2]. Budgeting typically begins with strategic planning at senior management level, and lower level managers in the organization are asked to defend their budgets assessing execution and possible budget cut impacts.
Most of the organizations are software and data driven nowadays. The amount of information available is increasing rapidly, and data visualization tools are capable of bridging the gap between the data daily increment and the organizational human cognitive capabilities.
IT budget needs to be documented, so that its management becomes explicit and visible to involved stakeholders. If IT budget is not properly documented, external pressures could result in budget cuts that could consciously or unconsciously compromise IT business services.
In this paper, we present a budget visualization tool, which can be used to support and improve budget negotiation, and to analyze the possible impacts on IT services, caused by budget cuts. Moreover, the proposal allows parameterization of visualization techniques to create an enterprise system that allows a more comprehensive view for each stakeholder involved in the budgeting process.
The rest of this paper is structured as follows: Sect. 2, describes the theoretical background for our research including IT budget definition and stakeholder’s perspectives, technical regulations, standards and frameworks that affect IT budgeting in context like the one we are working in. Finally, technical components used for our system implementation are described. Section 3 describes the context in which our system was developed and evaluated. Section 4 presents an overview of our budget visualization tool, its components and architecture. Finally, in Sect. 5, we discuss the results gathered from our system implementations and evaluation, present some final remarks and describe future work.
2 Background
This section introduces the main concepts used in our research, including: IT budget, regulations that somehow affect budgeting, and different stakeholder perspectives about IT budgets. Moreover, we briefly describe the graph databases and visualization techniques used to implement and evaluate our budget visualization system.
2.1 Information Technology Budget
IT budget is the amount of money spent on an organization’s IT professionals, systems and services. Furthermore, IT budget includes the costs of maintaining and constructing enterprise systems and supporting IT services [3]. An important difference between IT budget and other traditional budgets is that not all IT spending fall within the IT department (i.e., it is controlled by business divisions instead of IT).
IT budget contains compensations for IT professionals, both employees and external consultants. Other common expenses are related to building and maintaining back office systems (i.e., systems dedicated to running the company itself). For instance, Enterprise Resource Planning (ERP), accounting, finance, human resources, and in some cases even, Customer Relationship Management (CRM).
IT budget does not only encompass systems, but also the hardware in which those systems run. Typically, an IT budget includes all sort of hardware that is required for the company (e.g., laptops, servers, networking equipment, cloud services).
Usually, IT budgets are prepared by a centralized IT office. However, it is common to find parallel IT related costs in business budgets or other departments such as sales and marketing, research and development, operations, among others. This leads organizations to consider several points of view while preparing and assessing IT budgets. The next section describes the points of view considered for this research. However, other perspectives exist and should be addressed to provide an all-embracing view of IT budget [4].
2.2 IT Budget Perspectives
To develop this proposal, we considered different points of view [5]. To define the perspectives related with IT budget, we identified a number of stakeholders that are involved in the budgeting process and we collected their main concerns. The main findings include:
-
Customers of IT Business Services. These stakeholders are concerned with the impact of budget cuts in IT business services. IT supports the execution of internal business processes, and these stakeholders do not want negative effects on cost, utility or even service warranties.
-
Financial Managers. These stakeholders are concerned with the financial aspect of IT services and their components. The main sub-processes concerning these stakeholders are: budgeting (i.e., plan future IT expenditures), IT accounting (i.e., capital and operational cost management) and charging (i.e., assign costs of an IT Service proportionally and fairly to the users of that service).
-
IT Leaders. These stakeholders are primarily concerned on technical aspects of IT business services, and how budget changes will affect their ability to support IT services.
-
Project Managers. They are concerned on the IT budget required for their projects, and the possible impacts on their accomplishment if budget cuts are required.
As it can be seen, several of the concerns are shared between stakeholders. However, they have different ways to observe data in order to make decisions (i.e., they can see the same data but derive different conclusions).
2.3 Technical Regulations, Standards and Frameworks
Government comptroller entities around the world recognize that information technologies have become an essential tool used to provide services [6]. However, in some cases, state-owned companies question their own IT investments.
Technical regulations from government comptroller have been published to optimize and monitor financial resources invested in IT, to control effectively these resources, and to observe standards and frameworks. These technical regulations integrate practices of several reference models including ITIL [7], COBIT [8], TOGAF [9, 10], and ISO 27000 [11].
All these set of practices for IT management, are used for regulatory purposes, since they are supposed to optimize IT services. In order to standardize our enterprise visualization IT budget system, we used terminology from these models.
IT Business Services are services that allow customers to achieve goals without the ownership of specific costs and risks [7]. To support the provisioning of services to end users, people (insourcing and outsourcing), process and technology (hardware, software and infrastructure) are needed. In this paper, we present a system or tool to visualize the impact of IT budget changes on IT Business services. This system is considered to be critical for a big enterprise since business continuity is vital and business change need to be considered.
Business continuity ensures that the firm can continue to obtain value from its products and services through such action as process automation, product or service development, service provisioning, among others. Business change delivers value when some change in the business model, process or product/service is enable or driven through IT [12].
We used terminology from the TOGAF® framework metamodel. TOGAF metamodel provides a set of entities that can be captured, stored, filtered, queried and represented. These characteristics allow consistency, completeness and traceability [9]. When properly applied, TOGAF metamodel allows companies to find the answer to questions such as: Which functionalities support which applications? Which processes will be impacted by which projects? and other important questions to estimate budgeting impact on the company’s IT services. Furthermore, entities have associated relations and metadata that allow queries [9].
Up until now, we have been addressing entities, relations, core data and metadata. All this information is normally stored in different sources along organizations. However, a natural way to think of this information is a graph. Even though data sources could be relational databases, digital documents, among others; the information within an organization is so coupled, and usually there are so many missing bits, that a graph is a reasonable solution to store it. The next subsection introduces Neo4j, a graph oriented database management system (DBMS). We describe Neo4j since it was used to implement our visualization system.
2.4 Neo4j: A Graph Oriented DBMS
Neo4j is a scalable graph database designed to support not only data storage but also relations [13]. Neo4j stores and process information in real-time [14]. We decided to implement with Neo4j due to the amount of connections (i.e., large amount of join operations) required for our application. The volume and variety of data were also considered [15]. It is not enough to store data and relations, it is also necessary to access it in an efficient and effective way. Cypher is one of Neo4j’s query languages. This language provides access to data stored in the DBMS through non complex queries, very similar to Structured Query Language (SQL).
Finally, once the necessary data has been structured and stored, different ways to visualize it are necessary to provide real value for the IT budgeting process. The next section presents a brief introduction to visualization techniques.
2.5 Visualization Techniques
Data-Driven Documents (D3) is a novel representation-transparent approach to visualization. With it, designer selectively bind input data to arbitrary document elements, applying dynamic transformations [16]. D3 provides a decoupled solution; therefore, information can come from multiple sources and only requires a structuration process in order to be displayed.
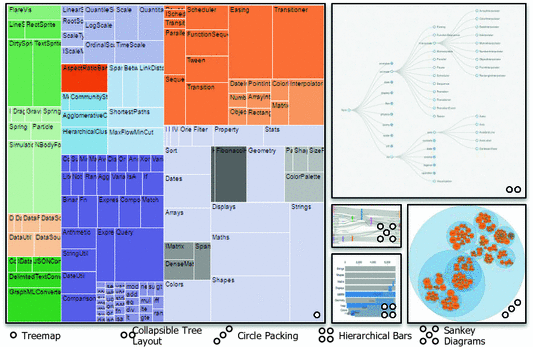
Some visualization techniques presented in Fig. 1 can be used in the visualization of hierarchical data and others for relationship data. Also, they will represent different attributes of each piece of data. It is important to point out that most of this data-driven visualization techniques are dynamic (i.e., users can interact with the visualization and it will change the information displayed). All the concepts described in this section were detailed because they are used in the context in which our budget visualization tool was conceived. The next section describes such context.
Illustration of some of the available visualization techniques at D3.js [16]
3 Context
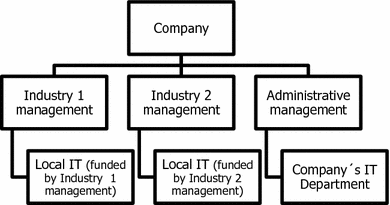
In this paper, a budget visualization system that emerged from a multi-industry state-owned company, with more than ten thousand employees, is presented. The company has an IT department and many local IT areas.
The company’s IT Department is in charge of assuring that IT activities and investment complies with regulations and standards, and of supporting all three management levels in their technological requirements. Figure 2 shows the company’s structural diagram.
The company’s IT budget is significant compared with total company budget and most of the expenses go to third parties providing services or products (e.g., outsourcing of software development and maintenance, outsourcing of solution operation, solution and infrastructure providers). Rigid control structures are used to manage and monitor incomes and expenses in the organization.
Furthermore, since it is a multi-industry company, information has been managed in silos (i.e., each industry segment managed information separately). This practice is also present inside each management department.
Efforts to comply with government regulations for IT started several years ago, and IT related practices have different levels of implementation, most of them based on ITIL and COBIT. These efforts have driven budgeting practices for IT looking to create a holistic vision of IT budget.
The IT budget formulation is performed annually in a distributed way (more than fifty department managers are involved in this process). Each Local IT and the IT Department formulate the IT budget, and that information is registered in the company budget system. Mandated by government comptroller, the IT department must attach an IT plan to explain the IT budget. Given this requirement, a format and tool for collecting detailed information about IT budget was defined and implemented two years ago.
A major disruption occurred when one of the industries in which the company performs moved from a monopolistic industry to a competitive one. This leads to several strategic competitive efforts, and large investment to optimize budgeting and investment. With these context characteristics in mind, our project tries to answer the following research questions:
-
1.
How can the IT department convince senior management and other stakeholders that IT budgets must sometimes exist?
-
2.
How can the impacts of IT budget cuts be showed to management in order to avoid them or at least manage them wisely?
During the first assessments to answer these questions, we realized that data is the key factor. However, it is not the data itself what can change managerial decisions, but how data is shown to each stakeholder.
Our visualization tool allows dynamic change of data and visualization techniques to support IT budgeting process. Moreover, the possibility to visualize budget information allows to show the comprehensiveness of IT, and provide it with visibility across the organization. In order to do it, we developed a solution to support data-driven documents as using a visualization model. The data currently used for budged decision-making was extracted and transformed to meet the requirements of a graph database, and a set of queries were established to determine the applicability of our system.
4 System Overview
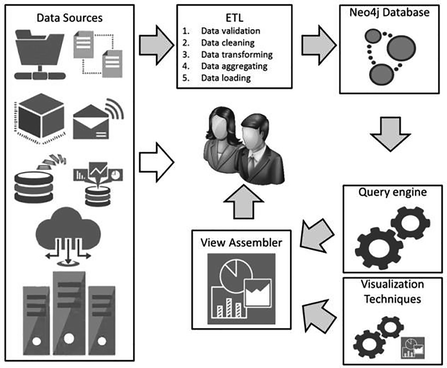
Our budget visualization system provides a mechanism to picture corporate information through different visualizations. We took the available data sources and created an Extraction, Transformation and Loading (ETL) process that uses a graph-oriented database (Neo4j as DBMS) as repository. With data loaded into the new DBMS, users can select both the data and the visualization technique they want to use. Finally, a view assembler prepares the query results to be displayed by a dynamic data-driven document.
The visualization technique must be coherent with the data that will be shown (i.e., a hierarchical display may not be used to visualize disjoint information). The goal of this solution is to provide a way to make data-driven decision-making in the IT budgeting process. Figure 3 shows a component diagram of our proposed system. Further subsections describe in detail each one of its components.
4.1 Data Sources
To identify relevant data sources, we interviewed different stakeholders (members of the company described in the context section). The main identified data sources included: company budget system, IT service catalog, system of IT federated planning and procurement initiatives plan and their formats were relational databases, Excel sheets and Word documents. To establish the documentation of IT budget, it is necessary to consider a number of stakeholders that are involved in IT budget management, and their typical concerns. Such stakeholders include but are not limited to: customers of IT business services, financial managers, IT leaders and project managers. Since the implementation of our visualization system required an ETL process, we decided to adapt the transformed data in order to align it with ITIL concepts and TOGAF metamodel.
4.2 ETL Process
Data sources were manually identified. For each data source the information had to be analyzed in order to transform it, and load it, in the new repository. We created a data model that allows mapping of identified data sources into a new repository.
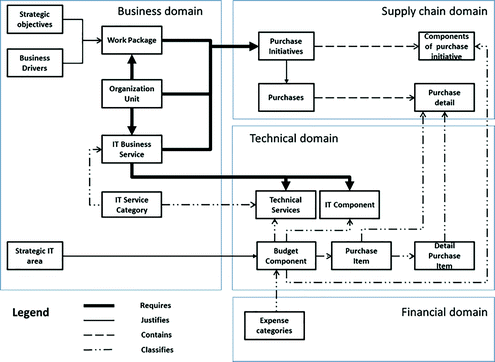
Figure 4 shows our proposed data model. It contains components derived from ITIL and TOGAF. The core concept (i.e., the one that will drive most of the queries) is IT Business Service. The data stored in this component is in business language. The proposed data model has 4 domains: business, financial, technical and supply chain. The business domain includes strategic business goals, business drivers, IT strategic lines and priorities, IT business services, organizational units, IT service categories (i.e., an index). Work packages are a generic component that encapsulates programs, projects or other type of works.
Technical contribution to business can be distinguished through service delivery. This is why the main relation between the business domain and the supply chain and technical domain is ‘‘requires’’.
Technical domain encapsulates technical services and components. These items are essential to deliver business services. The supply chain represents purchases from third parties and providers. Purchase initiatives (defined during the budget negotiation) and purchases (carried during the budget execution period). Both purchases and initiatives are modeled through technical budget components.
The financial domain includes expense categories used to classify all the technical budget components that are mapped to purchases and initiatives. Our data model establishes the roadmap that connects business strategies to financial resources and IT investments.
All the information extracted from data sources is transformed in order to align it with our data model and loaded into the Neo4j database. Using this approach allows and eases the evolution of our model. The incorporation or removal of components would not affect data integrity. Therefore, as soon as fundamental concepts related with the ones mapped in our data model are identified they can be incorporated.
4.3 Query Engine
Our system is built to allow parametric queries. Users can filter and adapt the query to retrieve data concerning a specific element in our data model or to aggregate information for more general purposes.
Even though our system allows the traditional CRUD (create, retrieve, update and delete) operations, we designed 14 specific queries. The implemented queries were designed after observations of the negotiation process carried out by several stakeholders in the IT budgeting process. Table 1 shows the implemented queries, and the stakeholders that might be interested in the information results of those queries.
4.4 Visualization Techniques and View Assembler
Our proposal provides a set of visualization techniques, but it also allows anyone to add more techniques as long as the visualization fits the data structures. The ETL process modifies data in order to allow both generic and highly specific (ad-hoc) visualizations. All of these are based on the data model proposed.
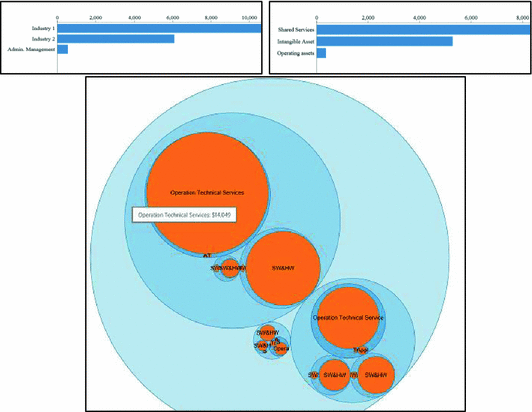
To test our proposal, we used some of the available data-driven documents [16]. Figure 5 shows some examples of the query results from our system implementation. Functional testing showed that once the data is loaded to the data-driven document, the interaction is easy and useful to gain insight on the data being visualized. Moreover, functional testing demonstrated that the same information can be visualized with different visualization techniques. Therefore, our system can be used by different stakeholders as it adapts to their requirements. To illustrate our tool functionality, Fig. 5 presents the IT budget according to general ledger. All figures presented in this section are screenshots from web browsers, displaying dynamic charts.
Visualizations presented in Fig. 5 allow financial experts to, in one picture, determine which industry has more expenses, and in which expense category each industry-own company is prominent. Using these visualizations in a budget negotiation session, the circle packing visualization is a tool to understand the big picture. The hierarchical bar charts can be used to answer questionings or to provide a detailed explanation of expenses and budget perspectives.
Notice that the data visualized in Fig. 5 is the same in all three visualizations. They are provided since multiple ways to visualize data can allow understanding between different stakeholders. Our system allows change between visualizations with a couple of clicks.
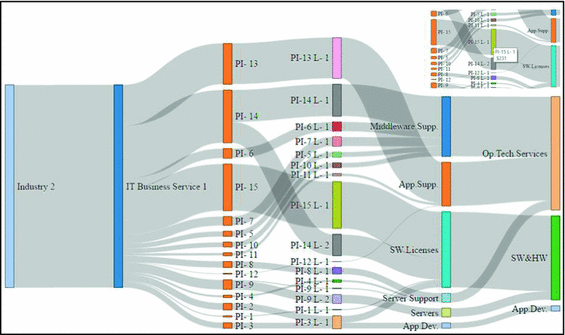
Figure 6 shows all four perspectives of one IT business service. This figure allows understanding between all stakeholders. The left most lines represent the business perspective, classifying the industry and an IT Business Service. Center left presents (PIs purchase initiatives) represent the supply chain domain and its details (PI-L Components of purchase initiatives). The technological components (technical domain) and general expense categories (financial domain) are represented in the right most lines respectively.
In the Sankey diagram, connection thickness represents the strength of the connection (e.g., the amount of money). The dynamic aspect of this visualization uses tooltips to show further details on the connections or lines, depending on where the user places the cursor.
Figure 6 can be used to determine which services will be impacted if there is a budget cut. For instance, if senior management suggests a cut of purchase initiative 15, immediate mapping can be performed to SW Licenses that also affect SW&HW. In this way, stakeholders can determine how a budget cut will affect IT’s capacity to maintain business services or other IT-related tasks.
5 Discussion
In this paper we presented a budget visualization system that extracts and transforms organizations distributed data, and allows multiple ways to visualize it. We implemented a general enterprise wide visualization tool (i.e., usable by many stakeholders); however, four perspectives were tested.
Our solution provides mechanisms to incorporate new visualizations and data sources (technical abilities are required to achieve it). While designing our system we realized that stakeholders are very focused on their ways to visualize information, and they do not always care about other perspectives. A design effort was conducted to assure that the same information can be accessed and understood by multiple stakeholders, either in a negotiation process or just to analyze corporative budgets. This effort allowed the creation of an integrated data model (see Fig. 4) that eases communication between stakeholders.
To boost not only the use, but the acceptance and proliferation of our system in the organization, we considered multiple agents of each area represented. We explained why data should be combinable. Moreover, we presented the benefits that each of them could gain from a common understanding and shared body of information (i.e., common language).
It is crucial for the maintainability and sustainability to our system, that someone within the organization, keeps track of the big picture. This person, or group of people, does not only need to assure continuous information supply, but also they should maintain data relations and information coherence.
As it was stated, our system was developed in the context of large multi-industry state-owned company with rigid control structures and segregated information (due to silo mentality). We believe that our tool is an example of collaboration that could be used as a reference to boost collaborative practices in this kind of contexts.
Our system uses multiple layers. This provides it with the flexibility that it requires for adapting to different contexts. Moreover, it allows the incorporation of emerging visualizations and data sources. We believe that our solution is applicable in contexts other than budgeting. However, further analysis is required to assess its applicability.
We tested our system with real data from a real organization, and demonstrated that our solution fits complex scenarios, and provides stakeholders with new and adaptable ways to conduct their tasks.
In the context of a public institution, our budget visualization tool allows, improves and promotes data-driven decision-making. It guarantees proper budget related decisions and enhancing transparency both within the organization and towards comptroller instances.
A natural path for this research is to include technical debt into our data model. Most of our data model components allow a direct mapping to technical debt, since they involve cost management of purchase initiatives that could also encompass outsourcing contracts or even software development. As Guo, Oliveira and Seaman [17] define it, technical debt can be represented as a list of delayed task that may cause maintenance problems in the future. Authors state that technical debt must be quantifiable. We believe that it does not only require being quantifiable, but also displayable, contextualizable, linkable and referable with the other components of our data model.
To operationalize information’s integration, several factors are required, including but not limited to:
-
A semantic model that unifies concepts even if stakeholders use different words for the same notion. This semantic model could match the core concepts in order to allow a holistic view of the company’s information.
-
A standard format (syntactic) product of the ETL process, that wraps data sources and allows a decoupling from specific implementations of data repositories.
-
Well defined protocols, to supply and update the information contained in the new repository.
This research concluded the preliminary evaluation of a budget visualization system implemented to be deployed in a large multi-industry state-owned company. Future work includes the expansion of the visualization tool to different domains (other than IT budgeting), and assess the viability of deploying it in other companies with similar conditions.
References
Bragg, S.M.: Budgeting: A Comprehensive Guide. Accounting Tools (2014)
Bowen, M., Morara, M., Mureithi, S.: Management of business challenges among small and micro enterprises in Nairobi-Kenya. KCA J. Bus. Manag. 2 (2009)
Weill, P., Aral, S.: Generating premium returns on your IT investments. Sloan Manage. Rev. 47, 39–48 (2006)
Organisation for Economic Cooperation and Development: OECD Best Practices for Budget Transparency. http://www.oecd.org/gov/budgeting/best-practices-budget-transparency.htm
Gartner: Manage four views of the IT Budget (2012)
ESTEP: State-Owned Enterprises in the European Union: ensuring level playing field (2013)
Long, J.O.: ITIL® 2011 At a Glance. Springer, New York (2012)
ISACA: What is COBIT 5? http://www.isaca.org/COBIT
The Open Group: TOGAF 9.1 Chapter 34. Content Metamodel
The Open Group: TOGAF®. http://www.opengroup.org/subjectareas/enterprise/togaf
ISO: ISO/IEC 27000. http://www.iso.org/iso/home.html
Curley, M.: Introducing an IT capability maturity framework. In: Filipe, J., Cordeiro, J., Cardoso, J. (eds.) ICEIS 2007. LNBIP, vol. 12, pp. 63–78. Springer, Heidelberg (2008). doi:10.1007/978-3-540-88710-2_6
Neo4 J: Neo4j: The World’s Leading Graph Database. http://neo4j.com/
Holzschuher, F.: Performance of graph query languages comparison of cypher, gremlin and native access in Neo4j, pp. 195–204 (2013)
Hunger, M., Boyd, R., Lyon, W.: The Definitive Guide to Graph Databases for the RDBMS Developer. Neo Technology (2016)
Bostock, M.: D3 Data-Driven Documents. https://d3js.org/
Guo, Y., Spínola, R.O., Seaman, C.: Exploring the costs of technical debt management – a case study. Empir. Softw. Eng. 21, 159–182 (2016)
Acknowledgment
This work was partially supported by Research Center for Communication and Information Technologies (CITIC) at University of Costa Rica. Grant No. 834-B4-412.
Author information
Authors and Affiliations
Corresponding author
Editor information
Editors and Affiliations
Rights and permissions
Copyright information
© 2016 IFIP International Federation for Information Processing
About this paper
Cite this paper
Pacheco, A., López, G., Marín-Raventós, G. (2016). Visualizing IT Budget to Improve Stakeholder Communication in the Decision Making Process. In: Tjoa, A., Xu, L., Raffai, M., Novak, N. (eds) Research and Practical Issues of Enterprise Information Systems. CONFENIS 2016. Lecture Notes in Business Information Processing, vol 268. Springer, Cham. https://doi.org/10.1007/978-3-319-49944-4_21
Download citation
DOI: https://doi.org/10.1007/978-3-319-49944-4_21
Published:
Publisher Name: Springer, Cham
Print ISBN: 978-3-319-49943-7
Online ISBN: 978-3-319-49944-4
eBook Packages: Business and ManagementBusiness and Management (R0)

