Abstract
COVID-19 has spread worldwide and the World Health Organization was forced to list it as a Public Health Emergency of International Concern. The disease has severely impacted most of the people because it affects the lung and causes severe breathing problems and lung infections. Differentiating other lung ailments from COVID-19 infection and determining the severity is a challenging process. Doctors can give vital life-saving services and support patients’ lives only if the severity of their condition is determined. This work proposed a two-step approach for detecting the COVID-19 infection from the lung CT images and determining the severity of the patient’s illness. To extract the features, pre-trained models are used, and by analyzing them, integrated the features from AlexNet, DenseNet-201, and ResNet-50. The COVID-19 detection is carried out by using an Artificial Neural Network(ANN) model. After the COVID-19 infection has been identified, severity detection is performed. For that, image features are combined with the clinical data and is classified as High, Moderate, Low with the help of Cubic Support Vector Machine(SVM). By considering three severity levels, patients with high risk can be given more attention. The method was tested on a publicly available dataset and obtained an accuracy of 92.0%, sensitivity of 96.0%, and an F1-Score of 91.44% for COVID-19 detection and got overall accuracy of 90.0% for COVID-19 severity detection for three classes.
1 Introduction
There were 4,724,876 deaths reported to the World Health Organization as on September 24, 2021. Coronavirus spread rapidly and particularly has a negative impact on patients who already have other illnesses. People are now being affected more by the post COVID-19 syndrome. Coronaviruses infect the lungs and make it difficult for individuals to breathe. As a result, early detection of COVID-19 infection and evaluation of its severity is critical. This can help to minimize the disease’s death rate and spread rate.
The COVID-19 could be detected using a variety of ways. Real-time Reverse Transcription Polymerase Chain Reaction (RT-PCR), Computed Tomography (CT), and radiographs are some methods. CT is useful for diagnosing various disease conditions since it gives tomographic images. There are many methods reported in CT to detect the COVID-19.
The machine learning methods play a vital role in detecting the COVID-19 from CT images. The severity of the disease can also be efficiently detected with the help of machine learning algorithms. The classification by CO-RADS is a standardized reporting system for patients who have COVID-19. The COVID-19 infection is graded from CO-RADS 1, which indicates the very low, to CO-RADS 5, which indicates the high severity. Severity detection is also an essential step in order to make the situation under control.
A step-by-step architecture for detecting the severity of the COVID-19 patients is proposed. The first step is to detect COVID 19 infection, and the second is to determine the severity of the infection. We investigated the feature extraction of different pre-trained networks as well as the power of the artificial neural network for COVID-19 identification in this work. The image features are combined with clinical data for severity detection and tested with multiple machine learning algorithms to find the optimum severity detection model.
Original contributions in this work are:
-
1.
Proposal of a method for detecting COVID-19 from Lung CT images by combining features from different pre-trained networks.
-
2.
In this study, authors have combined the clinical data along with the image features to detect the severity of the input Lung CT image.
-
3.
Most of the work so far has considered only two severities. That is either severe or non-severe. In this work, three-class severity detection, that is, HIGH, MODERATE, and LOW severity has been considered. By doing so, higher-risk patients can easily recognized and more attention can be provided, thereby reducing the life risk rate.
-
4.
There exist works detecting the severity either by image or from the clinical data. In this work, a combined model of incorporating both the image features and the clinical data is used for improving the system’s accuracy.
2 Related works
The attention-based deep architecture was introduced by Liu et al. for the COVID-19 detection [1]. Wang et al. proposed a COVID-19 classification method for the 3D CT volume [2]. It consists of three stages: the network stem, residual blocks, and the progressive classifier. In the first stage, they used a 3D kernel of size 5 \(\times\) 7 \(\times\) 7 followed by a batch norm and a pooling layer. Two residual blocks are incorporated in the second stage. The third stage, known as progressive classifier, contains three 3D convolutions. The third stage provides the probabilities of COVID positive and negative. To reduce the false positives, segmented the COVID-19 infection from unsupervised lung segmentation results. COVID-19 was distinguished from influenza-A viral pneumonia (IAVP) and healthy tissues by Xu et al. [3]. It consists of preprocessing stage, candidate region segmentation, a classification method, and an overall infection prediction method.The lesion patches were segmented using a region proposal network. The features from the patches are extracted using ResNet-18, and the infection score is calculated using a Noisy-OR Bayesian algorithm. Zhang et al. introduced a seven-layer Convolutional Neural Network (CNN) architecture with stochastic pooling to do the classification [4]. In this work, 14 augmentations are used to enrich the training set, and stochastic pooling is used to reduce the dimensions. A multi-view fusion-based method was proposed by Wu et al. using the axial, coronal, and sagittal views [5]. The CT slices in three views are segmented using a thresholding and optimization algorithm as a preprocessing. A three-branch deep architecture with ResNet-50 was introduced to get the COVID-19 risk value. He et al. implemented self-supervised transfer learning for the COVID-19 detection. To address the limited dataset, they introduced self-supervised learning [6]. Sakagianni et al. [7] suggested auto-ML platforms to do the COVID-19 detection. Aswathy et al. conducted a comparative study of different pre-trained feature extraction methods and classifiers for a publicly available COVID-19 dataset [8].
Severity detection is an important task so that the high-risk patients will get more attention. The artificial intelligence methods play a vital role in detecting the severity from the CT images. The method proposed by Chaganti et al. first segmented the lungs and lobes from the CT volume [9]. Once the lung regions are segmented, the lung abnormality is segmented using a DenseUNet with anisotropic kernels. Then the percentage of opacity, percentage of high opacity, lung severity score, and lung high opacity score are calculated. Pu et al. segmented the lung using a UNet framework, with 96 \(\times\) 96 \(\times\) 96 patches and an adam optimizer [10]. Then computed a threshold to detect the infected area in the lung. Two consecutive slices are taken and registered with an elastic registration algorithm to calculate the disease progression. The performance measure used is the Dice Score. Shen et al. proposed a method to find the severity of the COVID-19 [11]. The different steps involved in this work are segmentation of the lung, five lobes, and the pulmonary vessels. Once identified these regions, the pulmonary regions are subtracted from the lung region. After the detection of infection was performed, the Pearson correlation coefficient was used to detect the severity. Xiao et al. proposed a multiple instance learning framework to detect the severity condition of COVID-19 [12]. A number of patches were extracted from the input CT volume, ResNet-34 based deep architecture is used to find out the patch probability. Based on that, a classification is performed. Tang et al. [13] make use of Random forest to make a binary classification as severe or non-severe. They extracted sixty-three quantitative features and are for the severity detection. VB-Net was explored by Shang et al. to segment and quantify the infection regions automatically [14]. The contracting path in VB-Net performs downsampling and captures the global features. The expanding path performs upsampling and extracts the deeper features. Dice similarity coefficient and percentage of infection are calculated. Aswathy et al. conducted a severity detection work in which the effectiveness of data augmentation is analyzed and classified the input CT image as high, medium, or low severity [15]. Ravi et al. used a Deep learning-based meta-classifier approach for COVID-19 classification from CT and chest X-ray images [16]. Research based on blockchain approaches [17] [18] and lung infection segmentation from 3D lung volume [19] is going on due to the pandemic nature of the COVID-19 disease.
3 Materials and methods
3.1 Dataset
Two publicly available data sets are used in this study. COVID-CT dataset [20] for detecting whether a patient has COVID-19 or not and COVID-19 dataset Sars-cov-2, 2020 [21] for getting the clinical data.
The COVID-CT dataset by Zhao et al. [20] contains of 349 COVID-19 infected images and 397 CT lung images infected by other diseases. Some sample images are shown in Fig. 1. The metadata with this data set consists of filename, age, gender, location, medical history, time, inference, other diseases, Severity level (High, Moderate, Low), etc. The severity level is taken from this metadata, and all other attributes are discarded since it doesn’t provide valid information for the prediction of severity. Fig. 1 shows the COVID-19 infected and other infected images in the dataset.

CT COVID-19 images. Top row represents positive cases and bottom row represents negative cases
This dataset [21] consists of 32 attributes. From that, nine symptoms are chosen based on the World Health Organization guidelines. To predict the severity with the help of clinical data and CT images, the features were chosen from clinical data are Fever, Tiredness, Dry-Cough, Difficulty-in-Breathing, Sore-Throat, Pains, Nasal-Congestion, Runny-Nose and Diarrhea.
3.2 Methodology
The goal of this study is to distinguish COVID-19 infection from other lung infected/normal cases and then estimate severity based on the image features and clinically relevant symptoms. Many of the COVID-CT ’s in the data set are Non-COVID images making it is challenging to distinguish whether the lung infected by COVID-19 or other infections. Feature extraction is very important for image classification applications. Nowadays, CNN can represent the image features better than any other statistical feature extraction method based on colour, texture, and intensity. In the case of medical imaging, pre-trained networks are beneficial for feature extraction purposes.
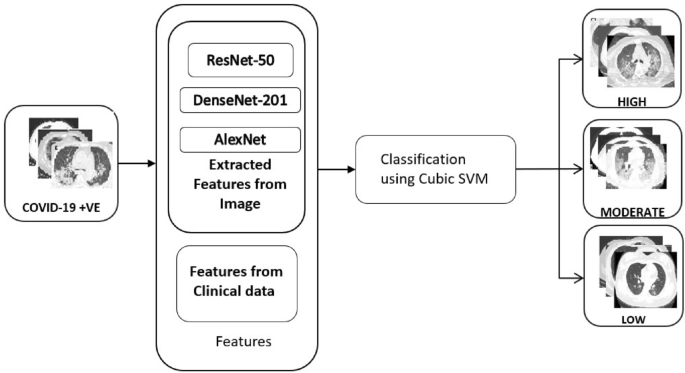
In the first phase, transfer learning of the pre-trained networks, AlexNet, DenseNet-201, and ResNet-50, is used to detect whether COVID-19 infects the lung. The features are extracted, combined, and trained in an ANN to predict COVID-19. Once it is detected, the severity detection is performed by using the image features and the symptomatic features. Here three types of severity High, Moderate, and Low, are considered. The architecture is shown in Fig. 2.

Architecture of the proposed system
3.2.1 Preprocessing
The data set consists of images with various sizes and bit depths. To input the images into different pre-trained networks, convert each of the images into the corresponding pre-trained network’s input size and bit depth.
3.2.2 COVID-19 detection
Deep Learning is a subfield of machine learning which is a computational model developed by inspiring the way in which the brain responds to external factors. Many convolutional filters are used to extract the different level features from the input. Each layer consists of a different number of filters, kernel size, and each filter learns different features. To get different feature maps, one can make use of the pre-trained models without its final fully connected layer. This work combined features from AlexNet, DenseNet-201, and ResNet-50. By combining, the system got the most relevant features, having a size of 3000 for each image. These features are inputted into a neural network to classify it as either COVID-19 infected or any other lung infected/normal CT image. The data is divided into 70% for training, 15% validation, and 15% for testing.
AlexNet [22] won first prize in the ImageNet competition in 2012 and can input an image size of 224 \(\times\) 224. It has eight layers, five of which are convolutional, and the remaining three are fully connected layers. AlexNet is the first network to incorporate the ReLU activation function, which will increase the network’s training time. The DenseNet-201 [23] is a 201 layered architecture in which each layer is connected to every successive layer in a feedforward manner. Thus this network gains collective higher-level features. Since there is a connection to each layer, the errors can be propagated backward easily. Zhang et al. [24] developed ResNet-50, a 50-layer CNN architecture that incorporates skip connections. The residual blocks are used in ResNet-50 to tackle the vanishing gradient problem. The pre-trained model acts as a feature extractor by taking the features from the fully connected layers which appear before the softmax layer. The architecture is shown in Fig. 2. Sample activations using the first layer of the pre-trained networks, ResNet-50, AlexNet, and DenseNet-201, are shown in Fig.3. Sixteen sample activation functions corresponding to the input image are shown as 4x4 tiles. Using a set of convolutional, activation, and pooling layers, got relevant features from ResNet-50, AlexNet, and DenseNet-201. Here the features are extracted from the ’fc1000’ of the ResNet-50 architecture, ’fc1000’ of the DenseNet-201 architecture, and ’fc8’ of AlexNet architecture.

Activation functions (a) Input image (b) ResNet-50 (c) AlexNet (d) DenseNet-201
For the classification, a three-layer neural network design is employed. There are 3000 neurons in the input layer, 20 hidden neurons in the hidden layer, and two neurons in the output layer. Here the sigmoid activation function is used. It is also known as a logistic function that maps the input value between 0.0 and 1.0. The back-propagation algorithm is used for weight learning. In a normal back-propagation algorithm, weights are adjusted in the steepest descent direction, which doesn’t guarantee faster convergence. The scaled conjugate algorithm is used, which eliminates the need for a line search in each iteration.
3.2.3 COVID-19 severity detection
COVID-19 severity detection is an important step for giving life-saving support to the patients in order to save their lives. In this study, the CT image features along with the clinical data are used to detect the severity condition of the patient. The data set [20] consists of 169 low severity CT images, 94 moderate severity images, and 86 high severity images. Some sample images are shown in Fig.4. Looking at the image itself, it is clear that it is difficult to determine the severity range. Suma et al. [25] conducted a study to determine the severity of patients’ conditions based on clinical data. She identified the most important features as part of her work. Based on that, we chose the clinical data and added the extracted image features to detect severity.

High severity(Top row), Moderate severity (Middle row), Low severity(Bottom row)
Fig.5 shows the detailed architecture of the severity detection system. To detect severity, features taken from AlexNet, DenseNet-201, and ResNet-50 are used. For each CT scan, the appropriate clinical data is merged with these features to produce a feature vector of size 3009. Then these features, along with the ground truth, are inputted to the cubic SVM to perform the classification. The SVM is a well-known supervised machine learning algorithm that finds a hyperplane with large marginal width. When the problems are nonlinear, they can be solved using different kernel functions. This work investigated different kernel functions, and cubic SVM produced better results.
Architecture of the severity detection system
The cubic kernel can be represented as
4 Results and discussion
Since the main aim of this work is to find out the severity condition of the patients, the metrics used to evaluate the system are Sensitivity, Specificity, Accuracy, and F1-Score. To perform the analysis, calculated the performance measures for both the COVID-19 detection and the severity.
4.1 COVID-19 detection

Comparison of results obtained using different pre-trained network feature extraction with feed-forward network
In order to identify the best-pre-trained models, we performed the analysis with features extracted from various pre-trained models. Multiple combinations of the pre-trained models are analyzed, including Xception, GoogleNet, ResNet-18. The accuracy of COVID-19 detection obtained is shown in Table 1. By analyzing the results, it is observed that using features from a single pre-trained model and giving to a classifier is not giving a good results. When ResNet-50 alone was used, an accuracy of 86.8% was obtained, AlexNet’s accuracy was 84.2%, and DenseNet-201’s accuracy was found to be 87.5%. When these models features were used together, an accuracy of 92.0% was obtained. The graphical representation of COVID-19 diagnosis result is shown in Fig. 6. From this figure, it is observed that the proposed combination has high sensitivity and a high F1-score.
Artificial neural network was trained with different epochs and with different neurons in the hidden layer. The analysis is shown in Table 2. From the table, it is observed that the network with 20 hidden nodes giving better results. When the number of hidden neurons increases above 20, it doesn’t provide satisfactory results. So the number of hidden layer neurons was set as 20. Table 3 depicts the confusion matrix that was obtained. Fig. 7. represents the ROC curve of the COVID-19 diagnosis system. Table 4 compares the proposed work with different state of the art approaches mentioned in the literature.

ROC curve of COVID-19 diagnosis system
Liu et al. [1] proposed a method based on lesion attention-based deep neural network and he obtained an accuracy of 88.6%. Wang et al. [2] considered the 3D CT volumes using deep architecture and obtained an accuracy of 90.1%. Xu et al. got an accuracy of 86.7%. Zhang et al. [4] used a private dataset and obtained an accuracy of 94%. Wu et al. [5] used a private dataset and got an accuracy of 76%. The work proposed by He et al. [6], got an accuracy of 86%. Sakagianni et al. [7] used the same data set and got a sensitivity of 88.31%.
4.2 COVID-19 severity detection
Most of the works reported are detecting the binary severity condition. That is either severe or non-severe. In this work, three severity classes are considered. The performance of various classifiers was analyzed to detect the severity. Table 5 shows the performance analysis of different classifiers.
From this, it is observed that the SVM with the cubic kernel is giving better results. The ensemble classifier is giving an accuracy of 88.4%. The proposed method achieved a good classification accuracy, and the confusion matrix is shown in Table 6. The test images were taken in random. High severity is represented by class1, Moderate severity by class2, and low severity is by class3. Results obtained from the proposed COVID-19 severity detection method for three classes are given in Table 7.
Table 8 shows a comparative study with other severity detection methods in the literature.
Most of the works are focused on binary classification. Different authors used different evaluation methods to find out the severity of the lung infection. Chaganti et al. [9] segmented the infected lung regions using s Dense-UNet architecture with anisotropic kernels. The Pearson correlation coefficient is used to evaluate the severity. Pu et al. [10] proposed a method based on UNet to segment the infected area and lung boundary. The dataset consists of 72 COVID-19 and 120 other volumes. The method got a sensitivity and specificity of 95% and 84%. An adaptive region growing of the lung segmentation volume was proposed by Shen et al. [11]. Here also the Pearson correlation coefficient was used to evaluate the performance. The study was conducted on a data set consist of 44 patient’s CT images. Xiao et al. [12] developed a method for the binary severity prediction using ResNet-34 architecture. They used 23,812 images and got a precision value of 81.3%. VB-Net was explored by the Shang et al. and used the Dice similarity coefficient to detect the severity. The capability of the machine learning algorithm explored by Tang et al. [13]. This work examined the chest CT images of 176 patients and got an accuracy of 87.5%. The proposed method considered the three severity levels and got an overall accuracy of 90.0%.
5 Conclusion and future scope
This work proposed a COVID-19 severity detection system in light of the world’s current pandemic scenario. This can be used to assist doctors in determining the severity of the situation and making the required arrangements. Normal and other infected CT lung images are included in the Non-COVID data set used in this investigation. The efficacy of pre-trained feature extraction methods and artificial neural networks is identified and applied to obtain more accurate findings in this study. By combining the features from AlexNet, ResNet-50 and DenseNet-201 got an accuracy of 92%. Most works concentrate on the detection of COVID-19. This work detects the severity in three levels by applying machine learning techniques. The extracted features from these networks were used with the clinical data for the severity detection and got an accuracy of 90.2%. As future work, authors plan to segment the amount of infection in the Lung CT image and make a classification based on different lung infections.
Supplementary information
The source code of this work can be found in http://www.mirworks.in/downloads.php
Data availibility
Data and source code is completely available. Check the supplementary information section.
References
Liu B, Gao X, He M, Liu L, Yin G (2020) A fast online covid-19 diagnostic system with chest ct scans. In: Proceedings of KDD, vol. 2020
Wang X, Deng X, Fu Q, Zhou Q, Feng J, Ma H, Liu W, Zheng C (2020) A weakly-supervised framework for covid-19 classification and lesion localization from chest ct. IEEE Trans Med Imaging 39(8):2615–2625
Xu X, Jiang X, Ma C, Du P, Li X, Lv S, Yu L, Ni Q, Chen Y, Su J et al (2020) A deep learning system to screen novel coronavirus disease 2019 pneumonia. Engineering 6(10):1122–1129
Zhang Y-D, Satapathy SC, Zhu L-Y, Górriz JM, Wang S-H (2020) A seven-layer convolutional neural network for chest ct based covid-19 diagnosis using stochastic pooling. IEEE Sensors Journal
Wu X, Hui H, Niu M, Li L, Wang L, He B, Yang X, Li L, Li H, Tian J et al (2020) Deep learning-based multi-view fusion model for screening 2019 novel coronavirus pneumonia: a multicentre study. Eur J Radiol 128:109041
He X, Yang X, Zhang S, Zhao J, Zhang Y, Xing E, Xie P (2020) Sample-efficient deep learning for covid-19 diagnosis based on ct scans. medrxiv
Mantas J et al (2020) Setting up an easy-to-use machine learning pipeline for medical decision support: a case study for covid-19 diagnosis based on deep learning with ct scans. Public Health Dur. Pandemic 272:13
SS VC, et al: Comparative study of pretrained network feature extraction and classifiers for covid-19 detection. In: 2021 8th International Conference on Smart Computing and Communications (ICSCC), pp. 12–16 (2021). IEEE
Chaganti, S, Balachandran, A, Chabin, G, Cohen, S, Flohr, T, Georgescu, B, Grenier, P, Grbic, S, Liu, S, Mellot, F, et al.: Quantification of tomographic patterns associated with covid-19 from chest ct. ArXiv (2020)
Pu J, Leader JK, Bandos A, Ke S, Wang J, Shi J, Du P, Guo Y, Wenzel SE, Fuhrman CR et al (2021) Automated quantification of covid-19 severity and progression using chest ct images. Eur Radiol 31(1):436–446
Shen C, Yu N, Cai S, Zhou J, Sheng J, Liu K, Zhou H, Guo Y, Niu G (2020) Quantitative computed tomography analysis for stratifying the severity of coronavirus disease 2019. Journal of pharmaceutical analysis 10(2):123–129
Xiao, L.-s, Li, P, Sun, F, Zhang, Y, Xu, C, Zhu, H, Cai, F.-Q, He, Y.-L, Zhang, W.-F, Ma, S.-C, et al.: Development and validation of a deep learning-based model using computed tomography imaging for predicting disease severity of coronavirus disease 2019. Frontiers in bioengineering and biotechnology, 898 (2020)
Tang Z, Zhao W, Xie X, Zhong Z, Shi F, Ma T, Liu J, Shen D (2021) Severity assessment of covid-19 using ct image features and laboratory indices. Phys Med Biol 66(3):035015
Shan, F, Gao, Y, Wang, J, Shi, W, Shi, N, Han, M, Xue, Z, Shen, D, Shi, Y.: Lung infection quantification of covid-19 in ct images with deep learning. arXiv preprint arXiv:2003.04655 (2020)
Aswathy A, Hareendran A, SS VC (2021) Covid-19 diagnosis and severity detection from ct-images using transfer learning and back propagation neural network. J Infect Public Health 14(10):1435–1445
Ravi V, Narasimhan H, Chakraborty C, Pham TD (2021) Deep learning-based meta-classifier approach for covid-19 classification using ct scan and chest x-ray images. Multimedia Systems, 1–15
Yu K, Tan L, Shang X, Huang J, Srivastava G, Chatterjee P (2020) Efficient and privacy-preserving medical research support platform against covid-19: a blockchain-based approach. IEEE consumer electronics magazine 10(2):111–120
Manoj M, Srivastava G, Somayaji SRK, Gadekallu, TR, Maddikunta PKR, Bhattacharya S (2020) An incentive based approach for covid-19 planning using blockchain technology. In: 2020 IEEE Globecom Workshops (GC Wkshps, pp. 1–6. IEEE
Aswathy A, SS VC, (2022) Cascaded 3d unet architecture for segmenting the covid-19 infection from lung ct volume. Sci Rep 12:3090
Zhao J, Zhang Y, He X, Xie P (2020) Covid-ct-dataset: a ct scan dataset about covid-19. arXiv preprint arXiv:2003.13865490
Angelov P, Almeida Soares E (2020) Sars-cov-2 ct-scan dataset: A large dataset of real patients ct scans for sars-cov-2 identification. MedRxiv
Krizhevsky A, Sutskever I, Hinton GE (2012) Imagenet classification with deep convolutional neural networks. Advances in neural information processing systems 25
Huang G, Liu Z, Van Der Maaten L, Weinberger KQ (2017) Densely connected convolutional networks. In: Proceedings of the IEEE Conference on Computer Vision and Pattern Recognition, pp. 4700–4708
He K, Zhang X, Ren S, Sun J (2016) Deep residual learning for image recognition. In: Proceedings of the IEEE Conference on Computer Vision and Pattern Recognition, pp. 770–778
Suma L, Anand H, et al. (2021) Nature inspired optimization model for classification and severity prediction in covid-19 clinical dataset. Journal of Ambient Intelligence and Humanized Computing, 1–13
Acknowledgements
Authors would like to extend gratitude to all researchers and doctors affiliated to Machine Intelligence Research(MIR) group for the support they have provided during each phase of this work.
Funding
Authors hereby confirm that no funding has been received for this work.
Author information
Authors and Affiliations
Corresponding author
Ethics declarations
Conflict of interest
Authors hereby confirm that there is no conflict of interest or competing interest for this work submitted in this journal.
Ethics approval
This manuscript does not contain any studies with animals and no harm has been done during any phase of the work.
Consent for publication
All authors have provided consent in writing for publishing this manuscript in this journal.
Additional information
Publisher's Note
Springer Nature remains neutral with regard to jurisdictional claims in published maps and institutional affiliations.
Rights and permissions
About this article

Cite this article
Aswathy, A.L., Anand, H.S. & Chandra, S.S.V. COVID-19 severity detection using machine learning techniques from CT-images. Evol. Intel. 16, 1423–1431 (2023). https://doi.org/10.1007/s12065-022-00739-6
Received:
Revised:
Accepted:
Published:
Issue Date:
DOI: https://doi.org/10.1007/s12065-022-00739-6