Abstract
As a popular nondestructive testing (NDT) technique, thermal imaging test demonstrates competitive performance in crack detection, especially for detecting subsurface cracks. In thermal imaging test, the temperature of the crack area is higher than that of the non-crack area during the NDT process. By extracting the features of the thermal image sequences, the temperature curve of each spatial point is employed for crack detection. Nevertheless, the quality of thermal images is influenced by the noises due to the complex thermal environment in NDT. In this paper, a modified generative adversarial network (GAN) is employed to improve the image segmentation performance. To improve the feature extraction ability and alleviate the influence of noises, a penalty term is put forward in the loss function of the conventional GAN. A data preprocessing method is developed where the principle component analysis algorithm is adopted for feature extraction. The data argumentation technique is utilized to guarantee the quantity of the training samples. To validate its effectiveness in thermal imaging NDT, the modified GAN is applied to detect the cracks on the eddy current pulsed thermography NDT dataset.
Introduction
In the past few decades, thermography nondestructive testing (NDT) methods have been widely applied to device assessment and component inspection in additive manufacturing, aerospace, transportation, electrical engineering and mechanical engineering [1, 2]. It is known that the thermography NDT methods have the advantages of fast detection speed, high detection accuracy and nondestructive evaluation [3,4,5]. It should be pointed out that the infrared thermography NDT methods can be divided into two types, namely the active infrared thermography (AIT) methods and the passive infrared thermography (PIT) methods. AIT methods employ an extra heating source to produce a temperature contrast between crack and normal areas. In PIT, the temperature difference of the crack and non-crack areas is measured without using extra heating sources. In general, the detection performance of the AIT methods outperforms the PIT ones due to the fact that various heating sources would lead to a large thermal contrast between crack and normal areas [6,7,8].
As a powerful AIT method, the eddy current pulsed thermography (ECPT) method has been successfully applied to various NDT tasks because of its simple operation and wide scanning range. In ECPT, an electromagnetic pulse with high current is applied to induce the eddy current in the specimen, and the heating distribution of the specimen is recorded by the infrared camera. Similar to other thermography methods, it is a challenging task in ECPT to build a physical model to accurately describe the NDT process because of complex thermal environment and various disturbances. In this context, a reasonable yet effective way is to deal with the acquired ECPT images for crack detection by using the data analysis techniques.
Thanks to their powerful capabilities in feature extraction, machine learning algorithms have been widely utilized in thermal image analysis [4, 5, 9,10,11,12,13]. A variety of image processing methods have been successfully applied for feature extraction of the thermal images such as the discrete wavelet transform method [14], the K-means clustering algorithm [15] and the thermal resistance effect model-based method [16]. The aforementioned image processing algorithms are normally applied to handle one specific thermal image through the ECPT-based NDT process [17]. It is worth mentioning that such a thermal image is manually selected according to experimental experience, where the image processing performance is largely affected by the expert knowledge.
To overcome the limitation of using one manually chosen image for crack detection, machine learning methods have been successfully applied for crack detection by using multiple NDT images (i.e., the NDT image sequences) during the past few years [18]. For instance, the frequency pattern extraction methods based on the Fourier transform have been adopted to enhance the image contrast through the phase map for detecting the cracks based on NDT image sequences [19, 20]. The principal component analysis (PCA) algorithms have been successfully adopted to extract the thermal features through the entire ECPT-based NDT process for crack detection [21, 22].
Unfortunately, the quality of the thermal images is influenced by the background noises and disturbances caused by experimental environment and material properties. To alleviate the influence of noises and disturbances, the powerful deep learning techniques have been widely adopted for image analysis [23,24,25,26]. For example, a two-stream convolutional neural network has been put forward in [24] for subsurface defect detection. A deep neural network-based subsurface damage detection approach has been developed in [23] for steel bridge defect detection. Among the popular deep learning techniques, the generative adversarial network (GAN) has been widely employed in computation vision thanks to its powerful abilities in data generation and pattern recognition [27, 28]. In fact, GANs have been successfully utilized to generate thermal images for thermographic data analysis [29]. Therefore, a seemingly natural idea is to employ the modified GAN to extract the features of a series of thermal images (which makes full use of the thermal information during the whole ECPT process), and the crack detection is then implemented based on the output of the GAN.
In this paper, a GAN-based crack detection approach is put forward where one designed penalty term is introduced into the loss function of the GAN, which not only enhances the feature extraction ability but also reduces the noises. To be specific, for each spatial point of the thermal image, the corresponding temperature values during the ECPT-based NDT process are fed to the GAN, and a pixel value of this spatial point is generated by the GAN. Then, an image is reconstructed based on these pixels derived by the GAN. Under the effect of the designed penalty term, the pixel difference between the crack area and non-crack area would be enlarged, which benefits the crack detection for the NDT process. In the developed crack detection strategy, the PCA algorithm is employed to alleviate the influence of the thermal transmission through the material. Data argumentation is applied to guarantee the effectiveness of the training data.
The main contributions of this paper can be outlined in the following three aspects:
-
1.
A modified GAN is proposed where a penalty term is introduced in the loss function so as to enhance the feature extraction ability and restrain the effects induced by the noises.
-
2.
The proposed GAN-based method is successfully employed for ECPT crack detection for the first time. With the utilization of the NDT image sequences, the reliability of the crack detection result can be guaranteed.
-
3.
The performance of the developed GAN-based method is comprehensively evaluated for thermal image analysis. Experimental results verify the effectiveness of the developed modified GAN by comparing with that of the conventional GAN. The proposed GAN-based crack detection method is employed to solve a real-world ECPT-based NDT problem.
The rest of this paper is organized as follows. The background of the ECPT technique is provided in "Background", and the experimental setup of the ECPT detection system is also introduced. The methodology of the proposed GAN-based crack detection method is presented in "Methodology", where the basic knowledge of the conventional GAN and the details of the modified GAN are illustrated. Data preprocessing and data augmentation are shown in "Data Preprocessing". "ECPT Images" presents the ECPT images utilized in this paper. In "Experimental Results", experimental results and discussion are provided. The conclusions and the future work are summarized in "Conclusion".
Background
In this section, the basic knowledge of the ECPT technique is provided, and the hardware setup of an ECPT detection system is introduced.
Basic Knowledge of ECPT
ECPT is an effective AIT method for detecting material degradations and failures. In ECPT, the eddy current is induced in the conductive material and generates the Joule heat, which leads to the temperature rise. In the crack area of the specimen, the conductive material influences the eddy current flow as well as the heat conduction, thereby increasing the temperature of the crack area. The thermal imaging system is employed to record the thermal contrast between the crack and non-crack area in the materials. The ECPT-based crack detection approach is displayed in Fig. 1.
The Joule heating of the eddy current in the material is expressed as follows:
where \(J_{s}\) is the eddy current density; Q indicates the sum of the Joule heating; \(\sigma\) indicates the conductivity of the material; and E represents the electric intensity.
In the ECPT, the heat in the crack area is accumulated as the electromagnetic energy continually injects. Furthermore, the heat diffusion causes that the temperature variation of the specimen is a dynamic process. The material heat conduction is given by:
where T represents the abbreviation of the temperature distribution (i.e., T(x, y, z, t)), where x, y, z are the Cartesian coordinates of the three-dimensional space and t is the time stamp; \(\lambda\), \(C_{p}\) and \(\rho\) indicate the thermal conductivity, the heat capacity and the density of the objective material, respectively; and q(x, y, z, t) is the internal heat generation function induced by the Joule heating process [30].
It is worth mentioning that the heat conduction process is slow compared with the thermographic sampling process. Hence, the thermal imaging system is capable of capturing the thermal features of the material (including the crack area). The time domain information of the thermal features is very important for crack detection.
ECPT Detection System
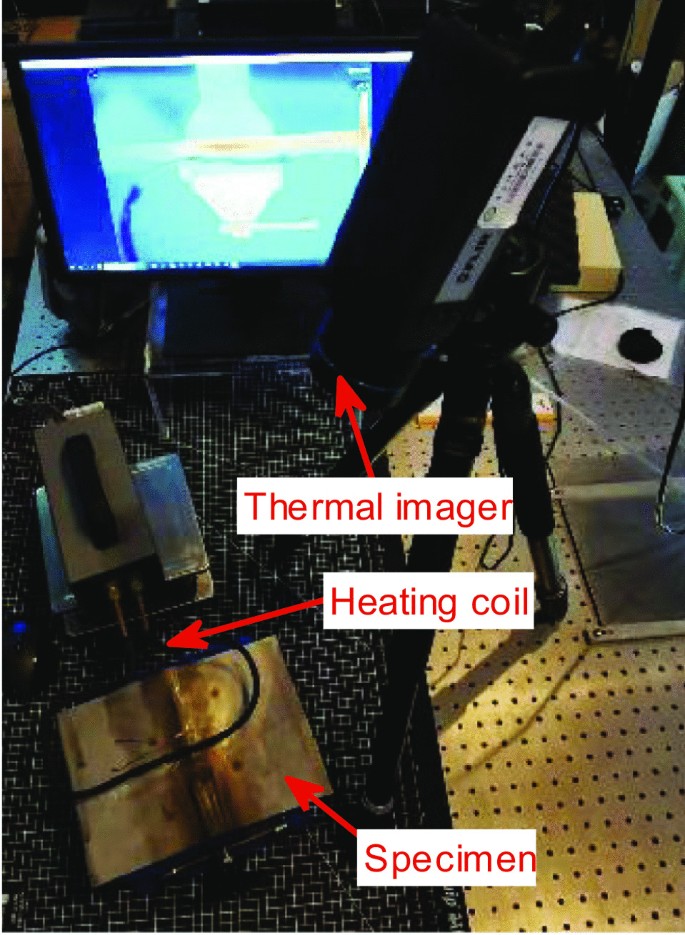
A typical ECPT detection system includes a thermal imager, a heating device (which is also known as an induction heating element), a heating coil and a specimen, which is shown in Fig. 2. A stainless steel specimen with several cracks (consisting of through-hole cracks and normal cracks) is displayed in Fig. 2. The heating coil is driven by the high-frequency and high-power alternating current generator device, which is the core component for energy injecting. By deploying a high-quality thermal imager, the NDT process of the ECPT detection system is recorded. It should be noticed that a computer is employed to control the heating device as well as the thermal imager.
Methodology
Basic Knowledge of the GAN
As a popular generative model in deep learning, the GAN has been successfully applied to various practical applications, e.g., image translation, image synthesis, semantic segmentation and natural language processing. The original GAN consists of a generator and a discriminator. In the original GAN, the input of the generator is random noise. The input of the discriminator is the real data as well as the so-called fake data (produced by the generator). It should be mentioned that the purpose of the discriminator is to accurately identify the real data and the generated fake data. The output of the discriminator is a value in the range of (0, 1). The goal of the generator is to explore the distribution of the training data.
The loss function of the original GAN is shown as follows:
where \(D(\cdot )\) is the discriminator; \(G(\cdot )\) represents the generator; x is real data; z indicates the input of the generator; and \(\mathbb {P}_{r}\) and \(\mathbb {P}_{f}\) denote the distribution of real data and the distribution of the fake data (which is the output data of the generator), respectively.
Modified GAN
In this paper, a modified GAN is put forward to analyze the thermal images (which are obtained by using the ECPT technique) with the aim to identify the cracks. For crack detection, the input of the generator is the thermal signal (which indicates the temperature) of one individual point in the specimen, and the output of the generator is a value which identifies the individual point belonging to a crack or not. By reconstructing the output of the generator (which is trained by Eq. (3)), the obtained image is thus utilized for crack detection. In fact, the temperature of the non-crack area changes relatively slow and the temperature of the crack area changes relatively fast, which makes it difficult to analyze the obtained ECPT thermal images. It should be mentioned that the image contrast of the generated image is relatively small, which may lead to the overlapping of the crack area and the non-crack area. As such, the original loss function of the conventional GAN as shown in Eq. (3) is not suitable for crack detection by using the ECPT technique. In this paper, a modified GAN is put forward where a designed penalty term is introduced in the loss function so as to enhance the contrast ratio of the ECPT detection result. The sigmoid function is chosen as the penalty term in this paper according to its characteristics of 1) smooth; 2) differentiable; and 3) monotonic.
In this paper, a modified loss function is introduced where a penalty term is designed so as to enhance the feature extraction ability and improve the contrast ratio of the reconstructed image. The loss function of the modified GAN is given as follows:
where \(\lambda _{1}\) is the penalty parameter of the introduced penalty term; \(\lambda _{2}\) and \(\lambda _{3}\) are sigmoid function parameters; \(var(*)\) is the variance; P is a constant value; and \(\Vert G(z) \Vert _2\) is the Euclidean norm of G(z). In this paper, we aim to pursue
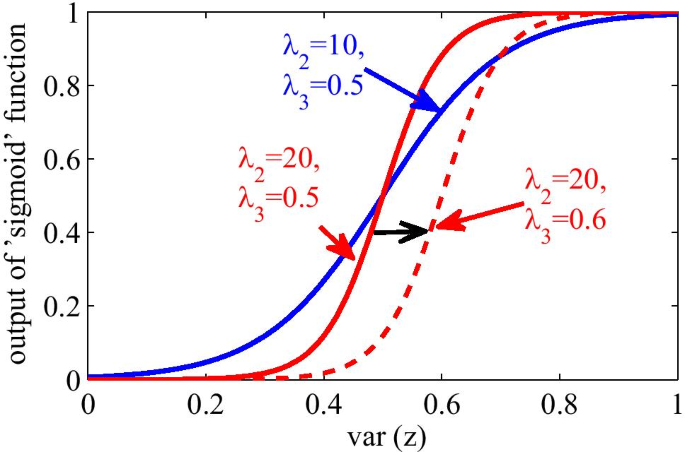
To summarize, the modified loss function is designed to make G(z) as large as possible if the thermal signal z belongs to the crack area. It is challenging to identify whether the point belongs to the crack area or not when G(z) is around 0.5. In this situation, the penalty parameters \(\lambda _{2}\) and \(\lambda _{3}\) are employed to decrease the value of G(z) to a lower one, which contributes to the enhancement of the contrast ratio of the crack area. The influence of \(\lambda _{2}\) and \(\lambda _{3}\) on the sigmoid function is shown in Fig. 3. By selecting \(\lambda _{2}\) and \(\lambda _{3}\), the curve of the sigmoid function is fine-tuned for the training process, which is the nonlinear part of the neural networks.
GAN-Based Crack Detection Method
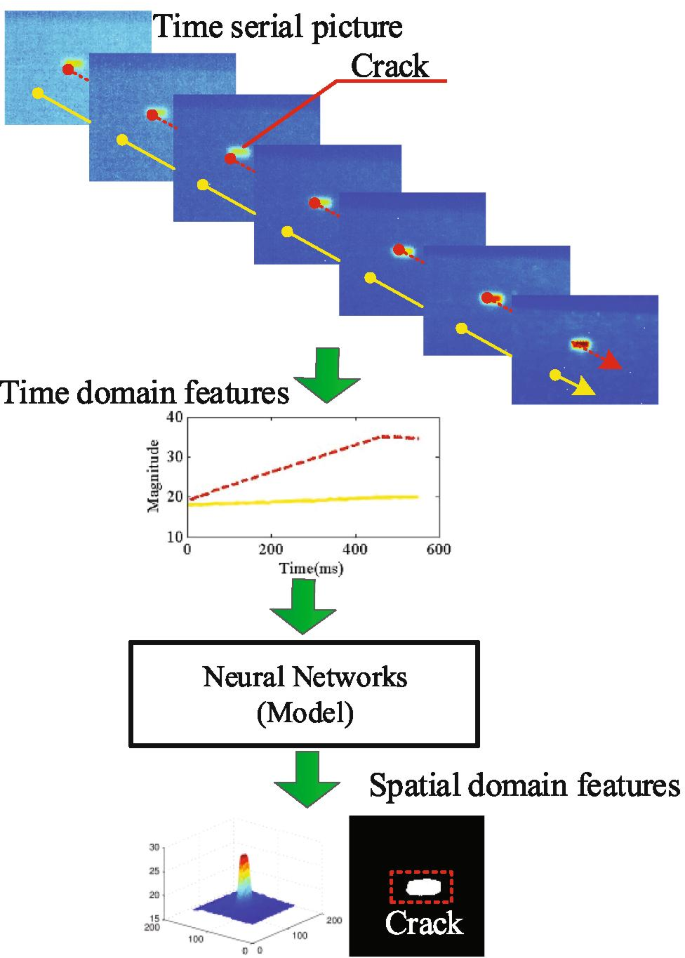
In this paper, the GAN is employed to analyze the thermal features of the ECPT images. The procedure of the GAN-based crack detection method is shown in Fig. 4.
The thermal signal of the spatial points reflects the heat conduction feature of the specimen. As mentioned previously, the temperature of the spatial point (that belongs to the crack) becomes higher within a relatively fast time period than that of the spatial point in the non-crack area. In this case, the temperature distribution of the crack points is different from that of the non-crack points. As shown in Fig. 4, the preprocessed thermal signal is utilized as the training data of the generator instead of random noise. The output of the generator is applied to reconstruct the detection image. Then, the detection image is post-processed by using a manually selected threshold for binarization so as to identify the crack. To summarize, a probability value is obtained to determine whether the corresponding spatial point belongs to the crack or not by extracting the features of the thermal signal by using the GAN.
Data Preprocessing
It is time-consuming and expensive to generate enough effective data for training a satisfactory deep learning model by using the ECPT technique. In the ECPT system, the thermal signal of the spatial points is easily influenced by the high-frequency noise during the NDT process. Therefore, it is of practical importance to preprocess the raw data for the further training process. In this paper, the thermal images captured through the ECPT-based NDT process are studied, and the thermal information of the spatial points in the specimen is investigated for all the selected image frames. In this section, the PCA-based feature selection of the thermal images and the data argumentation are discussed.
PCA-Based Feature Extraction
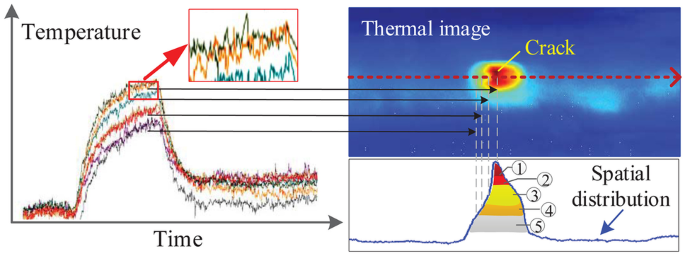
In the ECPT detection system, the thermal imager with high sampling rate captures the thermal images through the NDT process. It should be noted that the detection result of the thermal imaging systems is easily affected by external infrared radiation (produced by the external heating system) and surface radiation of the specimen, which leads to disturbances/noises in the images recorded by the thermal imager. The relationship between the temperature and the spatial information of the thermal signal during the NDT process is depicted in Fig. 5.
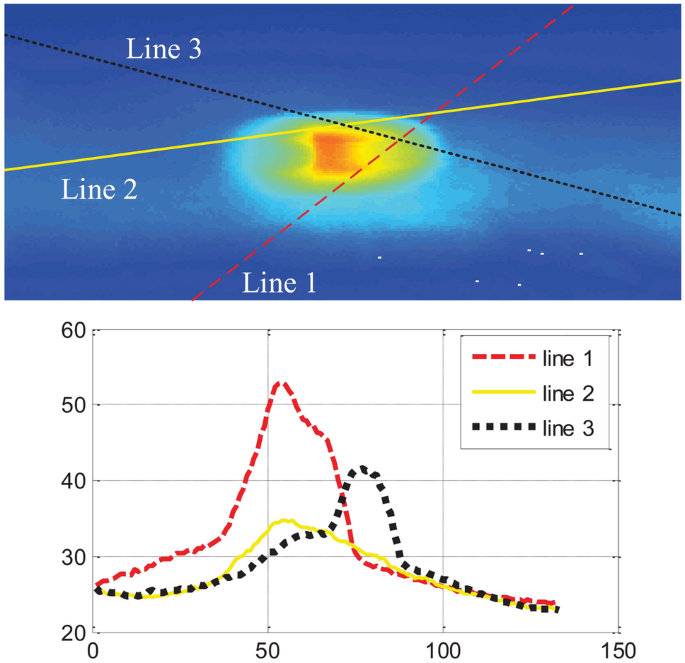
It can be seen in Fig. 5 that the temperature of the points inside/around the crack is much higher than that in other area. In addition, the temperature curve is not smooth due to the existence of noises. The NDT process is continuous, and the temperature of the spatial points around the crack area is also influenced, which makes it difficult to distinguish the crack and non-crack points based on the GAN trained by using the raw data. The temperature distribution of four randomly selected lines of the detected image is depicted in Fig. 6.
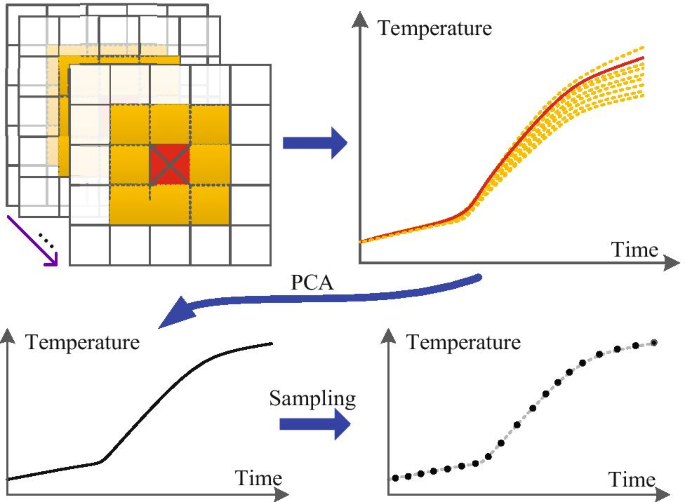
By using the PCA method, the first principal component is used as the generated signal. The procedure of the utilized signal processing method is shown in Fig. 7. The target object and its neighboring spatial points are 9 points in total. The corresponding thermal time series signals are processed by PCA, and then, a new signal is obtained with the main information of 9 signals.
As mentioned previously, the thermal imager captures more than one thousand images in a short time because of its high sampling rate. To be specific, the sampling rate of the thermal imager is 1.5s and the excitation of the eddy current is 0.5s. As the heating process is slow, the temperature of the spatial points remains the same between several frames. It is therefore unnecessary to utilize all the image frames for the training process due to the computational cost. In this paper, the uniform sampling method is employed to select 201 image frames for training the GAN. The preprocessing of the thermal signal is depicted in Fig. 7, which fuses the thermal features extracted through the image sequences. In addition, the preprocessed thermal signals are normalized to improve the generalization ability of the GAN.
In signal processing, the sampling method is equivalent to adding a low pass filter. Through decreasing the sampling rate, the high-frequency components would be restrained. In order to get effective information and avoid the influences of the high-frequency noises, the sampling process is conducted after the PCA-based feature extraction process.
Data Augmentation
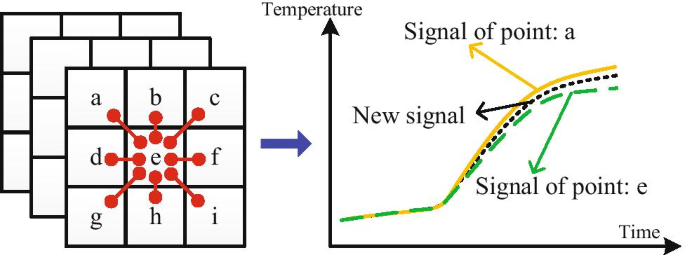
During the NDT crack detection process, a large amount of raw data is collected. Nevertheless, most of the obtained raw data include redundant information or noises, which requires data preprocessing. In this paper, data augmentation is employed to produce enough training data so as to guarantee the generalization ability of the modified GAN algorithm. In particular, an interpolation-based method is designed to generate new data, which is shown in Fig. 8. The value of the generated point is the mean value of the selected points. For example, a new data point m is generated by calculating the mean value of the e and its neighbor e.
The label of the generated new data point is given as follows:
where \(L_{a}\) and \(L_{e}\) represent the label of point A and point B, respectively; & denotes the logical conjunction “and.” It should be noted that the values of the thermal signals extracted by the image sequences are normalized to improve the generalization performance of the GAN.
ECPT Images
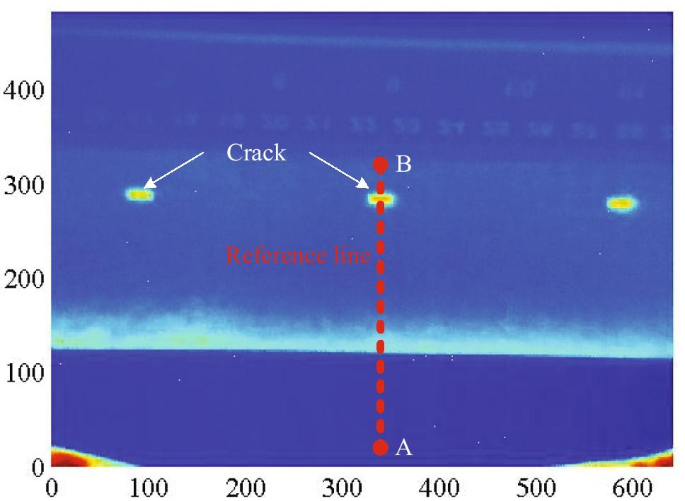
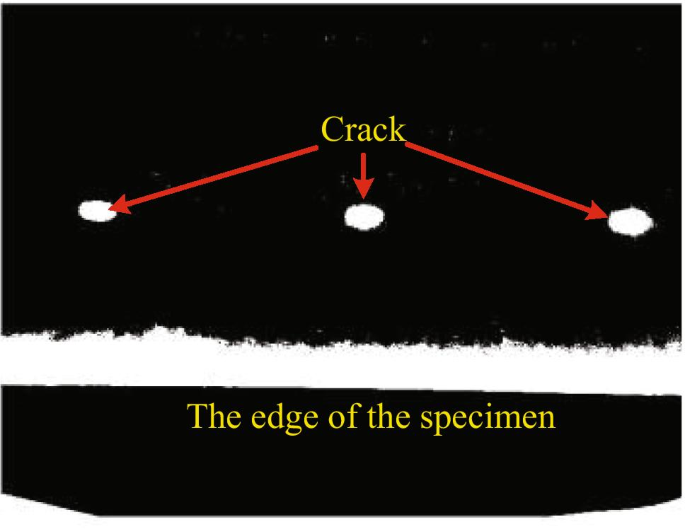
In this paper, the thermal images are preprocessed to extract the thermal signal as the input of the generator. An example of the thermal image captured through the infrared camera is depicted in Fig. 9. In Fig. 9, three cracks with different shapes are identified.
The size of an acquired thermal image (as shown in Fig. 9) is \(480~\times ~640,\) and the total number of pixel points in this image is 307200. In order to enlarge the number of training data, there are more than 920480 data for GAN training by using the data generation method in this paper. The corresponding labeled image of Fig. 9 is shown in Fig. 10. Figure 10 is a binary image, which indicates that the class of the pixel points is only 0 or 1. To be specific, the pixel value of the crack points is 0 and the pixel value of the points in non-crack area is 1.
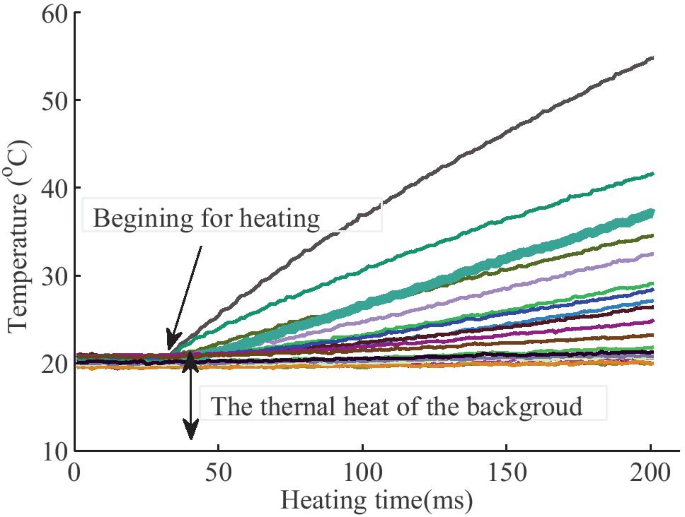
The temperature of the selected 15 pixel points in the reference line (as shown in Fig. 9) is displayed in Fig. 11. Note that the 15 pixel points are uniformly selected from position A to position B. In Fig. 11, the temperature value of the points in different positions starts to rise at different times, which indicates that the thermal energy transfers in the specimen in all directions. In this case, the size of the detected crack area is larger comparing with the size of the real crack area, which makes it difficult to use traditional image processing methods to detect the crack accurately.
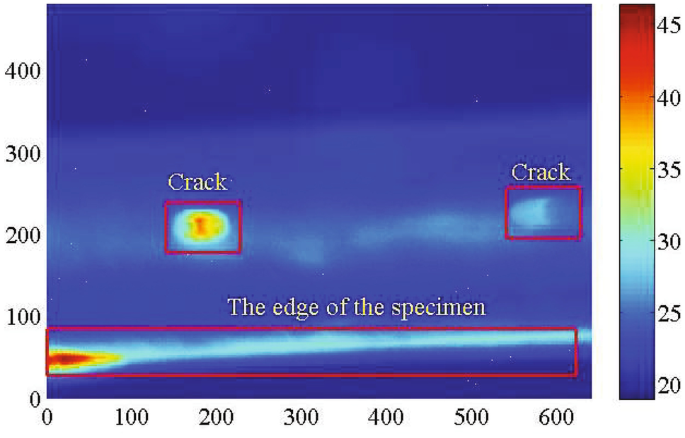
The testing data are the thermal images of the specimen with two cracks, where one crack is a through-hole crack and the other one is a normal crack with a small depth. One image frame of the testing thermal images is depicted in Fig. 12. In Fig. 12, the crack in the left side is the through-hole crack and the other one is the normal crack.
Experimental Results
Results and Discussion
In this paper, the original GAN is employed for crack detection, and the corresponding experimental result is shown in Fig. 13. We can see that most of the background noises are reduced and the cracks are not identified successfully, which indicates that the contrast ratio of the obtained image is not large enough to distinguish the disturbances.
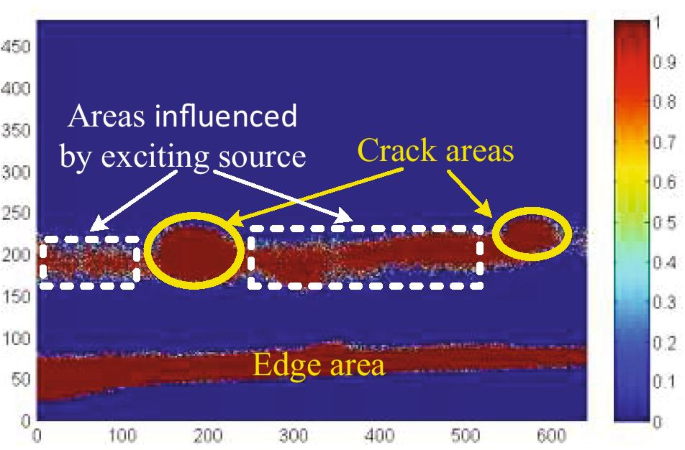
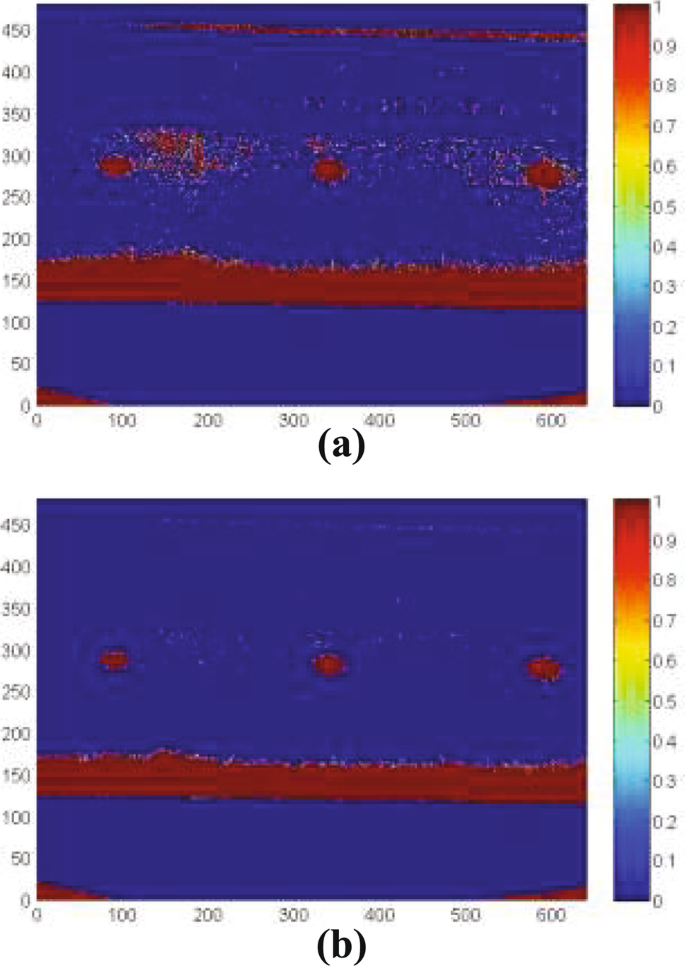
Experiment result of the modified GAN method is shown in Fig. 14. Results of the modified GAN trained by the original data and the PCA-based preprocessed data are depicted in Fig. 14a, b, respectively. Comparing with the result shown in Fig. 13, it can be seen that the contrast ratio of the generated image is relatively high and the background noises are reduced in Fig. 14, which indicates that the modified GAN outperforms the original GAN in dealing with thermal images. In addition, there are fewer noises between the cracks in Fig. 14b than that in Fig. 14a, which demonstrates the effectiveness of the PCA-based data preprocessing method.
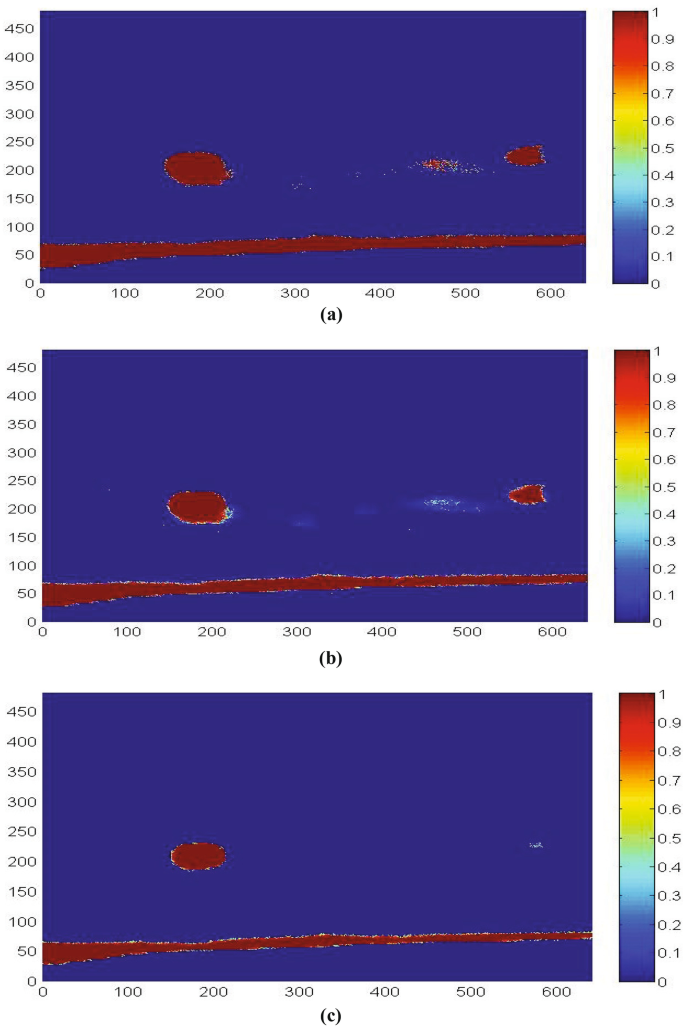
The testing results of the developed GAN-based crack detection method in Fig. 12 are displayed in Fig. 15. Different hyperparameters settings are tested as shown in Fig. 15. For the first experiment, the hyperparameters are set as \(\lambda _{1}=2, \lambda _{2}=0.1, \lambda _{3}=0.1\). In this experiment, \(\lambda _{3}\) is small which makes the thermal signal with small variance that cannot be reduced to a lower value. In this case, there are still some disturbances as shown in Fig. 15a. For the second experiment, the hyperparameters \(\lambda _{2}\) and \(\lambda _{3}\) are fine-tuned to make thermal signals with small variance to be reduced. It can be seen in Fig. 15b that most of the disturbances are alleviated. Figure 15c shows the size of the cracks is also reduced with relatively large hyperparameters. Furthermore, the crack areas are also reduced when enlarging the parameters. Based on results in Fig. 15, we can draw the conclusion that the hyperparameters of the penalty term have large influence on the generalization performance of the GAN.
Conclusion
In this paper, a modified GAN algorithm has been put forward for the crack detection of an ECPT system by analyzing the captured thermal images. Motivated by the sigmoid function, a new penalty term has been designed and added in the loss function of the GAN, where the hyperparameters of the penalty term have been manually chosen according to experimental experience. The deployment of the penalty term has contributed to the feature extraction, and the background noises have been reduced. To extract the features of the thermal data, the PCA algorithm and the data augmentation method have been utilized in data preprocessing. Experimental results have demonstrated the effectiveness of the proposed GAN-based crack detection algorithm on the real-world ECPT dataset. In particular, the modified GAN has shown better performance than the conventional GAN. In our future work, we aim to: 1) develop an automatic hyperparameter selection scheme for GAN-based crack detection system based on evolutionary computation [31,32,33,34,35,36,37]; 2) apply our crack detection system to other thermography NDT tasks; 3) design a novel control strategy to enhance the detection performance of the crack detection system [38,39,40,41,42,43,44,45,46]; and 4) explore the dynamic behavior of the ECPT-based NDT process and study the thermography features based on signal processing and control theory [47,48,49,50,51,52,53,54,55,56].
References
Wilson J, Tian G, Mukriz I, Almond D. PEC thermography for imaging multiple cracks from rolling contact fatigue. NDT & E Int. 2011;44(6):505–12.
Zenzinger G, Bamberg J, Satzger W, Carl V. Thermographic crack detection by eddy current excitation. Nondestruct Test Evaluation. 2007;22(2–3):101–11.
Cheng Y, Tian L, Yin C, Huang X, Cao J, Bai L. Research on crack detection applications of improved PCNN algorithm in MOI nondestructive test method. Neurocomputing. 2018;277:249–59.
Tian L, Cheng Y, Yin C, Ding D, Song Y, Bai L. Design of the MOI method based on the artificial neural network for crack detection. Neurocomputing. 2017;226:80–9.
Tian L, Wang Z, Cheng Y. MOI-based stratified crack detection: A PCA approach, In: Proceedings of the 25th International Conference on Automation and Computing. Lancaster, UK. 2019:1–7.
He Y, Tian GY, Pan M, Chen D, Zhang H. An investigation into eddy current pulsed thermography for detection of corrosion blister. Corros Sci. 2014;78:1–6.
Riegert G, Zweschper T, Busse G. Lockin thermography with eddy current excitation. Quant InfraRed Thermogr J. 2004;1(1):21–32.
Wilson J, Tian GY, Abidin IZ, Yang S, Almond D. Pulsed eddy current thermography: system development and evaluation. Insight-Non-Destruct Test Cond Monit. 2010;52(2):87–90.
Li H-J, Bu Z, Wang Z, Cao J, Shi Y. Enhance the performance of network computation by a tunable weighting strategy. IEEE Trans Emerg Top Comput Intell. 2018;2(3):214–23.
Liu D, Wang Z, Liu Y, Alsaadi FE. Extended Kalman filtering subject to random transmission delays: Dealing with packet disorders. Inf Fusion. 2020;60:80–6.
Liu S, Wang Z, Chen Y, Wei G. Dynamic event-based state estimation for delayed artificial neural networks with multiplicative noises: A gain-scheduled approach. Neural Netw. 2020;132:211–9.
Zhang H, Yue D, Dou C, Zhao W, Xie X. Data-driven distributed optimal consensus control for unknown multiagent systems with input-delay. IEEE Trans Cybern. 2018;49(6):2095–105.
Zhu P, Cheng Y, Bai L, Tian L. Local sparseness and image fusion for defect inspection in eddy current pulsed thermography. IEEE Sensors J. 2018;19(4):1471–7.
Murali K, Reddy DRK, Mulaveesala R. Application of image fusion for the IR images in frequency modulated thermal wave imaging for Non Destructive Testing (NDT). Mater Today: Proc. 2018;5(1):544–9.
Doaei M, Tavallali MS. Intelligent screening of electrofusion-polyethylene joints based on a thermal NDT method. Infrared Phys Technol. 2018;90:1–7.
Thiam A, Kneip JC, Cicala E, Caulier Y, Jouvard JM, Mattei S. Modeling and optimization of open crack detection by flying spot thermography. NDT & E Int. 2017;89:67–73.
Tian G, Gao Y, Li K, Wang Y, Gao B, He Y. Eddy current pulsed thermography with different excitation configurations for metallic material and defect characterization. Sensors 2016;16(6):843.
He Y, Pan M, Luo F. Defect characterisation based on heat diffusion using induction thermography testing. Rev Sci Instrum. 2012;83(10):104702.
Chatterjee K, Tuli S. Image enhancement in transient lock-in thermography through time series reconstruction and spatial slope correction. IEEE Trans Instrum Meas. 2011;61(4):1079–89.
Maldague X, Marinetti S. Pulse phase infrared thermography. J Appl Phys. 1996;79(5):2694–8.
Rajic N. Principal component thermography for flaw contrast enhancement and flaw depth characterisation in composite structures. Compos Struct. 2002;58(4):521–8.
Zhu P, Cheng Y, Banerjee P, Tamburrino A, Deng Y. A novel machine learning model for eddy current testing with uncertainty. NDT & E Int. 2019;101:104–12.
Ali R, Cha YJ. Subsurface damage detection of a steel bridge using deep learning and uncooled micro-bolometer. Constr Build Mater. 2019;226:376–87.
Cao Y, Dong Y, Cao Y, Yang J, Yang MY. Two-stream convolutional neural network for non-destructive subsurface defect detection via similarity comparison of lock-in thermography signals. NDT & E Int. 2020;112:102246.
Liu W, Wang Z, Tian L, Lauria S, Liu X. Melt pool segmentation for additive manufacturing: A generative adversarial network approach. Comput Electr Eng. 2021;92:107183.
Wang H, Cheng R, Zhou J, Tao L, Kwan HK. Multistage model for robust face alignment using deep neural networks. Cogn Comput. in press. https://doi.org/10.1007/s12559-021-09846-5.
F. Zhang, X. Wang, T. Sun and X. Xu, SE-DCGAN: a new method of semantic image restoration. Cogn Comput. in press. https://doi.org/10.1007/s12559-021-09877-y.
Ma Y, Zhong G, Liu W, Wang Y, Jiang P, Zhang R. ML-CGAN: Conditional generative adversarial network with a meta-learner structure for high-quality image generation with few training data. Cogn Comput. 2021;13(2):418–30. https://doi.org/10.1007/s12559-020-09796-4.
Liu K, Li Y, Yang J, Liu Y, Yao Y. Generative principal component thermography for enhanced defect detection and analysis. IEEE Trans Instrum Meas. 2020;69(10):8261–9.
Wang Y, Gao B, Tian G, Woo WL, Miao Y. Diffusion and separation mechanism of transient electromagnetic and thermal fields. Int J Therm Sci. 2016;102:308–18.
Cao J, Bu Z, Gao G, Tao H. Weighted modularity optimization for crisp and fuzzy community detection in large-scale networks. Phys A: Stat Mech Appl. 2016;462:386–95.
Liu W, Wang Z, Zeng N, Yuan Y, Alsaadi FE, Liu X. A novel randomised particle swarm optimizer. Int J Mach Learn Cybern. 2021;12(2):529–40.
Liu W, Wang Z, Liu X, Zeng N, Bell D. A novel particle swarm optimization approach for patient clustering from emergency departments. IEEE Trans Evol Comput. 2018;23(4):632–44.
Liu W, Wang Z, Yuan Y, Zeng N, Hone K, Liu X. A novel sigmoid-function-based adaptive weighted particle swarm optimizer. IEEE Trans Cybern. 2019;51(2):1085–93.
Liu Y, Cheng Q, Gan Y, Wang Y, Li Z, Zhao J. Multi-objective optimization of energy consumption in crude oil pipeline transportation system operation based on exergy loss analysis. Neurocomputing. 2019;332:100–10.
Liu Y, Chen S, Guan B, Xu P. Layout optimization of large-scale oil-gas gathering system based on combined optimization strategy. Neurocomputing. 2019;332:159–83.
Song B, Wang Z, Zou L. On global smooth path planning for mobile robots using a novel multimodal delayed PSO algorithm. Cogn Comput. 2017;9(1):5–17.
Li Q, Shen B, Wang Z, Sheng W. Recursive distributed filtering over sensor networks on Gilbert-Elliott channels: A dynamic event-triggered approach. Automatica. 2020;113:108681.
Li Q, Shen B, Wang Z, Huang T, Luo J. Synchronization control for a class of discrete time-delay complex dynamical networks: A dynamic event-triggered approach. IEEE Trans Cybern. 2019;49(5):1979–86.
Li X, Han F, Hou N, Dong H, Liu H. Set-membership filtering for piecewise linear systems with censored measurements under Round-Robin protocol. Int J Syst Sci. 2020;51(9):1578–88.
Liu L, Ma L, Zhang J, Bo Y. Distributed non-fragile set-membership filtering for nonlinear systems under fading channels and bias injection attacks. Int J Syst Sci. 2021;52(6):1192–205.
Liu Y, Shen B, Shu H. Finite-time resilient H∞ state estimation for discrete-time delayed neural networks under dynamic event-triggered mechanism. Neural Networks. 2020;121:356–65.
Mao J, Sun Y, Yi X, Liu H, Ding D. Recursive filtering of networked nonlinear systems: A survey. Int J Syst Sci. 2021;52(6):1110–28.
Peng C, Tian Y-C, Yue D. Output feedback control of discrete-time systems in networked environments. IEEE Trans Syst Man Cybern Syst Hum. 2010;41(1):185–90.
Qian W, Li Y, Chen Y, Liu W. L2-L∞ filtering for stochastic delayed systems with randomly occurring nonlinearities and sensor saturation. Int J Syst Sci. 2020;51(13):2360–77.
Qian W, Li Y, Zhao Y, Chen Y. New optimal method for L2-L∞ state estimation of delayed neural networks. Neurocomputing. 2020;415:258–65.
Cui Y, Liu Y, Zhang W, Alsaadi FE. Sampled-based consensus for nonlinear multiagent systems with deception attacks: The decoupled method. IEEE Trans Syst Man Cybern Syst Hum. 2021;51(1):561–73.
Hu J, Zhang H, Liu H, Yu X. A survey on sliding mode control for networked control systems. Int J Syst Sci. 2021;52(6):1129–47.
Liu Y, Wang Z, Ma L, Alsaadi FE. A partial-nodes-based information fusion approach to state estimation for discrete-time delayed stochastic complex networks. Inf Fusion. 2019;49:240–8.
Liu Y, Shen B, Li Q. State estimation for neural networks with Markov-based nonuniform sampling: The partly unknown transition probability case. Neurocomputing. 2019;357:261–70.
Luo X, Liu Z, Jin L, Zhou Y, Zhou M. Symmetric non-negative matrix factorization-based community detection models and their convergence analysis. IEEE Trans Neural Netw Learn Syst. 2021. in press. https://doi.org/10.1109/TNNLS.2020.3041360.
Luo X, Yuan Y, Zhou M, Liu Z, Shang M. Non-negative latent factor model based on \(\beta\)-divergence for recommender systems. IEEE Trans Syst Man Cybern Syst Hum. 2019. in press. https://doi.org/10.1109/TSMC.2019.2931468.
Luo X, Zhou M, Li S, Hu L, Shang M. Non-negativity constrained missing data estimation for high-dimensional and sparse matrices from industrial applications. IEEE Trans Cybern. 2019;50(5):1844–55.
Zhu K, Hu J, Liu Y, Alotaibi ND, Alsaadi FE. On \(\ell _{2}\)-\(\ell _{\infty }\) output-feedback control scheduled by stochastic communication protocol for Two-dimensional switched systems. Int J Syst Sci. in press. https://doi.org/10.1080/00207721.2021.1914768.
Zou L, Wang Z, Hu J, Liu Y, Liu X. Communication-protocol-based analysis and synthesis of networked systems: Progress, prospects and challenges. Int J Syst Sci. in press. https://doi.org/10.1080/00207721.2021.1917721.
Zou L, Wang Z, Zhou DH. Moving horizon estimation with non-uniform sampling under component-based dynamic event-triggered transmission. Automatica. 2020;120:109154.
Funding
This research work was funded by Institutional Fund Projects under grant no. (IFPIP-220-135-1442). Therefore, the authors gratefully acknowledge technical and financial support from the Ministry of Education and King Abdulaziz University, Jeddah, Saudi Arabia. This work was also supported in part by the National Natural Science Foundation of China under Grants 61873148, 61933007 and 61903065, the China Postdoctoral Science Foundation under Grant 2018M643441, the Royal Society of the UK, and the Alexander von Humboldt Foundation of Germany.
Author information
Authors and Affiliations
Corresponding author
Ethics declarations
Ethical Approval
This article does not contain any studies with human participants or animals performed by any of the authors.
Conflict of Interest
The authors declare that they have no conflicts of interest.
Rights and permissions
Open Access This article is licensed under a Creative Commons Attribution 4.0 International License, which permits use, sharing, adaptation, distribution and reproduction in any medium or format, as long as you give appropriate credit to the original author(s) and the source, provide a link to the Creative Commons licence, and indicate if changes were made. The images or other third party material in this article are included in the article's Creative Commons licence, unless indicated otherwise in a credit line to the material. If material is not included in the article's Creative Commons licence and your intended use is not permitted by statutory regulation or exceeds the permitted use, you will need to obtain permission directly from the copyright holder. To view a copy of this licence, visit http://creativecommons.org/licenses/by/4.0/.
About this article
Cite this article
Tian, L., Wang, Z., Liu, W. et al. A New GAN-Based Approach to Data Augmentation and Image Segmentation for Crack Detection in Thermal Imaging Tests. Cogn Comput 13, 1263–1273 (2021). https://doi.org/10.1007/s12559-021-09922-w
Received:
Accepted:
Published:
Issue Date:
DOI: https://doi.org/10.1007/s12559-021-09922-w


