
Abstract
Like many other Middle East countries, Iran has been suffering from severe water shortages over the last two decades, as evidenced by significant decline in surface water and groundwater levels. The observed changes in water storage can be attributed to the mutually reinforcing effects of human activities, climatic variability, and of course the climate change. The objective of this study is to analyze the dependency of atmospheric CO2 increase on the water shortage of Iran, for which we investigate the spatial relationship between water storage change and CO2 concentration using large scale satellite data. We conduct our analysis using water storage change data from GRACE satellite and atmospheric CO2 concentration from GOSAT and SCIAMACHY satellites during 2002â2015. To analyze the long-term behavior of time series we benefit from Mann-Kendal test and for the investigation of the relationship between atmospheric CO2 concentration and total water storage we use Canonical Correlation Analysis (CCA) and Regression model. Our Results show that the water storage change anomaly and CO2 concentration are negatively correlated especially in northern, western, southwest (Khuzestan province), and also southeast (Kerman, Hormozgan, Sistan, and Baluchestan provinces) of Iran. CCA results reveal that in the most of northern regions, the decrease in water storage is significantly influenced by the increase of CO2 concentration. The results further show that precipitation in the highland and peaks does not seem to be influenced by the long and short-term variation in CO2 concentration. Besides, our results show that the CO2 concentration is slightly correlated with a weak positive trend in evapotranspiration over agricultural areas. Thus, the indirect effect of CO2 on increasing evapotranspiration is observed spatially in the whole of Iran. The results of the regression model between total water storage change and carbon dioxide (R2â=â0.91)/water discharge/water consumption show that carbon dioxide has the highest effect on total water storage change at large scale. The results of this study will contribute to both water resource management and mitigation plans to achieve the goal of CO2 emission reduction.
Introduction
The Earthâs average temperature (15 degrees Celsius) increases since the Industrial Revolution. NASA has reported an average increase of global surface temperatures by 0.9 °C from 1880 to 2015 (NASAâS Goddard Institute). Carbon dioxide (CO2) is identified as the most important greenhouse gas in the atmosphere1 and its concentration in the troposphere has been increased from about 277 ppm in 1750 to 408.12 ppm in 20192,3). The reduction of carbon dioxide (CO2) emissions by 20%, is one of the so-called 20/20/20 targets, within the Paris Agreement with the long-term goal of keeping the increase in global average temperature well below 2 °C above pre-industrial levels. Water and carbon cycles are recognized as life components on Earth and play an important role in climate change and water/food security4. The exchange of CO2 between different ecosystems and the atmosphere has a significant role in the earthâs temperature and changes in climatic characteristics effect on the hydrological cycle5. As atmospheric CO2 concentrations increase, the climate and hydrologic cycle are changing, and their consequences on temperature, cloud cover, evapotranspiration, runoff formation, and precipitation intensity and distribution are observed in natural ecosystems4,5.
The climate of the Middle East is arid and hot. Water scarcity has been identified as the biggest challenge particularly since the onset of drought in 2007. Based on the World Bank statistics in 2007, about 50% of the countries in the Middle East are consuming more water on average than they receive in precipitation, and 85% of total surface and groundwater was consumed in the agricultural sector. The desertification phenomenon is occurring over the Middle East, especially in Syria, Iran, Jordan, and Iraq. Water resources of Iran are under high stress due to population growth, land-use change such as urbanization, agricultural expansion, and their related consequences in recent decades6. The indirect effect of the increasing population (~â83 million in 2019) on water resources was an increase in demand for cropland and development of irrigation lands while its direct effect resulted in an increased necessity for fresh water in the urban and rural areas7. Sarraf et al.8 stated that the total water storage over Iran have been decreased more than 65% since 1960, and a reduction of 16% will expect to 2025. Over-exploitation of water resources (surface and groundwater) and the high rate of irrigation in some provinces are the main causes of challenge for the future preservation of groundwater basins in most parts of Iran9, Mohammadi Ghaleni & Ebrahimi10). It is worth mentioning that, approximately 50% of the water volume of irrigation is supported from surface sources such as lakes and rivers and the other 50% is provided from groundwater7. Over the past three decades, an over-exploitation of groundwater resources has caused a drop in water level in the majority of basins in Iran9. Also, some activities such as industrial and agricultural activities have caused a severe decrease in groundwater quality in most parts of Iran11. In the interim, evaporation phenomena could rise the salinity of cropland soil and surface waters, typically in rivers and natural lakes.
The studying bilateral relationship between atmospheric CO2 amplitude and water cycle is an interesting topic in environmental sciences and climate change. In this research, for the first time, we try to use remote sensing technology advances for investigating the relationship between atmospheric CO2 and inland water storage on a regional scale. Among them, space-borne geodetic sensors, planed for various purposes, have established themselves as a useful instrument for oceanographic, cryospheric, and also hydrological applications. For example, radar satellite altimetry, originally designed for applications in oceanography and geodesy, has indicated its potential as virtual lake and river gauges12, Papa et al.13; Refs.14,15,16. The launch of Gravity Recovery and Climate Experiment (GRACE) in 200217 allowed for the recovery of the time variable gravity field at catchment scales using low-low satellite to satellite tracking (llSST). GRACE data has provided a direct estimation of the monthly gravity field variations through calculation of the relative motion of the center-of-mass of the twin satellites with a highly accurate inter-satellite K-band microwave link. GRACE is a special mission among all other space-borne sensors as it allows us to investigate continental water storage on short time scales18. Many types of research were devoted to use GRACE data for analysis of equivalent water height (EWH) change19,17, Forotan et al.20, Ref.21,22,23. The presence of such a satellite mission motivated this study to understand the relationship between the total water storage changes, as seen by GRACE, and the CO2 concentration as also measured from space.
Greenhouse gas monitoring using remote sensing technologies began in 2002 by SCIAMACHY onboard ENVISAT and continues by GOSAT, OCO-2, and Tansat24, Schneising et al.25, Ref.26,27. For example, Shim et al.28 used GOSAT satellite data in their study area to investigate the greenhouse gas emissions in East Asia between April 2009 and 2011. They have shown that the highest concentration of carbon dioxide in April is that plants have not yet started to grow. The lowest amount is in July and August when photosynthetic intensity reaches its highest level. Jing et al.29 prepared a mapping of global carbon dioxide distribution in September 2012 using the conventional Kriging interpolation method and combined use of GOSAT and SCIAMACHY satellite data. Sun et al.30 used carbon dioxide spatial data from the GOSAT satellites (July 2009 to April 2014) and ENVISAT as well as monthly mean atmospheric carbon dioxide emissions from Loa Manua and MEI. The objectives of their study were to determine the relationship between atmospheric CO2 concentration and ENSO and also to investigate variations in the spatial distribution of CO2 concentration in South America during different phases of ENSO. They showed that the average monthly carbon dioxide growth rate is positively correlated with MEI. Mousavi et al.31 used near-infrared thermal sensors for Fourier Carbon Spectroscopy Observations (TANSO-FTS) from GOSAT level-2 data and meteorological parameters to estimate CO2 variations from 2009 to 2015. They expressed that CO2 variations are highly dependent on the month, with the highest CO2 concentrations in April and May and the lowest concentrations in August and September. The correlation between XCO2 and the monthly mean air temperature was also shown to be negative, indicating that the decrease in XCO2 with temperature increases depends on the photosynthetic process by vegetation in the hot season. Falahatkar et al.32 studied the relationship between XCO2, normalized difference vegetation index, and some meteorological variables such as air temperature, humidity, and rainfall on a national scale. Their findings showed that the highest and lowest values of carbon dioxide concentration were distributed in the southeast, north and northwestern parts of Iran, respectively. In a similar study, Siabi et al.33 assessed the spatial distribution of atmospheric CO2 from April to September in the whole of Iran. They used OCO-2 data and different environmental variables for finding the relationship between atmospheric CO2 and environmental parameters.
Velicogna et al.34 used GRACE data to investigate the relationship between total water storage variation and vegetation growth. Their results showed that the availability of total water storage plays a key role in adjusting the response of vegetation to temperature fluctuations. Similar to the idea of our study, Humphrey et al.35 used EWH changes extracted from GRACE to study inland water effects on carbon cycle dynamics at large scales. They showed that CO2 change rate is significantly dependent on obtained changes in inland water storage, where drier years have been observed with a faster increasing trend of CO2. Further, they demonstrated that the universal relationship is independent of known air temperature effects and is underestimated in current carbon cycle models. Gentine et al.5 explored the key role of inland water availability in the carbon cycle and highlighted the effective role of satellites in studying the coupling between the atmospheric carbon dioxide and water cycles.
Although the change in total water storage has been studied using both remote sensing data and in situ data with climatic characteristics and economic parameters, to the best of our knowledge, there is no study that examines the bilateral relationship between CO2 and change in water storage in Iran. We recall that terrestrial carbon sinks reduce with increasing drought events and water shortage, as has been the case in Iran since 2008. Therefore, we aim to investigate the link between total water storage and CO2 change in the time. To this end, for the first time, we perform a careful analysis of dependency between equivalent water height anomaly by GRACE data and atmospheric CO2 concentration during last 15Â years. Our results are important and beneficial for future studies on hydrology, ecology, and climate change in Iran and will be essential for both water resources management and CO2 mitigation plans. Such an analysis includes the following steps, which also characterize the objectives of this study:
-
(1)
The time series analysis of total water storage and CO2 concentration change during 15Â years,
-
(2)
Quantification the relationship between total water storage and atmospheric CO2 in national scale,
-
(3)
Finding the relationship between total water change and atmospheric CO2/ water discharge/water consumption over Iran.
Study area
Iran is located between 25° to 40°N latitude and 44° to 63°E longitude and has an area of 1,648,000 km2 (Fig. 1). Iran is known as an arid and semi-arid country. The elevation range is â 30 m to more than 5500 m, which has a significant influence on variety of climates. However, Iran has a large diversity of climatic regions with precipitation range (average of 120 mm yrâ1 in the central and eastern provinces and averages of 2000 mm/yr in the northern regions of Iran) and temperature variation (range of â 20 °C in the northwest to 50 °C over southern Iran). There are two famous mountains in Iran. Alborz and Zagrous mountains are located in northern and western Iran. More than 50% of the area between Alborz and Zagrous is covered by salty swamps of Dasht-e-Kavir and Kavir-e-Lut. The entire Iran is constituted by six main catchments. The Caspian Sea, Urmia Lake, the Persian Gulf and the Gulf of Oman, the central plateau, the Kara-Kum, and the Lake Hamoon are located in northern, northwestern, southern, central, northeastern, and eastern Iran.

The location of Iran in the Middle East and its neighboring countries. It is generated using the Generic Mapping Tools (GMT).
Data
GRACE equivalent water height anomaly
The Gravity Recovery and Climate Experiment) GRACE) is a satellite mission to produce the global gravity field map in a spatial resolution of about 400 km every 30 days36,37. GRACE includes two identical satellites in 500 km altitude and 89.5° inclination, separated from each other by about 220 km along-track. GRACE presents a direct estimation of the monthly gravity field variations by observing the relative motion of the center-of-mass of the two satellites, which is measured with the highly accurate inter-satellite K-band microwave link. This mensuration is obtained by gravity variability over time on the land, which represents change in water mass after accounting for aliased signals and under certain considerations of temporal and spatial resolution38. In this study, we used data from level-2 of the GRACE satellites (Mascon) in the period from 2003 to 2015. The JPL RL06M Mascon solution provides for monthly gravity field variations in terms of equal-area 3 by 3 degree spherical cap Mascons. The data are available in the form of Equivalent Water Height (EWH) anomaly in mm for 0.5 degree cells and they were downloaded from https://grace.jpl.nasa.gov/data/get-data/jpl_global_mascons (Table 1).
XCO2 Obs4MIPs product
We use the mean of XCO2 (Mole fraction of tropospheric CO2) data sets that retrieved from SCIAMACHY and TANSO-FTS sensors that onboard ENVISAT and GOSAT satellites, respectively39,40. XCO2 has no dimension (unit: mol/mol) explained as number of CO2 molecule divided by number of dry air molecule in an air vertical column. The Obs4MIPs product has been produced using Level-2 XCO2 products as input. Note that a resolution of 5°âÃâ5° has been selected to ensure better noise control. In this study, GOSAT and SCIAMACHY were combined with Obs4MIPs algorithm and 2003 to 2015. Data were downloaded from Institute of Environmental Physics, University of Bremen (Table 1).
Precipitation and evaporation
We use the monthly data sets of the ERA5 dataset for both precipitation and evapotranspiration (https://www.ecmwf.int/en/forecasts/datasets/reanalysis-datasets/era5). ERA5 dataset include hourly different climate parameters in atmosphere, hydrosphere and land, which is available from 1950 to present (Copernicus Climate Change Service (C3S)41) (Table 1).
Apart from above mentioned datasets, for the plausibility assessment of our results, we relied on data like statistics of piezometric wells, water discharge (springs, aqueducts, deep wells, semi-deep wells) and water consumption in three sectors (agriculture, industry and domestic) which were obtained from the site of Iran Water Resources Studies.
Methodology
Our analysis of relationship between CO2 and water storage relies on, first of all, performing a time series analysis to understand the statistical behavior of these time series and their long-term trend. Moreover, to capture the related patterns of two datasets, we used a Canonical Correlation Analysis (CCA).
Time series analysis
For the time series analysis, apart from the graphical inspection on time series and correlation analysis, we perform the Mann-Kendal trend test. Kendall and Ord (1990) described trend as a long-term movement. The monotonic trend (MannâKendall) provides a non-linear trend indicator that estimates the degree to which a trend is continuously increasing or decreasing. MannâKendall values have a range from negative one to positive one. A value ofâ+â1 expresses a trend that consistently increases and does not have any decreases in study period. A value of â 1 shows consistently decrease during the study period. The zero value represents no consistent trend. The Theil-Sen slope is estimated based on median trend. All pairwise combinations of values are assessed for each pixel during study time and a tally is made of the number that are increasing or are decreasing with time. The MannâKendall significance produces two maps; a significance map represented as Z scores and a second image that indicates the probability (P value) that the obtained trend could have occurred by chance. Moreover, P value represent the significance of a MannâKendall trend over time42.
Canonical correlation analysis
Canonical correlation analysis (CCA) is a method for extracting joint modes between two time series variables43. This method extracts the bilateral information of two time series datasets through performing unique value decomposition on the covariance matrix between two data sets. This Method can detect the basis vectors for two different time series datasets without considering the units, as it relies on correlation between datasets that is invariant to the magnitude. Unlike PCA, CCA considers maximum value of covariance between variables not maximum value of variance44, Zhang et al.45). The bilateral correlated information are obtained in different canonical modes of both fields. CCA distinguishes relationships between two field series to identify related patterns between the series.
CCA as employed here can be referred to as a double-barreled PCA42. Two variables X (t1âÃân1) and Y (t2âÃân2) as atmospheric CO2 concentration and EWH anomaly, respectively, at n1 and n2 grid points in spatial characteristics, taken at time 1 and time 2. It should be pointed out that one of the dimensions of two variables (X and Y) must have the same size. Therefore, time was considered as same dimension of X and Y variables. We estimate the covariance matrix XTY (n1âÃân2) between X and Y variables to which unique value decomposition is now applied
In Eq. (1), UC, VC are canonical modes, and ΣC (n1âÃân2) represents the singular values of the covariance between both time series. UC, VC with n1, n2 dimension indicate spatial information. With the canonical modes for each time series dataset, the corresponding associated components are then calculated by prediction the data set on them (Eqs. (2) and (3)):
where VX (tâÃâr) and VY (tâÃâr) are the associated temporal characteristics of the time series X and Y with dimension time (t), respectively. Also, CXY is the calculated time independently, thus UC, VC indicate the spatial pattern, and VX, VY consequently refer to temporal correlated information. A subgroup of the canonical modes of both time series is considered based on the highest variance.
Regression modeling
One of the main goals of statistical studies is to find the relationship between two or more variables. Regression methods refer to a method of statistical modeling that analyzes such relationships (Adab46). In this research, we used stepwise regression modeling for finding the relationship between total water/groundwater change and atmospheric CO2/water discharge/water consumption. For more details about stepwise regression modeling read Farajzadeh47.
Results and discussions
Time series analysis
Figure 2 shows the time series of EWH anomaly together with the time series of CO2 concentration over the entire Iran. The upward trend is accompanied by seasonal fluctuations in atmospheric carbon dioxide concentrations is represented from 2003 to 2015. The highest and lowest carbon dioxide concentrations are observed in spring and summer, respectively. This result is consistent with Keeling curve3. During this period time, sinusoidal and decreasing oscillations is exhibited the changes in the time series of EWH anomaly as well. The time series show a correlation coefficient of â 0.74 (R2â=â0.55), representing that the increasing carbon dioxide concentration in atmosphere of Iran accompanied with a decrease in EWH anomaly. The negative correlation is predominantly due to the negative sign in the trend of these time series. However, in terms of seasonality both time series show a positive correlation. The de-trended time series show a correlation coefficient ofâ+â0.7 (R2â=â0.5), indicating a strong coupling between CO2 and EWH anomaly (Fig. 3).

Time series of EWH anomaly and CO2 concentration from 2003 to 2015 over Iran (top) and full record of CO2 concentration (Scripps Institution of Oceanography at UC San Diego) (bottom).
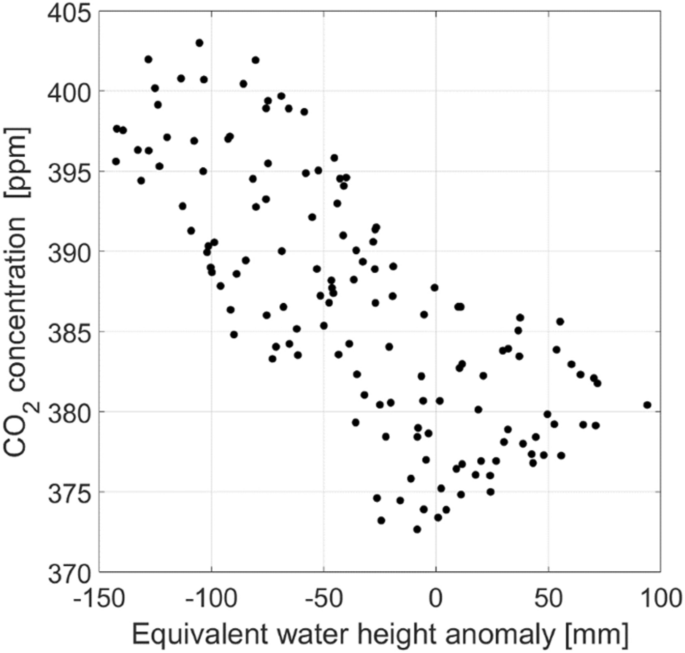
Scatter plot of CO2 concentration (Axis Y) versus EWH anomaly (Axis X) for 2003 to 2015.
The time series of EWH anomaly shows a negative trend of 13.6Â mm/y between 2003 and 2015. On the other hand, the time series of CO2 concentration shows a positive trend of 2.1Â ppm/yr for the same time period.
The results of Mann Kendall test in Fig. 4a, clearly indicate an increasing trend of carbon dioxide in all parts of Iran. The highest value of monotonic MannâKendall was observed in northern, western, southwest (Khuzestan province) and then southeastern Iran (Kerman, Hormozgan, Sistan, and Baluchestan provinces). The lowest monotonic MannâKendall value was observed in the northwest of the country. According to the p-value (Fig. 4b) one can state that a significant increasing trend was observed over Iran from 2003 to 2015. The range of Theil-Sen slope was estimated very low for the variation of CO2 concentration in Iran (about 0.02). In the northwest and west of Iran, as well as in the south and southeast of the country, the change rate of carbon dioxide concentration is higher than in other areas (Fig. 4c). As also stated by Mousavi et al.31, the variation of carbon dioxide concentration is highly related to the season (Fig. 2). In fact, the highest concentration of CO2 in April and May and the lowest concentration in August and September48 observed the highest value of XCO2 in cold season and lowest value in the hot season based on OCO-2 data in Brezil. Mousavi et al.49 attributed the high carbon dioxide concentration in the eastern and southeastern parts of Iran to the high temperature and lack of dense vegetation in this area. Moreover, anthropogenic activities like deforestation, land clearing, agricultural activities, and biomass burning accelerate the process of greenhouse gas emissions50. Some researchers have found that land degradation caused by unbearable agricultural practices is the main reason for increasing greenhouse gas emissions.

Time series trend analysis of carbon dioxide concentration using MannâKendall test (a), P value (b) and Theil-Sen slope (c).
A similar analysis is performed on EWH anomaly over Iran. In general, only part of western and southwestern Iran has been shown a less decreasing trend than other parts of Iran. The lowest decreasing trend was observed in Kohkiluyeh and Boyer-Ahmad province and then in Khuzestan and in part of Bushehr province. It is valuable to note that the highest decreasing trend was observed in Semnan province, South Khorasan province and then in Khorasan Razavi, Yazd, and Kerman provinces (Fig. 5a). The p-value for this parameter indicated that there is a significant decreasing trend (pââ¤â0.05) in all parts of Iran, except for a small part in Sistan and Baluchestan province and a small part in Kohkiloyeh and Boyer Ahmad, Bushehr, and Khuzestan provinces (Fig. 5b). According to the rate of monthly changes of EWH anomaly results, the high change rate is observed in the region including Khuzestan province and east of Sistan and Baluchestan province (Fig. 5c). Abou Zaki et al.51 showed the level of groundwater was decreased about 7.6 mm annual from 2002 to 2011 that equal to the total water volume 2.6 km3 in Bakhtegan basin. Moshir Panahi et al.52 sowed Iran warmed and precipitation decreased in most region and total water storage depleted from 1986 to 2016. The reason for such drastic water loss could be drought, population growth and economic growth which led to increased demand for limited water resources20,53, Shamsi and Ghorbani54, Moshir Panahi et al.52, and Abou Zaki et al.51.

Time Series Trend of EWH anomaly Using the Man-Kendall test (a), P value (b), Theil-Sen slope (c).
Canonical correlation analysis
The canonical correlation analysis (CCA) was applied to find out the relationship between two multidimensional variables. We have performed the analysis for the following pairs:
-
CO2 concentration and EWH anomaly.
-
CO2 concentration and precipitation.
-
CO2 concentration and evapotranspiration.
In order to investigate the patterns between CO2 and hydrological variables, in the following, we analyze its canonical correlation with precipitation as the input and also evapotranspiration as it links Earthâs water, energy and carbon cycle.
CCA between CO2 and EWH anomaly
The canonical correlations were determined between two variables series of CO2 and EWH anomaly (X independent) and (Y dependent), respectively. Figures 6 and 7 shows the singular values of the cross-covariance between CO2 concentration and EWH anomaly highlighting that 99% percent of the correlation lies within the first three modes. Mode 1 with 93% of the canonical correlation between water storage anomaly and CO2 concentration captures a combination of trend and seasonal variations, visible in the projection of the obtained canonical mode VX, VY (Fig. 7). The obtained UX, UY represent the spatial pattern of the captured correlation. It is interesting to observe that the water storage changes in the northern part of Iran, except Khorasan and West Azerbaijan Provinces, receive a stronger influence from the increase in CO2 concentration. A reason for such a strong pattern in this region might be due to the effect of industrial regions and high population density in Tehran and Alborz province with a high rate of human activities and CO2 footprint. On the other, Hyrcanian forest in northern Iran as the main sink of CO2 can have a significant role in forming such a relationship. At the same time, one can observe that the CO2 concentration and EWH anomaly are less coupled in southern part of Iran along the coast of the Persian Gulf and the Sea of Oman. One reason might be the gas flaring along the coast of the Persian Gulf, especially in Bushehr province that has a strong contribution to greenhouse gas emission55. Humphery et al.35 showed that TWS based on GRACE data had good correlation with CO2 growth rate in semi-arid regions. Mode 2 with 5% of the correlation shows an annual variation without any significant long-term behavior with a stronger dependency in North-West Iran in Azerbaijan province. It is important to mention that on average, CO2 values are larger at mid to high northern latitudes, which could be related to various carbon sources and sinks and global winds patterns. In fact, winds in this region are not fast and strong enough to mix all the industrial/anthropogenic CO2 emissions from the northern latitude to the south latitude56. Moreover, the high dependency between CO2 and EWH anomaly in the west of Iran might be due to the significant agricultural activities in this area, which leads to the groundwater depletion with a consequence of an increase in the rate of CO2 emission57. Humphrey et al.35 found that the relationship between temperature and CO2 growth rate was not significant in global scale. They also observed that CO2 growth rate varied by temperature and total water storage but the role of TWS is more significant than temperature. Zhou et al.58 investigated the role of important factors on the potential evapotranspiration variation over China. Their results showed radiation, temperature and CO2 concentration were significant factors on potential evapotranspiration, respectively (Fig. 8).
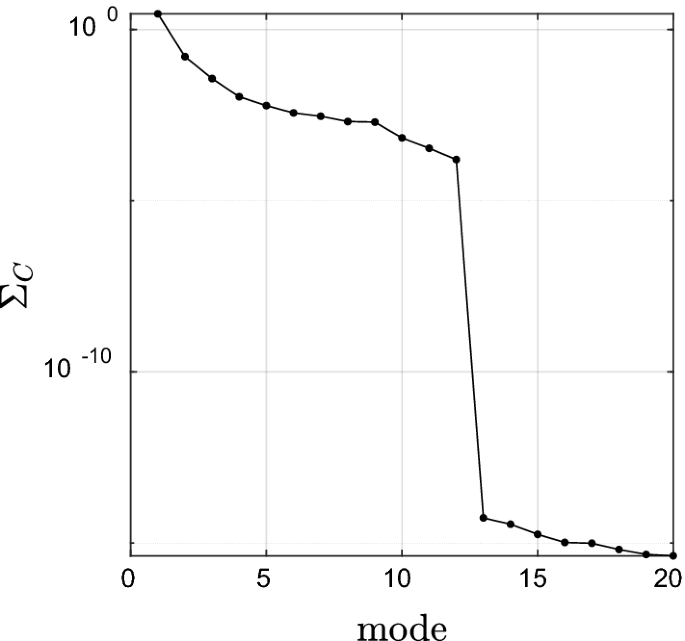
Canonical correlations between CO2 concentration and EWH anomaly from GRACE.

Results of CCA analysis between CO2 and EWH anomaly for the first three modes carrying 99% of the correlation. For each mode, time series and maps of canonical modes are shown for both CO2 concentration (left) and EWH anomaly from GRACE (right).
CCA between CO2 and precipitation
The canonical correlation between precipitation and CO2 datasets does not reveal a strong canonical mode like the one between CO2 and EWH anomaly. In this case, mode 1 carries 54% of the correlation between CO2 and precipitation with a clear seasonal behavior (Fig. 8 and 9). While both temporal variations of the first mode, show a clear coupled seasonal variation, the temporal behavior of precipitation data does not show any long-term behavior. The spatial patterns of the first mode allow us to identify an interesting finding, where the precipitation in the western part of Zagros Mountains and Guilan province seems to be positively correlated with CO2. Moreover, Hyrcanian forest and Zagrous forest in northern and western Iran has a significant role in carbon absorption as the natural sink in warm seasons. Decreasing CO2 in the growing season by the photosynthesis process in western and northern Iran is simultaneous with lower precipitation in this area. Meanwhile, severe amplitude CO2 and precipitation were observed from 2003 to 2006. The mode 2 with a 28% of correlation also represents a seasonal behavior with a totally different spatial pattern. It reflects a negative strong correlation between seasonal variations of precipitation over high mountains coupled with the CO2 concentration. The northern and western regions of Iran have highlands such as Alborz and Zagrous Mountains, respectively, which cause low temperatures and the formation of wind currents in these regions. Air currents have an important role in order to transfer high amounts of CO2 to the east and southeast of Iran33. Mousavi et al.59 found the negative correlation between XCO2 and precipitation over Iran from 2003 to 2020 in different months. They observed the same correlation between atmospheric CO2 and vegetation density. Costa et al.48 applied the empirical model for daily XCO2 estimation in Brazil. Their results showed that radiation, sun induced chlorophyll fluorescence and relative humidity had the most important rule in modeling. Therefore, it is expected to observe a negative dependency between CO2 concentration and precipitation in this area. Moreover, high precipitation over highland in Iran seems to be negatively correlated with the CO2 concentration along the coasts of the Persian Gulf and Sea of Oman. The mode 3 with only 5% canonical correlation reveals a semi-annular dependency with a negative correlation between CO2 concentration and precipitation, where stronger amplitudes are seen along the coast of Caspian Sea. In general, the results seem to show that precipitation in the highlands and on the peaks is not more correlated to the long- and short-term variations in CO2 concentration. However, we do not observe a rapid decrease or increase in precipitation due to CO2 concentration, as expressed in some previous studies (Andrews et al.60; Ref.61. Though atmospheric CO2 variation on global climate has a significant effect on surface water and groundwater (water cycling), evapotranspiration and patterns of precipitation and runoff in natural ecosystems, we did not observe a strong correlation between carbon change and precipitation.
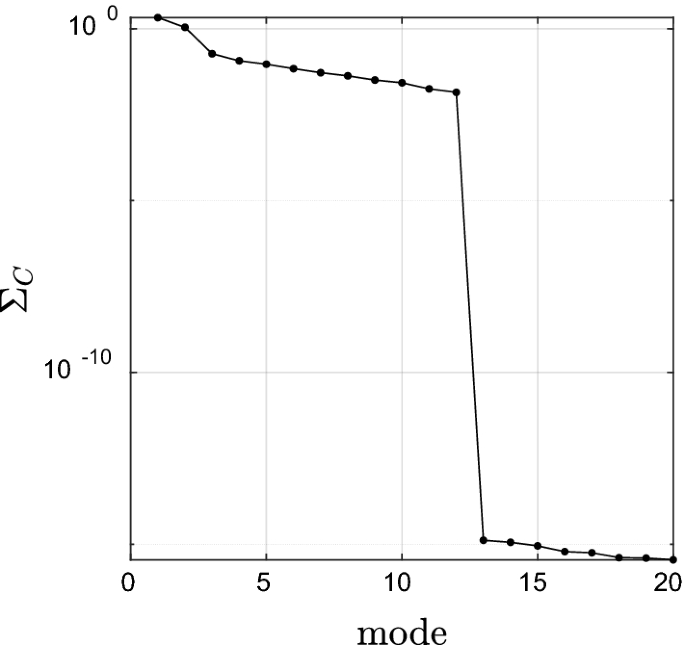
Canonical correlation between the time series of CO2 and precipitation

Results of CCA analysis between CO2 and Precipitation for the first three modes carrying 87% of the correlation. For each mode, time series and maps of canonical modes are shown for both CO2 concentration (left) and precipitation (right).
CCA between CO2 and evapotranspiration
The results of canonical correlation between time series of CO2 and evapotranspiration, (X independent and Y dependent) respectively are shown in Figs. 10 and 11. The first three modes carry 91% of the correlation between these two datasets. The first mode extracts an interesting pattern of evapotranspiration over the mountainous regions of Iran along with the Zagros and Alborz mountains in the west and north of Iran. Increasing evapotranspiration with latitude was observed in the snow-free mountains in the hot season. Some meteorological parameters such as cloudiness, surface air pressure, wind speed, solar radiation, and temperature have important effects on evapotranspiration and may lead to an increase in evapotranspiration with latitude62. On the other hand, CO2 gas has a high density and is heavier than the air. Therefore, when it is released into the atmosphere it will lead to low elevation. This issue is observed in the first mode and represents a similar pattern to the first mode of precipitation. Mode 2 shows two distinct spatial patterns for CO2, where the CO2 concentration shows a negative trend above the latitude 30° and a positive trend below the latitude 30°. It is related to the variation of tropospheric CO2 concentration with geographic latitude. The mode 2 with such a pattern is canonically correlated with evapotranspiration in the high mountains of Zagrous and Lake Urmia. Different microalga species play significant role in carbon sequestration in saline lakes. The presence of these microalgae in Iranâs salt lakes such as Lake Urmia, Qum lake, and Maharlue lake and also shallow-marine limestone in Zagrous Mountain have an effective impact on the carbon cycle63. Although CCA does not show any significant long-term behavior in evapotranspiration data correlated with the positive trend in CO2, only a slightly positive trend is visible in the third mode (the spatial map shows negative numbers turning the negative trend in the time series in positive trend). A possible reason for such a slight positive trend is the change in temperature due to climate change and change in net radiation (Oguntunde et al.64). This result is in line with a previous study by Tabari and Marofi65, who showed a weak inverse relationship between potential evaporation and precipitation. This weak positive trend, however, shows a special spatial pattern mainly distributed over the agricultural areas including Lake Urmia basin and Guilan, Mazandaran, and Golestan provinces (see the map of mode 3). Also, some researches showed that the increasing atmospheric CO2 concentration has direct and indirect effects vegetation cover and hydrology. The serious evapotranspiration reduction under increasing CO2 concentration was observed due to its role in reducing crop water requirements66. Liao et al.67 used the general circulation models under different RCP scenarios in order to project the evapotranspiration. They showed that evapotranspiration will decrease under doubled CO2 concentration in China cropland. Pan et al. showed that high temperature and high precipitation caused to increase in the evapotranspiration until 2100. They also indicated that atmospheric CO2 concentration is accounting for decreasing evapotranspiration in future specially in central and western Asia.
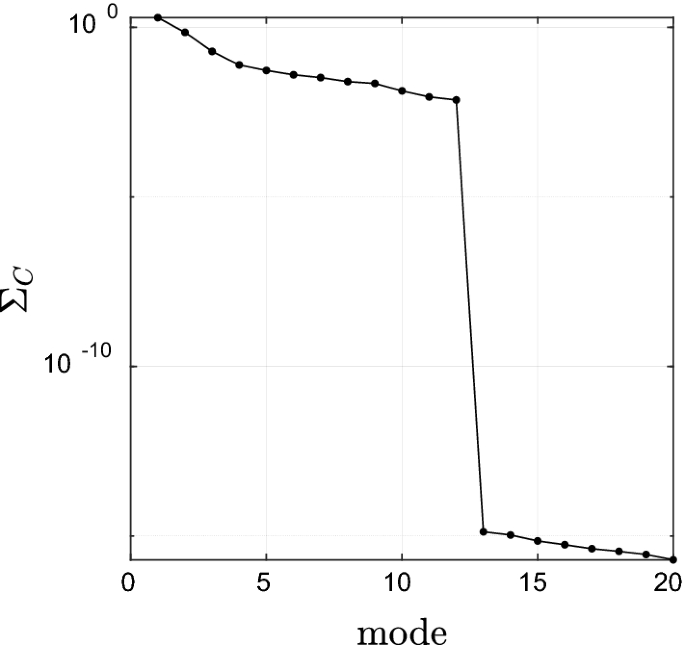
Canonical correlation between the time series of CO2 and evapotranspiration.

Results of CCA analysis between CO2 and evapotranspiration for the first three modes carrying 91% of the correlation. For each mode, time series and maps of canonical modes are shown for both CO2 concentration (left) and evapotranspiration (right).
Regression modeling between total water storage and CO2/water discharge/water consumption
In stepwise regression, the first variable is entered into the model is based on the maximum effect, and if other variables can significantly affect the dependent variable, they will enter into the model in the next steps. The dependent variable (Y) in this study is the total water storage and the independent variables (X) are carbon dioxide, the statistical information related to deep, semi-deep well discharges, springs, aqueducts, and the water consumption in agricultural, domestic, and industrial sectors. The adjusted coefficient of determination (Adjusted R2) shows that CO2 has a higher degree of confidence than the coefficient of determination (R2), which is estimated to be 0.9 in the present study.
According to Table 2, the carbon dioxide variable has the greatest effect on the output of the regression model. The results showed that the increase or decrease in atmospheric CO2 as an effective factor in the water resources can be calibrated in terms of precipitation, evaporation, and transpiration. In the other words, carbon dioxide as an important greenhouse gas in global warming with a direct or an indirect effect on precipitation, temperature, evaporation, and transpiration can be considered as an influential climatic variable for research of Iranâs water resources Many studies focused on the effect of climate change on hydrology parameters in present and future such as Saifullah et al.24, Zhuang et al.68, Umair et al.69, and Ougahi70.
Y is equivalent water height, X is CO2 concentration.
Conclusions
We observed an increasing trend associated with sinusoidal fluctuations in atmospheric carbon dioxide concentration from 2003 to 2015. The highest CO2 concentration occurred in spring and the lowest value was observed in summer. These results were consistent with Keeling curve data. In terms of spatial distribution, the highest carbon dioxide concentration was observed in southern and southeastern Iran and then in the southwest and center of Iran. Time series analysis showed that the lowest monotonic trend occurs in the pixels that cover the north and northwest of the country. A similar analysis of EWH anomaly showed a decreasing trend over the whole of Iran. During this time period, sinusoidal and decreasing oscillations represented changes in EWH anomaly.
Further, we investigated the dependencies between atmospheric CO2 (X independent variable) and EWH anomaly, precipitation, and evapotranspiration (Y dependent variable) by CCA. The results show that the water storage changes in the northern part of Iran, except Khorasan and West Azerbaijan Provinces, receive a stronger influence from the increase in CO2 concentration. Such result can be attributed to metropolitan and industrial cities such as Tehran and Alborz provinces with the high rate of carbon emission in day and night time. Our analysis show that the canonical correlation between precipitation and CO2 datasets does not highlight a strong canonical mode like the one between CO2 and EWH anomaly. According to the first three modes, the correlation between CO2 and precipitation was considered in highland areas. Unlike Zagrous Mountain and Guilan province, a negative correlation was observed between CO2 and precipitation along the southern coasts in Iran. Our results show that evapotranspiration over the mountainous regions of Iran along with the Zagrous and Alborz mountains in the west and north of Iran is highly correlated with the CO2 concentration in the north-western part of Iran. Plants regulated the gaseous exchange with ambient air by their leaveâs stomata. CO2 uptake and water vapor released by vegetation in the photosynthetic process are dependent on air temperature. Whereas air temperature changes gradually with altitude and geographical latitude, we observe the spatial pattern in CO2 and evapotranspiration dependency over Iran. It is clear that the variety of soil types, soil moisture, vegetation type, and vegetation density in the different parts of Iran had significant roles in the formation of these results. Our CCA results provide a new perspective on the application of remotely sensed TWS for regional carbon cycle analysis.
Whereas, carbon dioxide as an important greenhouse gas in global warming has a direct or indirect impact on precipitation, temperature, evapotranspiration, and transpiration, affecting changes in EWH anomaly by reducing depletion of water resources, can be used for reducing the carbon dioxide (CO2) emissions. Our results demonstrate that total water storage is linked to changes in atmospheric CO2 concentration, evapotranspiration and precipitation on the regional scale. The importance of CO2 concentration is more effective than can be distinguished from evapotranspiration and precipitation on TWS. Moreover, conserving natural ecosystems such as Hyrcanian forest and Zagrous forest as carbon sink together with sustainable management of cropland especially in western and northern Iran will have an effective and long-term impact of CO2 variation. On the other hand, there seem to be a bilateral relationship between CO2 and total water storage. So change in the atmospheric CO2 can be effected on water storage and the depletion of groundwater may cause CO2 emission. The environmental challenges of groundwater depletion in Iran is harsh as well as the associated CO2 emissions, and hence, there is a necessity for a rule of groundwater extraction. Whereof the groundwater extraction is been converted to serious challenge in Iran, the mitigation policy in groundwater withdrew is crucial to Iranâs environmental policies and carbon management.
However, because the CO2 data are very coarsely resolved and the focus of this study was on determining the link of climatic parameters and EWH with CO2 data, we do not believe that alternating between different data sets would change the results drastically. However, it is important to note that these correlations do not necessarily mean a direct influence. Also, it should be noted that these relationships are tangible at the macro level, while management practices are more influential in changing water resources, especially groundwater at the local scale. Meanwhile the atmospheric CO2 concentration is strongly influenced by industrial production as well as human activities (land use change, fossil fuel combustion â¦) and the same is true for terrestrial water storage (water transfer project, land use change, dam construction â¦). This research highlighted a novel perspective in which variations in the interplay between atmospheric CO2 and TWS based on the potential effect of climate-driven oscillation in hydrology by remotely sensed data for large-scale carbon cycle research. In future work, it is recommended to evaluate the anthropogenic factors for better interpretation and the relationship among atmospheric CO2 concentration and EWH anomaly, precipitation and evaporation for different seasons over Iran.
Data availability
The datasets analysed during the current study are not publicly available due their containing information that could compromise the privacy of research participants (water consumption and groundwater extraction data) but are available from the corresponding author on reasonable request.
References
Davidson, O., Bosch, P., Dave, R. & Meyer, L. Mitigation of Climate Change (Cambridge University Press, 2007).
Dlugokencky, E. & Tans, P. Trends in atmospheric carbon dioxide, National Oceanic and Atmospheric Administration, Earth System Research Laboratory (NOAA/ESRL) (2014).
Evans, M. Carbon and water cycling. Advancing geography and geographical learning, 1â19 (2014).
Gentine, P. et al. Coupling between the terrestrial carbon and water cyclesâA review. Environ. Res. Lett. 14, 083â0103. https://doi.org/10.1088/1748-9326/ab22d6 (2019).
FAO. FAO water report, 34 (2009).
Ardakanian, R. Overview of water management in Iran. In Water Conservation, Reuse, and Recycling: Proceedings of an Iranian-American Workshop, J. Natl. Acad. Press, 18â33 (2005).
Sarraf, M., Owaygen, M., Ruta, G. & Croitoru, L. Islamic Republic of Iran: Cost Assessment of Environmental Degradation (World Bank, 2005).
Motagh, M. et al. Land subsidence in Iran caused by widespread water reservoir overexploitation. J. Geophys. Res. Lett. https://doi.org/10.1029/2008GL033814 (2008).
Mohammadi-Ghaleni, M. & Ebrahimi, K. Assessing impact of irrigation and drainage network on surface and groundwater resourcesâCase study: Saveh Plain, Iran. In ICID 21st International Congress on Irrigation and Drainage, 15â23 (2011).
Tizro, A. T. & Voudouris, K. S. Groundwater quality in the semi-arid region of the Chahardouly basin West Iran. J. Hydrol. Process. 22, 3066â3078. https://doi.org/10.1002/hyp.6893 (2008).
Crétaux, J. F. & Birkett, C. Lake studies from satellite radar altimetry. J. Compt. Rendus Geosci. 338, 1098â1112. https://doi.org/10.1016/j.crte.2006.08.002 (2006).
Papa, F., Durand, F., Rossow, W. B., Rahman, A. & Bala, S. K. Satellite altimeter-derived monthly discharge of the Ganga-Brahmaputra river and its seasonal to interannual variations from 1993 to 2008. J. Geophys. Res. Oceans https://doi.org/10.1029/2009JC006075 (2010).
Berry, P. A. M., Garlick, J. D., Freeman, J. A. & Mathers, E. L. Global inland water monitoring from multi-mission altimetry. J. Geophys. Res. Lett. https://doi.org/10.1029/2005GL022814 (2005).
Lorenz, C., Tourian, M. J., Devaraju, B., Sneeuw, N. & Kunstmann, H. Basin-scale runoff prediction: An E nsemble K alman F ilter framework based on global hydrometeorological data sets. J. Water Resour. Res. 51, 8450â8475. https://doi.org/10.1002/2014WR016794 (2015).
Tourian, M. J. et al. Spatiotemporal densification of river water level time series by multimission satellite altimetry. J. Water Resour. Res. 52, 1140â1159. https://doi.org/10.1002/2015WR017654 (2016).
Tapley, B. D., Bettadpur, S., Ries, J. C., Thompson, P. F. & Watkins, M. M. GRACE measurements of mass variability in the earth system. J. Sci. 305, 503â505. https://doi.org/10.1126/science.1099192 (2004).
Lettenmaier, D. P. & Famiglietti, J. S. Water from on high. Nature 444, 562â563. https://doi.org/10.1038/444562a (2006).
Klees, R. et al. A comparison of global and regional GRACE models for land hydrology. J. Surv. Geophys. 29, 335â359. https://doi.org/10.1007/s10712-008-9049-8 (2008).
Forootan, E. et al. Separation of large scale water storage patterns over Iran using GRACE, altimetry and hydrological data. J. Remote Sens. Environ. 140, 580â595. https://doi.org/10.1016/j.rse.2013.09.025 (2014).
Hassan, A. & Jin, S. Water storage changes and balances in Africa observed by GRACE and hydrologic models. J. Geodesy Geodyn. 7, 39â49. https://doi.org/10.1016/j.geog.2016.03.002 (2016).
Khaki, M. et al. Determining water storage depletion within Iran by assimilating GRACE data into the W3RA hydrological model. J. Adv. Water Resour. 114, 1â18. https://doi.org/10.1016/j.advwatres.2018.02.008 (2018).
Tourian, M. J. et al. Spaceborne multisensor approach to monitor the desiccation of Lake Urmia in Iran. J. Rem. Sens. Environ. 156, 349â360. https://doi.org/10.1016/j.rse.2014.10.006 (2015).
Saifullah, M., Li, Z., Li, Q., Zaman, M. & Hashim, S. Quantitative estimation of the impact of precipitation and land surface change on hydrological processes through statistical modeling. Adv. Meteorol. 2016, 15. https://doi.org/10.1155/2016/6130179 (2016).
Schneising, O. Three years of greenhouse gas column-averaged dry air mole fractions retrieved from satelliteâPart 2: Methane. J. Atmos. Chem. Phys. 9, 443â465. https://doi.org/10.5194/acp-9-443-2009 (2009).
Crisp, D. et al. The orbiting carbon observatory (OCO) mission. J. Adv. Space Res. 34, 700â709. https://doi.org/10.1016/j.asr.2003.08.062 (2004).
Ran, Y. & Li, X. TanSat: A new star in global carbon monitoring from China. J. Sci. Bull. 64, 284â285. https://doi.org/10.1016/j.scib.2019.01.019 (2019).
Shim, C., Lee, J. & Wang, Y. Effect of continental sources and sinks on the seasonal and latitudinal gradient of atmospheric carbon dioxide over East Asia. J. Atmos. Environ. 79, 853â860. https://doi.org/10.1016/j.atmosenv.2013.07.055 (2013).
Jing, Y., Shi, J. & Wang, T. Mapping global land XCO2 from measurements of GOSAT and SCIAMACHY by using kriging interpolation method. In 2014 IEEE Geoscience and Remote Sensing Symposium (eds Jing, Y. et al.) 3017â3020 (IEEE, 2014). https://doi.org/10.1109/IGARSS.2014.6947112.
Sun, Z., Wang, X., Tani, H., Zhong, G. & Yin, S. Spatial distribution of CO2 concentration over South America during ENSO episodes by using GOSAT data. Am. J. Clim. Change 5, 77â87. https://doi.org/10.4236/ajcc.2016.51009 (2016).
Mousavi, S. M., Falahatkar, S. & Farajzadeh, M. Assessment of seasonal variations of carbon dioxide concentration in Iran using GOSAT data. J. Nat. Resour. Forum 41, 83â91. https://doi.org/10.1111/1477-8947.12121 (2017).
Falahatkar, S., Mousavi, S. M. & Farajzadeh, M. Spatial and temporal distribution of carbon dioxide gas using GOSAT data over Iran. J. Environ. Monit. Assess 189, 627. https://doi.org/10.1007/s10661-017-6285-8 (2017).
Siabi, Z., Falahatkar, S. & Alavi, S. J. Spatial distribution of XCO2 using OCO-2 data in growing seasons. J. Environ. Manag. 244, 110â118. https://doi.org/10.1016/j.jenvman.2019.05.049 (2019).
Velicogna, I. Kimball, J. S Kim, Y. Impact of changes in GRACE derived terrestrial water storage on vegetation growth in Eurasia. Environ. Res. Lett. 10, 124024. (2015).
Humphrey, V. et al. Sensitivity of atmospheric CO2 growth rate to observed changes in terrestrial water storage. J. Nat. 560, 628â631. https://doi.org/10.1038/s41586-018-0424-4 (2018).
Tapley, B.D. & Reigber, C. The GRACE mission: Status and future plans. AGUFM, G41C-02 (2001).
Watkins, M. & Bettadpur, S. The Grace Mission: The challenges of using micron-level satellite-to-satellite ranging to measure the earthâs gravity field (2000).
Tourian, M. J., Reager, J. T. & Sneeuw, N. The total drainable water storage of the Amazon River Basin: A first estimate using GRACE. J. Water Resour. Res. 54, 3290â3312. https://doi.org/10.1029/2017WR021674 (2018).
Bovensmann, H. et al. Sciamachy mission objectives and measurement modes. J. Atmos. Sci. 56, 127â150. https://doi.org/10.1175/1520-0469(1999)056%3c0127:SMOAMM%3e2.0.CO;2 (1999).
Kuze, A., Suto, H., Nakajima, M. & Hamazaki, T. Thermal and near infrared sensor for carbon observation Fourier-transform spectrometer on the Greenhouse Gases Observing Satellite for greenhouse gases monitoring. J. Appl. Optic. 48, 6716â6733. https://doi.org/10.1364/AO.48.006716 (2009).
Copernicus Climate Change Service (C3S). ERA5: Fifth generation of ECMWF atmospheric reanalyses of the global climate. Copernicus Climate Change Service Climate Data Store (CDS). https://cds.climate.copernicus.eu/cdsapp#!/home (2017). Accessed 28 Jun 2019.
Eastman, J. R. IDRISI terrset manual (Clark Labs-Clark University, 2016).
Glahn, H. R. Canonical correlation and its relationship to discriminant analysis and multiple regression. J. Atmos. Sci. 25, 23â31 (1968)
Jolliffe, I. T. Principal components in regression analysis. In Principal Component Analysis (ed. Jolliffe, I. T.) 129â155 (Springer, 1986).
Zhang, J. Assessing the statistical relations of terrestrial water mass change with hydrological variables and climate variability. Univ. Stuttg. https://doi.org/10.18419/opus-10474 (2019).
In Presian: Adab, H. Modeling of autumn rapeseed crop estimation using multivariate regression method in GIS environment Sabzevar case study M.Sc. Thesis in Library and Information Science, Faculty of Humanities, Tarbiat Modares University (2009).
In Presian: Farajzadeh, M. Climatic Techniques. Samat Publications, 283 (2007).
Costa, L. M. D., Santos, G. A. D. A., Panosso, A. R., Rolim, G. D. S. R. & Scala, N. L. An empirical model for estimating daily atmospheric column-averaged CO2 concentration above São Paulo state, Brazil. Carbon Balance Manag. https://doi.org/10.1186/s13021-022-00209-7 (2022).
In Presian: Mousavi, S.M., Falahatkar, S. & Farajzadeh, M. Investigation of monthly changes of CO2 in Iran with using satellite GOSAT data. First International Conference on Environmental Pollutants Sampling and Monitoring (2016).
Guo, M., Wang, X., Li, J., Wang, H. & Tani, H. Spatial distribution of greenhouse gas concentrations in arid and semi-arid regions: A case study in East Asia. J. Arid Environ. 91, 119â128. https://doi.org/10.1016/j.jaridenv.2013.01.001 (2013).
Abou Zaki, N., Torabi Haghighi, A., Rossi, P. M., Tourian, M. J. & Kløve, B. Monitoring groundwater storage depletion using gravity recovery and climate experiment (GRACE) data in bakhtegan catchment Iran. Water 11, 1456. https://doi.org/10.3390/w11071456 (2019).
Moshir Panahi, D., Kalantari, Z., Ghajarnia, N., Seifollahi-Aghmiuni, S. & Destouni, G. Variability and change in the hydroclimate and water resources of Iran over a recent 30-year period. Sci. Rep. 10, 7450. https://doi.org/10.1038/s41598-020-64089-y (2020).
Joodaki, G., Wahr, J. & Swenson, S. Estimating the human contribution to groundwater depletion in the Middle East, from GRACE data, land surface models, and well observations. J. Water Resour. Res. 50, 2679â2692. https://doi.org/10.1002/2013WR014633 (2014).
Shamsi, S. & Ghorbani, Z. Investigating water storage changes in Iran using GRACE and CHIRPS data in the google earth engine system. Int. Arch. Photogramm. Remote Sens. Spat. Inf. Sci. https://doi.org/10.5194/isprs-archives-XLII-4-W18-981-2019 (2019).
Mirzaei, A., Saghafian, B., Mirchi, A. & Madani, K. The groundwater-energy-food nexus in Iranâs agricultural sector: Implications for water security. J. Water 11, 1835. https://doi.org/10.3390/w11091835 (2019).
Cao, L. et al. The global spatiotemporal distribution of the mid-tropospheric CO2 concentration and analysis of the controlling factors. J. Remote Sens. 11, 94 (2019).
Wood, W. W. & Hyndman, D. W. Groundwater depletion: A significant unreported source of atmospheric carbon dioxide. J. Earth Future 5, 1133â1135. https://doi.org/10.1002/2017EF000586 (2017).
Zhou, J. et al. Why the effect of CO2 on potential evapotranspiration estimation should be considered in future climate. Water 14, 986. https://doi.org/10.3390/w14060986 (2022).
Mousavi, S. M., MobarghaeeDinan, N., Ansarifard, S. & Sonnentag, O. Analyzing spatio-temporal patterns in atmospheric carbon dioxide concentration across Iran from 2003 to 2020. Atmos. Environ. 14, 100163. https://doi.org/10.1016/j.aeaoa.2022.100163 (2022).
Andrews, T. & Forster, P. M. The transient response of global-mean precipitation to increasing carbon dioxide levels. J. Environ. Res. Lett. 5, 025212. https://doi.org/10.1088/1748-9326/5/2/025212 (2010).
Chadwick, R., Good, P., Andrews, T. & Martin, G. Surface warming patterns drive tropical rainfall pattern responses to CO2 forcing on all timescales. J. Geophys. Res. Lett. 41, 610â615. https://doi.org/10.1002/2013GL058504 (2014).
Henning, I. & Henning, D. Potential evapotranspiration in mountain geoecosystems of different altitudes and latitudes. J. Mt. Res. Dev. 1, 267â274 (1981).
Ghorbani, A., Rahimpour, H. R., Ghasemi, Y., Zoughi, S. & Rahimpour, M. R. A review of carbon capture and sequestration in Iran: Microalgal biofixation potential in Iran. Renew. Sustain. Energy Rev. 35, 73â100. https://doi.org/10.1016/j.rser.2014.03.013 (2014).
Oguntunde, P. G., Friesen, J., van de Giesen, N. & Savenije, H. H. Hydroclimatology of the Volta River Basin in West Africa: Trends and variability from 1901 to 2002. J. Phys. Chem. Earth Parts A/B/C 31, 1180â1188. https://doi.org/10.1016/j.pce.2006.02.062 (2006).
Tabari, H. & Marofi, S. Changes of pan evaporation in the west of Iran. J. Water Resour. Manag. 25, 97â111. https://doi.org/10.1007/s11269-010-9689-6 (2011).
Chen, Y. et al. Increased evapotranspiration from land cover changes intensified water crisis in an arid river basin in northwest China. J. Hydrol. 574, 383â397. https://doi.org/10.1016/j.jhydrol.2019.04.045 (2019).
Liao, D., Niu, J., Kang, S., Singh, S. K. & Du, T. Effects of elevated CO2 on the evapotranspiration over the agricultural land in Northwest China. J. Hydrol. 593, 125858. https://doi.org/10.1016/j.jhydrol.2020.125858 (2021).
Zhuang, X. W., Li, Y. P., Nie, S. & Huang, G. H. Modeling climate change impacts on water resources. 10th Int. Conf. Environ. Sci. Technol. 356, 7â9 (2019).
Umair, M., Kim, D. & Choi, M. Impact of climate, rising atmospheric carbon dioxide, and other environmental factors on water-use efficiency at multiple land cover types. Sci. Rep. 10, 11644. https://doi.org/10.1038/s41598-020-68472-7 (2020).
Ougahi, J. H., Cutler, E. J. & Cook, M. J. Assessment of climate change effects on vegetation and river hydrology in a semi-arid river basin. PLoS ONE 17(8), e0271991. https://doi.org/10.1371/journal.pone.0271991 (2022).
Acknowledgements
This research was supported by the Iran National Science Foundation (grant number 98020586). All authors acknowledge all of organizations which produced the remote sensing products used in this research, including NASA for GRACE/GRACE-FO Mascon data, ECMWF for ERA5 data, and University of Bremen for XCO2 Obs4MIPs product.
Author information
Authors and Affiliations
Contributions
Order authors name is: first author: S.S. second author: S.F. third author: M.J. T. Author statement: S.F.: Conceptualization and supervisor of this research in Mann-Kendal Analysis. S.S.: Doing this research for her Master of Science, writing original draft. M.J.T.: Advisor of this research in CCA analysis and using GRACE data.
Corresponding author
Ethics declarations
Competing interests
The authors declare no competing interests.
Additional information
Publisher's note
Springer Nature remains neutral with regard to jurisdictional claims in published maps and institutional affiliations.
Rights and permissions
Open Access This article is licensed under a Creative Commons Attribution 4.0 International License, which permits use, sharing, adaptation, distribution and reproduction in any medium or format, as long as you give appropriate credit to the original author(s) and the source, provide a link to the Creative Commons licence, and indicate if changes were made. The images or other third party material in this article are included in the article's Creative Commons licence, unless indicated otherwise in a credit line to the material. If material is not included in the article's Creative Commons licence and your intended use is not permitted by statutory regulation or exceeds the permitted use, you will need to obtain permission directly from the copyright holder. To view a copy of this licence, visit http://creativecommons.org/licenses/by/4.0/.
About this article

Cite this article
Safaeian, S., Falahatkar, S. & Tourian, M.J. Satellite observation of atmospheric CO2 and water storage change over Iran. Sci Rep 13, 3036 (2023). https://doi.org/10.1038/s41598-023-28961-x
Received:
Accepted:
Published:
DOI: https://doi.org/10.1038/s41598-023-28961-x
Comments
By submitting a comment you agree to abide by our Terms and Community Guidelines. If you find something abusive or that does not comply with our terms or guidelines please flag it as inappropriate.
