


ABSTRACT
We present our observations of SN 2010mb, a Type Ic supernova (SN) lacking spectroscopic signatures of H and He. SN 2010mb has a slowly declining light curve (LC) (∼600 days) that cannot be powered by 56Ni/56Co radioactivity, the common energy source for Type Ic SNe. We detect signatures of interaction with hydrogen-free circumstellar material including a blue quasi-continuum and, uniquely, narrow oxygen emission lines that require high densities (∼109 cm−3). From the observed spectra and LC, we estimate that the amount of material involved in the interaction was ∼3 M☉. Our observations are in agreement with models of pulsational pair-instability SNe described in the literature.
Export citation and abstract BibTeX RIS
1. INTRODUCTION
A massive star with an initial mass above ∼8 M☉ ends its life in an explosion that destroys the star, leaving a neutron star (NS) or a black hole (BH) as a remnant (Heger et al. 2003). This explosion is triggered by iron photo-disintegration and loss of internal energy causing the star to undergo a gravitational core-collapse (CC) supernova (SN; e.g., Woosley & Janka 2005).
At an earlier stage in its evolution, an extremely massive star (initial mass above ∼100 M☉) will go through a phase of electron–positron generation in its core (Barkat et al. 1967; Rakavy & Shaviv 1968; Heger et al. 2003; Waldman 2008; Chatzopoulos & Wheeler 2012; Yusof et al. 2013). The pair production will render the star unstable, with two possible outcomes: (1) the star will end its life in an explosion that ejects the entire mass of the star and leaves no remnant at all, a pair-instability supernova (PISN; progenitor mass above ∼140 M☉). (2) The star will eject matter in a series of eruptions, a pulsation pair-instability (PPI) event (progenitor mass between ∼100–140 M☉), thus reducing the core mass until it reaches hydrostatic equilibrium and returns to the normal evolution track of massive stars, ending its life due to CC (Heger & Woosley 2002; Heger et al. 2003; Woosley et al. 2007; Waldman 2008; Chatzopoulos & Wheeler 2012). Several examples of possible PISN events have been observed in recent years (SN 2007bi and PTF10nmn; Gal-Yam et al. 2009, Gal-Yam 2012, O. Yaron et al. 2014, in preparation; though see Nicholl et al. 2013). Only indirect evidence has so far been presented for a PPI event (e.g., SN 2006gy and SN 2006jc; Woosley et al. 2007; Pastorello et al. 2008a; Chugai 2009).
For both CC SNe and PISNe, the energy source at late times is the radioactive decay of 56Co Fe, with a half-life of 77 days. Other energy sources that can contribute to the optical display of an SN are hydrogen recombination in the expanding ejecta (Type II-P SN; Popov 1993), and an internal engine such as a nascent magnetar (Kasen & Bildsten 2010; Woosley 2010; Mazzali et al. 2009) or accretion by a stellar BH (Patnaude et al. 2011). In some cases, interaction of SN ejecta with circumstellar material (CSM), most commonly observed through narrow hydrogen lines in Type IIn SNe (e.g., Schlegel 1990; Kiewe et al. 2012), will inject additional energy into the optical display.
Here, we describe SN 2010mb (PTF10iue), an SN lacking signatures of either hydrogen or helium (Type Ic), with long-lasting emission powered by interaction of the SN ejecta with a large mass of hydrogen-free CSM. Section 2 describes our observations; and Section 3 presents our results and analysis. In Section 4, we discuss possible scenarios, with an emphasis on the PPI option. Conclusions are given in Section 5.
2. OBSERVATIONS
2.1. Discovery
On 2010 April 10 UT (MJD 55296.76) the Palomar Transient Factory (PTF; Law et al. 2009, Rau et al. 2009) detected SN 2010mb at R.A.  and decl. =37°44'57'' (detection magnitude 21.47 ± 0.2 in r band) using the CFH12K survey camera mounted on the 48'' Oschin Schmidt telescope at the Palomar observatory (P48). Analysis of previous images showed the SN was visible on 2010 March 18 UT (MJD 55273.96), at a magnitude of 22.2 ± 0.54 in the r band. The object is located on the edge of the galaxy SDSS J160023.23+374454.8 at a redshift z = 0.1325. Figure 1 shows detection, reference, and subtracted images of the SN.
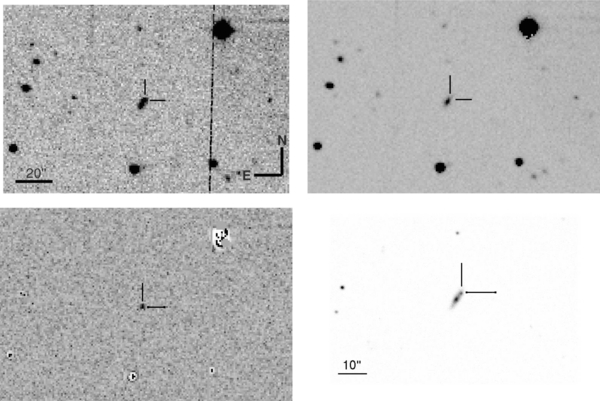
Figure 1. Top left: an image of SN 2010mb taken with the P48 on 2010 June 10 UT (MJD 55357.69). Top right: reference image for SN 2010mb. Bottom left: the SN 2010mb image after reference subtraction. Residuals from host galaxy contamination are negligible, as is apparent in the image. Bottom right: a zoomed image of SN 2010mb obtained on 2011 March 4 UT (MJD 55624.11) with LRIS mounted on the Keck-I 10 m telescope. The offset of the SN from the host center (1 3 W and 22 N) is clearly seen.
Download figure:
Standard image High-resolution imagePrior to 2010 March 18 UT, the galaxy was imaged 10 times by the PTF survey between 2009 May 18 and August 21 UT (MJD 54969-55064), with no evidence for the SN or any activity in its vicinity.
We classified SN 2010mb as a Type Ic SN based on a spectrum lacking signatures of either hydrogen or helium taken on 2010 June 8 UT (MJD 55355. Figures 2 and 3; Ben-Ami et al. 2012).

Figure 2. SN 2010mb spectra. No signs of hydrogen lines (emission or absorption) or helium lines are seen, indicating a Type Ic SN. Late-time spectra (2011 March 4 and July 5 UT) are dominated by a blue quasi-continuum component. Spectra are available in digital form from the Weizmann Interactive Supernova Data Repository (WISeREP; Yaron & Gal-Yam 2012; http://www.weizmann.ac.il/astrophysics/wiserep/).
Download figure:
Standard image High-resolution image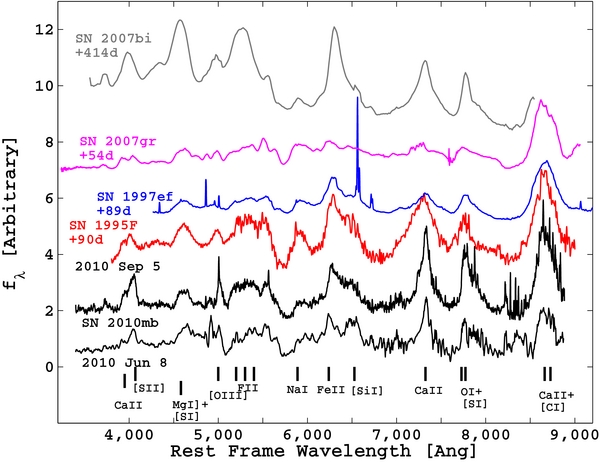
Figure 3. SN 2010mb spectral classification. Early spectra of SN 2010mb resemble a Type Ic SN at the transition between the photospheric and nebular phases as late as ∼170 days after discovery (i.e., some photospheric features were still observed in the spectrum taken on 2010 September 5 UT, second spectrum from the bottom). Automatic classification of the spectra taken on 2010 June 8 and July 8 UT using Superfit (Howell et al. 2005) suggests that the best match is to the late-time spectra of SN 1997ef 89 days after peak magnitude (an energetic Type Ic SN showing late transition from photospheric phase to nebular phase; Mazzali et al. 2004), and SN 1995F 90 days after discovery (a Type Ic SN; Matheson et al. 2001), while automatic classification using SNID (Blondin & Tonry 2011) suggests that the best match is to SN 2007gr at 54 days after peak magnitude (a "normal" Type Ic; Hunter et al. 2009). This highlights the slow evolution of SN 2010mb, similar to SN 1997ef, and much slower than a "normal" Type Ic SN like SN 2007gr. The spectra also resemble nebular spectra of SN 2007bi (Gal-Yam et al. 2009).
Download figure:
Standard image High-resolution image2.2. Photometry
SN 2010mb, discovered near the P48 detection limit, was intermittently detected during the first 50 days after its discovery, 17 until it became continuously visible on 2010 May 31 UT (MJD 55347.71) at an apparent magnitude of 20.85 ± 0.12 in the r band.
Photometry of SN 2010mb was obtained by the P48 (Law et al. 2009; Rau et al. 2009), the gamma-ray burst camera (Cenko et al. 2006) mounted on the Palomar 60'' telescope (P60), the Large Format Camera mounted on the Palomar 200'' Hale telescope (P200), and the Low Resolution Imaging Spectrograph (LRIS) mounted on the 10 m Keck-I telescope (Oke et al. 1995). Data were reduced using the MKDIFFLC photometry routine (Gal-Yam et al. 2004, 2008), except for P48 data reduced using point-spread function (PSF) photometry on image subtractions. 18 The PTF data processing is discussed in Laher (2014 19 ), while the photometric calibration is discussed in Ofek et al. (2012a; 2012b). We adopt a distance modulus of 39.07 mag, based on measured redshift from the SN spectrum (assuming H0 = 67.3 km s−1Mpc−1 and Ωm = 0.315; Planck Collaboration et al. 2013), corresponding to a luminosity distance of ≈650.46 Mpc, a Galactic extinction correction of E(B − V) = 0.013 mag (Ar = 0.033 mag; Schlafly & Finkbeiner 2011; see NED, 20 as well as Section 3.6.) Photometric results are given in Table 1 and plotted in Figure 4. No correction for the host extinction is applied. The lack of strong interstellar medium (ISM) absorption and the blue spectral energy distribution (SED) measured at late times (see Section 3) argue against a substantial host extinction.

Figure 4. Photometry of SN 2010mb. The r band LC rises by 1.3 mag during the first ∼25 days, and then settles onto a plateau lasting ∼180 days at an absolute magnitude of −18.25 mag (deviations from the plateau, marked by a dashed red line, are not statistically significant). Following the plateau, the LC drops by 0.9 mag in less than 23 days, followed by a period of slow decline at a rate of 0.004 mag day−1, which is less than half the decline rate of the 56Ni/56Co powered SNe, during the next 350 days. Photometry in the g band and B band showed a slow increase in flux during the first 250 days of this event. The dashed vertical lines indicate a spectrum was taken on that day. The LCs of SLSN-R SN 2007bi in the R band (candidate pair instability event; Gal-Yam et al. 2009), and of an average Type Ic SN template in the R band (Drout et al. 2011), are shown for comparison. On 2011 December 21 UT (MJD 55916), the SN was no longer visible in deep images taken with the LFC. Deeper images taken with LRIS on 2012 January 26 UT (MJD 55952.09) set a limiting absolute magnitude of −14.1 at that time (triangles).
Download figure:
Standard image High-resolution imageTable 1. SN 2010mb Photometry
| Date (MJD) | Instrument | Exposure Time | Apparent Magnitude | Magnitude Error | Filter |
|---|---|---|---|---|---|
| (s) | (mag) | (mag) | |||
| 55273.96 | P48 a | 2 × 200 | 22.20 | 0.54 | r |
| 55296.76 | P48 | 2 × 200 | 21.47 | 0.20 | r |
| 55384.84 | P60 b | 360 | 21.00 | 0.10 | r |
| 55477.64 | LFC c | 900 | 20.78 | 0.15 | r |
| 55624.11 | LRIS d | 120 | 22.60 | 0.14 | r |
Notes. Digital data are available from the Weizmann Interactive Supernova Data Repository (WISeREP; Yaron & Gal-Yam 2012; http://www.weizmann.ac.il/astrophysics/wiserep/). aPalomar 48'' Oschin Schmidt telescope. bPalomar 60'' Oscar Mayer telescope. cLarge Format Camera mounted on the Hale 200'' telescope. dLow Resolution Imaging Spectrograph mounted on the Keck-I 10 m telescope.
Only a portion of this table is shown here to demonstrate its form and content. A machine-readable version of the full table is available.
Download table as: DataTypeset image
The light curve (LC) displayed a long plateau in r band lasting ∼180 days, followed by a slow decline at a rate of 0.004 mag day−1, while the g band and B band LCs are slowly rising during the first ∼250 days (Figure 4). The total amount of energy emitted in the r band over a period of ∼600 days is ∼1.2 × 1050 erg (an average flux of 1.8 × 10⁻¹³ erg s−1 cm−2). Assuming a bolometric correction of 10% at early times and 50% at later times based on our spectral decomposition (see Section 3.2), we estimate a total energy emission of 3.7 ± 0.4 × 1050 erg over a period of ∼600 days.
2.3. Spectroscopy
Six spectra of SN 2010mb were obtained (Table 2 and Figure 2). Data were reduced using standard IRAF and IDL routines (e.g., Matheson et al. 2000b, Gal-Yam et al. 2007) and were smoothed with a three-pixel boxcar. The observed spectra are deredshifted by z = 0.1325, where the redshift was determined using a χ2 minimization with an absorption-line template (Howell et al. 2005; Galactic lines identification in later spectra, e.g., 2012 February 20 spectrum, confirms our redshift determination). Spectra are calibrated to the gri P48/P60 photometry (2010 June 8, July 8, and November 1 UT), to an extrapolation of the gri P48/P60 photometry (2010 September 5 UT), and to LFC r band photometry (2011 March 4 and July 5 UT). A spectrum of the host galaxy nucleus was taken on 2012 February 20 UT using LRIS (see Section 3.6).
Table 2. Spectroscopy Log
| Date (MJD) | Telescope | Instrument | Exposure Time | Grism/Grating | Slit |
|---|---|---|---|---|---|
| (sec) | (lpm) | ||||
| 2010 Jun 8 (55355) a | Keck-I | LRIS | 600 | 400/400 b | 1'' |
| 2010 Jul 8 (55385) | Keck-I | LRIS | 750 | 400/400 | 1'' |
| 2010 Sep 5 (55444) | Keck-I | LRIS | 750 | 400/400 | 1'' |
| 2010 Nov 1 (55501) | Keck-I | LRIS | 750 | 400/400 | 1'' |
| 2011 Mar 4 (55624) | Keck-I | LRIS | 900 | 400/400 | 1'' |
| 2011 Jul 5 (55747) | Keck-II | DEIMOS c | 1200 | 600 | 07 |
| 2012 Feb 20 (55977) d | Keck-I | LRIS | 1200 | 400/400 | 1'' |
| Date (MJD) | Resolution | Airmass | Paralactic Angle | Position Angle | Spec. Standard |
| (Å) | |||||
| 2010 Jun 8 (55355) | 1.09/1.16 | 1.38 | −75° | 27° | BD+28 4211 |
| 2010 Jul 8 (55385) | 1.09/1.16 | 1.01 | 134° | 270° | BD+26 2606 |
| 2010 Sep 5 (55444) | 1.09/1.16 | 1.24 | −90° | 19° | BD+28 4211 |
| 2010 Nov 1 (55501) | 1.09/1.16 | 1.55 | −90° | −8° | BD+28 4211 |
| 2011 Mar 4 (55624) | 1.09/1.16 | 1.29 | 14° | 270° | BD+28 4211 |
| 2011 Jul 5 (55747) | 0.65 | 1.07 | 42° | 256° | BD+28 4211 |
| 2012 Feb 20 (55977) | 1.09/1.16 | 1.18 | 238° | 328° | BD+26 2606 |
Notes. aThe CBET classifying this object (Ben-Ami et al. 2012) erroneously lists the Palomar 200'' Hale telescope as that used for the spectrum taken on 2010 June 8 UT. The details here supersede this publication. bThe Low Resolution Imaging Spectrograph has two arms (blue and red). Each arm is equipped with a different grating and, therefore, a different resolution. cDeep Imaging Multi-Object Spectrograph Faber et al. (2003); filter: GG455. dHost Galaxy spectrum.
Download table as: ASCIITypeset image
3. ANALYSIS
3.1. Classification and Evolution
The first three spectra of SN 2010mb (2010 June 8, July 8, and September 5 UT) resemble a Type Ic SN at the transition between photospheric and nebular phase as late as ∼170 days after discovery (i.e., photospheric features observed in the spectrum taken on 2010 September 5 UT, Figure 2). Automatic classification using Superfit (Howell et al. 2005) of the spectra taken on 2010 June 8 and July 8 UT suggests that the best match is to the late-time spectra of SN 1997ef 89 days after peak magnitude (an energetic Type Ic SN showing late transition from photospheric phase to nebular phase; Mazzali et al. 2004), and SN 1995F 90 days after discovery (a Type Ic SN; Matheson et al. 2001), while automatic classification using SNID (Blondin & Tonry 2011) suggests that the best match is to SN 2007gr at 54 days after peak magnitude (a "normal" Type Ic; Hunter et al. 2009), Figure 3. This highlights the slow evolution of SN 2010mb, similar to SN 1997ef, and much slower than a "normal" Type Ic SN like SN 2007gr. The spectra also resemble nebular spectra of SN 2007bi (PISN; Gal-Yam et al. 2009). Based on the resemblance between SN 2010mb spectrum taken on 2010 June 8 UT, and SN 1997ef spectrum taken 89 days after peak magnitude, and assuming a rise time of 20 days (Mazzali et al. 2004), we assume SN 2010mb exploded around 2010 February 23 UT, though this number is highly uncertain.
Early and intermediate spectra (i.e., 2010 June 8 until November 1 UT) are dominated by blended lines of Ca ii λλ3933, 3968 and [S ii] λ4069, Mg i] λ4571 and [S i] λ4589, [O iii] λλ4959, 5007, Fe ii blended lines (5200–5400 Å), [O i] and Fe ii blended lines (6300–6400 Å), O i λ7773 and [S i] λ7728, and Ca ii λλ8498, 8542, 8662, and [C i] λ8727. The Na i D line, [Si i] λ6527, and [Ca ii] λλ7291, 7324 are clearly observed in the spectra as well (line identification is based on the models described in Section 3.2; Wavelengths are given in rest frame); see Figure 3. Some of the lines, such as the Mg i] λ4571 line, seem to have an internal structure, while others, such as the [Ca ii] λλ7291, 7324 seem to have narrow cores, an indication for a different spatial distribution of these elements and, therefore, for a non-spherical geometry; see Figure 5. Late-time spectra (2011 March 4 and July 5 UT; Figure 2) are dominated by a blue quasi-continuum component, also reflected in g band and B band photometry that is slowly rising during the first ∼250 days, a behavior inconsistent with that of a purely hydrodynamic radioactive explosion that would show a monotonic decrease in temperature with time. We therefore conclude that another energy source other than radioactive 56Ni decay, the common energy source powering Type Ic SNe, is driving the optical display of SN 2010mb at late times.

Figure 5. SN 2010mb line profiles. Comparing the nebular emission lines from Mg i] (top panels) and [Ca ii] (bottom panels), we see a flat-topped profile in the former line, usually interpreted as a signature of non-spherical geometry (Mazzali et al. 2007; Maeda et al. 2008; Mazzali et al. 2005; Modjaz et al. 2008; Taubenberger et al. 2009). The different line shapes of [Ca ii] and Mg i] would, in this case, indicate a non-uniform spatial abundance structure.
Download figure:
Standard image High-resolution image3.2. Modeling
We model the spectra obtained on 2010 June 8, July 8, September 5, and 2011 March 4 UT. We start by modeling the blue quasi-continuum, 21 which seems to be the strongest component in late-time spectra (2011 March 4 and July 5 UT). An attempt to fit blackbody profiles at temperatures between 5000–10, 000 K to the observed blue quasi-continuum gave unsatisfactory results. We conclude that the quasi-continuum is nonthermal in the sense that it is not described well by a blackbody of any temperature, a behavior also known for Type IIn SNe (e.g., Kiewe et al. 2012). We therefore use the spectral continuum derived from observations of SN 2005cl, a hydrogen-rich Type IIn SN, with prominent blue quasi-continuum associated with CSM–ejecta interaction. We use the spectrum taken on 2005 August 13 UT, in which the CSM–ejecta interaction seems to be the strongest. The spectrum is dominated by overlapping Fe ii lines, some of which are partially resolved (Kiewe et al. 2012). After removing the Balmer lines and fitting a smooth curve to the continuum, we scale the resulting curve to fit the continuum seen in each of the SN 2010mb observed spectra. The match between the SN 2010mb blue quasi-continuum at late times when the blue quasi-continuum is more prominent, and the model based on the SN 2005cl spectrum, lends credence to this approach.
After removing the blue quasi-continuum from the four spectra, we compose a photospheric model to match the observed spectra. SN 1997ef and SN 2010mb both show an extended LC and a late transition from photospheric to nebular emission (Figures 2, 3, and 6). We therefore use photospheric models based on SN 1997ef (Iwamoto et al. 2000; Mazzali et al. 2000) for SN 2010mb. After removing the photospheric component and following the methodology of Mazzali et al. (2004), we are left with nebular spectra.

Figure 6. SN 2010mb spectral decomposition. We decompose each spectrum to three components: photospheric and nebular models based on SN 1997ef (Mazzali & Lucy 1993; Lucy 1999; Mazzali et al. 2000, 2004, 2007); and an interaction component based on comparison to the continuum shape (H lines excluded) of the spectrum of SN 2005cl, a hydrogen-rich Type IIn SN, with a prominent blue quasi-continuum originating from the SN ejecta interacting with hydrogen-rich CSM (Kiewe et al. 2012). Some of the lines, such as the [O iii] λ5007 and the O i λ7773 recombination lines, are not handled by our modeling code.
Download figure:
Standard image High-resolution imageTo model the nebular component of SN 2010mb, we construct custom models, using nebular models of SN 1997ef (Mazzali et al. 2000, 2004; Mazzali & Lucy 1993; Lucy 1999; Mazzali et al. 2007) as a starting point with adjustments to each element mass, so that the nebular line strengths agree with the observations. We assume that the emitting nebula is spherical and has a sharp outer boundary, defined by the width of the emission lines. We adopt a boundary velocity of 5000 km s−1, in agreement with the nebular O i lines, the Na i D line, the Ca ii/[C i] blend near 8600 Å, and the Fe II/Na i D emission near 5200 Å, which is a blend of many different lines of different strength. The flat topped lines observed in some of the cases (e.g., Mg i] shown in Figure 5) indicate additional complexity, possibly a nonuniform spatial abundance structure. Based on the evolution of the LC and the spectra, e.g., the large flux fraction at late times from the blue quasi-continuum, we introduce an external energy source to the nebular model that increases with time, which we associate with high energy photons coming from interaction of the SN ejecta with hydrogen-free CSM.
The good match between the models and the observed spectra confirms our assumption regarding the three components that comprise SN 2010mb observed spectra, as well as the use of SN 2005cl spectra and SN 1997ef models as starting points. The decomposition results are shown in Figure 6, while Table 3 gives our results for the chemical composition and emitting mass from the nebular phase at each epoch. The mass of each element is scaled linearly with the line strengths, and from the match quality, we derive a ⩽50% uncertainty in the derived masses for most of the elements.
Table 3. Nebular Model Composition
| Element | 2010 Jun 8 | 2010 Jul 8 | 2010 Sep 5 | 2011 Mar 4 |
|---|---|---|---|---|
| Si | 7 | 6.5 | 10 | 8, |
| Ca | 0.27 | 0.19 | 0.67 | 0.1 |
| O | 3 | 2.4 | 5 | 1.6 |
| C | 0.8 | 0.7 | 3 | 1.2 |
| Na | 0.0001 | 0.00015 | 0.00015 | 0.0013 |
| Mg | 0.0006 | 0.0008 | 0.0013 | 0.02 |
| S | 3 | 2.5 | 5 | 1 |
| Total | 14.0 | 12.4 | 23.7 | 11.0 |
Note. Masses are given in solar mass (M☉).
Download table as: ASCIITypeset image
The derived masses indicate we have observed the explosion of a massive stripped-envelope star (for comparison, the ejecta mass in an average Type Ic SN is 1.7 M☉; Drout et al. 2011). This is further supported by the long transition phase from photospheric to nebular emission; delayed disappearance of photospheric (optically thick) emission indicates a large total mass (Mazzali et al. 2004). The simultaneous detection of photospheric/nebular SN emission and radiation from the ejecta–CSM interaction suggests either that the outer hydrogen-free material is clumpy, or a non-spherical geometry of the CSM (e.g., in a disk or torus). Such a geometry allows us to observe the ejecta directly, in addition to ongoing interaction in the inner circumference of the CSM structure. The mass estimates based on the nebular model should be increased, correcting for the covering fraction of the CSM.
3.3. Light Curve Decomposition
Based on our spectral decomposition, we estimate for each point in the LC the fraction of SN flux (photospheric+nebular), as well as that coming from the ejecta–CSM interaction. We thus produce two synthetic LCs—one representing the SN and the second representing the ejecta–CSM interaction, plotted in Figure 7. The synthetic SN LC decline is in agreement with that expected from 56Ni decay, assuming full trapping of the gamma-rays as was observed for SN 1987A, indicating a large ejecta mass (the estimated ejecta mass for SN 1987A is 15 M☉; e.g., de Freitas Pacheco 1989). The amount of radioactive nickel (0.1 ± 0.01 M☉) suggested by the model is also consistent with the nickel mass–peak magnitude relation for SNe (Perets et al. 2010), predicting ∼0.1–0.15 M☉ of 56Ni, using our photometry. The synthetic LC for the interaction component shows a maximum at around 2010 September 1 UT (MJD 55440) and a much slower decline; and it is dominating the optical display from around 2010 November 20 UT (MJD 55520).
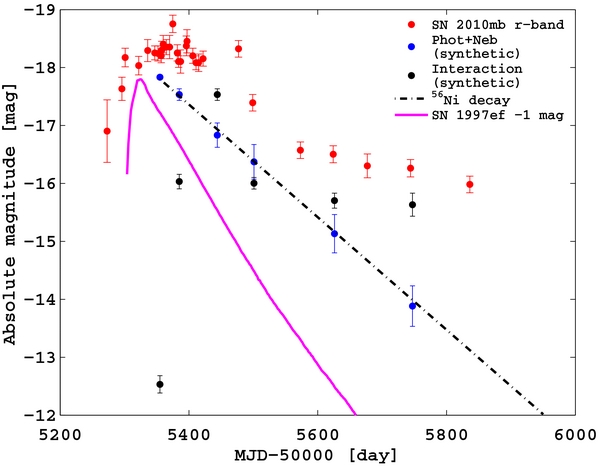
Figure 7. SN 2010mb synthetic LC. A synthetic LC (blue), showing the decay of the photospheric and nebular components only (based on the spectral decomposition, and interpolated between spectral epochs), behaves as expected of a 56Ni powered SN (dashed black curve), assuming full trapping of the gamma-rays, indicating a large ejecta mass. A synthetic LC of the interaction component is given as well (black dots), as is a scaled LC of SN 1997ef, a slowly declining Type Ic SN (magenta; Mazzali et al. 2004). The results suggest that a large fraction of the observed flux is not internal to the SN explosion but originates from interaction of the SN ejecta with CSM.
Download figure:
Standard image High-resolution image3.4. Interaction Lines
Some of the spectra show a prominent emission line on top of the [O i] λ5577 nebular feature, Figure 8. We detected and measured this emission line flux by fitting a function to the line profile using the standard IRAF procedure splot, as well as a custom MATLAB script, which removes nearby continuum by using a spline function at an area of ±100 Å around the line peak. We verified that the line is not sensitive to varying the parameters in the nebular modeling code (i.e., changing the amount of radiating mass in the nebular phase) and the blue quasi-continuum flux, and we found a variability of ∼5% for the line flux. We ran Cloudy, a spectral synthesis code designed to predict the physical properties in the ISM under a broad range of conditions 22 (Ferland et al. 1998). We modeled slabs of optically thin and collisional gas, in order to compute the emission-line intensities associated with specific elements, as functions of the gas temperature and density. Two models are presented in Figure 9, both with parameters chosen so that the flux of the [O i] λ5577 line is similar to/greater than that of the [O i] λλ6300, 6363 lines, as observed: (1) a composition of S, C, O, Si, Ca, and Fe, with ratios in accordance with the 2011 March 4 UT nebular model results (Table 3) in order to check whether the [O i] λ5577 line is coming from the SN ejecta (i.e., a slow component in the nebular matter); and (2) a composition of 90% He, 5% C, 5% O, and traces of iron—the expected shell composition from a PPI event (Chatzopoulos & Wheeler 2012). Comparing to the observed spectra, we rule out the nebular model, which would lead to strong lines of Ca ii that are not seen. The presence of only [O i] lines is consistent with the PPI model. The property of the [O i] λ5577 line as a tracer of high densities of oxygen is shown in Figure 9, bottom panel. Only at densities ∼107 cm−3 does the [O i] λ5577 line have a flux similar to the flux in the [O i] λλ6300, 6363 lines. For the [O i] λ5577 to be the dominant line among the [O i] lines as observed, a density of ∼109 cm−3 is required. Further examination of the data show that the [O i] λ5577 line is blueshifted by 800 km s−1 and has a velocity dispersion of 600 km s−1, while the [O i] λλ6300, 6363 lines have the same redshift as the host galaxy, and a velocity dispersion of ∼300 km s−1, i.e., they are instrumentally unresolved. We therefore identify the [O i] λ5577 high density line with the CSM interaction and the [O i] λλ6300, 6363 lines as the host galaxy emission.
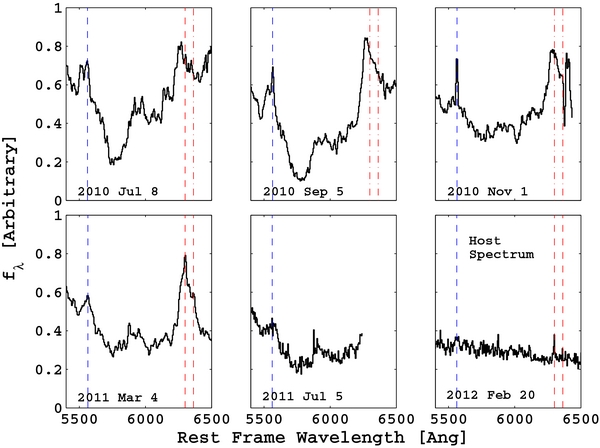
Figure 8. Evolution of the [O i] λ5577 collisionally excited line, which requires high densities (∼109 cm−3 for the [O i] λ5577 to be the dominant among the [O i] lines), similar to those expected in a shell ejected in a PPI event. This line is blueshifted by ∼800 km s−1 and has a velocity dispersion of ∼600 km s−1 (the dashed blue line indicates [O i] λ5577 blueshifted by 800 km s−1). It is getting stronger with time between 2010 July 8 and November 1 UT (integrated flux of 1.6 ± 0.3 and 7.8 ± 0.3 × 10⁻¹⁷ erg s−1 cm−2, respectively) and traces the flux increase seen in the interaction LC (Figure 7). In late spectra (2011 March 4 and July 5 UT), the peak integrated flux is less than 1 × 10⁻¹⁷ erg s−1 cm−2. While a PPI ejected shell is expected to be rich in He, C, and O (Chatzopoulos & Wheeler 2012), the [O i] λ5577 line is the only signature expected to fall in the optical waveband, as helium ionization requires much higher temperatures than those expected in the ejected shell, and C lines fall mainly in the near IR. The [O i] λλ6300, 6363 lines have the same redshift as the host galaxy and a velocity dispersion of ∼300 km s−1. They are clearly seen in the host galaxy spectrum taken on 2012 February 20 UT, Figure 11. We therefore identify them as host galaxy emission lines (dashed red).
Download figure:
Standard image High-resolution image
Figure 9. SN 2010mb interaction lines. Two models are presented, both with parameters chosen so that the flux of the [O i] λ5577 line is similar to/greater than that of [O i] λλ6300, 6363 as observed: (1) A composition of S, C, O, Si, Ca, and Fe, with ratios in accordance with the 2010 March 4 UT nebular model results (Table 3)—top panel. Ca ii lines are dominant (more than two orders of magnitude brighter than the strongest [O i] line), but are not observed. We find this model is ruled out. (2) A composition of 90% He, 5% C, 5% O, and traces of iron—the expected shell composition from a PPI event (Chatzopoulos & Wheeler 2012)—middle panel. This model is in agreement with the observed lines. The property of the [O i] λ5577 line as a tracer of high densities of oxygen is shown in the bottom panel. Only at densities ∼107 cm−3 (red curve), do the [O i] λ5577 and the [O i] λλ6300, 6363 lines have similar fluxes. For the [O i] λ5577 to be dominant among the [O i] lines, a density of ∼109 cm−3 is required (blue curve).
Download figure:
Standard image High-resolution imageWe find that the line at [O i] λ5577 reaches peak intensity between 2010 September 5 and November 1 UT (integrated intensity of 7 ± 0.4, 7.8 ± 0.3 × 10⁻¹⁷ erg s−1 cm−2, respectively), while the [O i] λλ6300, 6363 lines are clearly seen in the host galaxy spectrum taken on 2012 February 20 UT. The observed evolution of the [O i] λ5577 line seems to be responding to the blue quasi-continuum. This behavior, as well as the resemblance of the blue quasi-continuum model to the spectral continuum of SN 2010mb (e.g., the 2011 March 4 UT spectrum, Figure 6), shows that at late times the observed LC is powered by interaction of the SN ejecta with hydrogen-free CSM.
3.5. Circumstellar Material Mass
We can estimate the amount of CSM needed to convert the SN ejecta kinetic energy to radiation through interaction. From the LC, we estimate the amount of energy radiated between consecutive data points ΔE, and from the line width in the observed spectra, we get the ejecta velocity, v ≈ 5000 km s−1. Next, using the relation (1/2)ΔMv2 =  ΔE, where is the conversion efficiency and is determined in an iterative way using the relation = ΔMCSM/Mej
+ ΔMCSM (Murase et al. 2011), we derive the mass needed for energy conversion ΔM. We estimate the radius at which interaction takes place at any given time by assuming an expansion of the SN ejecta at a constant velocity of 5000 km s−1. We then derive a lower limit on the density by dividing the CSM mass by the shell volume swept by the ejecta between two consecutive points in the LC. We get a total CSM mass of ∼3.3 M☉ distributed around the progenitor with a density profile ∝r−2.6, (Figure 10, left panel). The derived densities (∼109 cm−3 peak density) are in agreement with the observed evolution of the [O i] λ5577 recombination line.
ΔE, where is the conversion efficiency and is determined in an iterative way using the relation = ΔMCSM/Mej
+ ΔMCSM (Murase et al. 2011), we derive the mass needed for energy conversion ΔM. We estimate the radius at which interaction takes place at any given time by assuming an expansion of the SN ejecta at a constant velocity of 5000 km s−1. We then derive a lower limit on the density by dividing the CSM mass by the shell volume swept by the ejecta between two consecutive points in the LC. We get a total CSM mass of ∼3.3 M☉ distributed around the progenitor with a density profile ∝r−2.6, (Figure 10, left panel). The derived densities (∼109 cm−3 peak density) are in agreement with the observed evolution of the [O i] λ5577 recombination line.
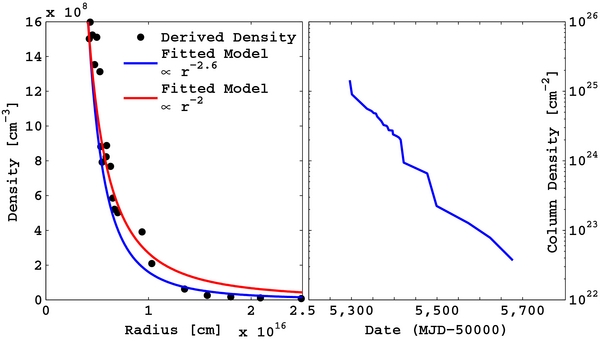
Figure 10. Characterizing the interacting CSM. Left: a CSM density profile derived from the LC of SN 2010mb, assuming a symmetric spherical CSM distribution (solid points; see text for details). The data are best fitted by a power law profile of n∝r−2.6 (blue line). For comparison, an n∝r−2 profile is also presented (red line). Right: CSM column density derived by integrating over the density profile shown in the left panel. The high column density explains why X-ray photons have not been detected.
Download figure:
Standard image High-resolution imageBased on this analysis, we conclude the following: (1) ∼3 M☉ of hydrogen-free CSM is present at the vicinity of the progenitor, with a mass loss rate higher than those associated with standard winds from Wolf–Rayet (WR) stars (i.e., Ø(1) M☉ year−1 compared to Ø(10−5) M☉ year−1). (2) Assuming bremsstrahlung is the main cooling mechanism of this plasma, the cooling time is orders of magnitude shorter than the time gap between adjacent points in the LC, i.e., Ø(103 s) at the derived densities versus Ø(106 s) between adjacent measurements on the LC, and so the CSM–ejecta interaction energy is radiated promptly. (3) SN 2010mb was imaged with the Swift X-ray telescope (Burrows et al. 2005) on 2011 April 22 UT. Using an exposure of 5435 s, we derive a 3σ upper limit of 5 × 10⁻¹⁴ erg s−1 cm−2 for the 0.3–10 keV band assuming a photon index of 2. The column density is high enough to explain why X-ray photons have not been detected (Figure 10, right panel).
3.6. Host Galaxy
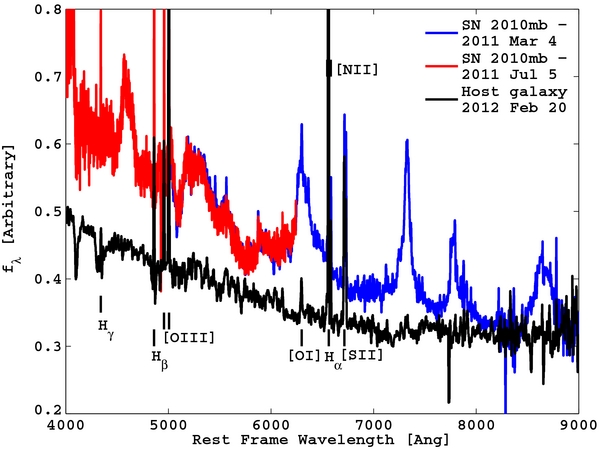
The host galaxy spectrum taken on 2012 February 20 UT (taken at the galaxy nucleus 13 E and 22 S from the SN location; Figure 11) shows narrow Balmer emission lines filling slightly wider Balmer absorption features. This is typical to galaxies with a dominant population of older stars (∼1 Gyr), mixed with a population of younger hotter stars (Dressler & Gunn 1983; Covino et al. 2006), which in turn indicates that star formation is still present in the galaxy. The spectrum is dominated by lines of Hα/β λλ6563, 4861, [N ii] λλ6548, 6583, [O iii] lines λλ4959, 5007, as well as [O ii] λ3727. The difference between the SEDs of the host galaxy (black curve) and SN 2010mb (blue and red curves), also evident from color comparison of the host (g − r = 0.45; Sloan Digital Sky Survey, SDSS) and the SN (g − r = −0.93 on 2010 July 10 UT and g − r = −2.73 on 2011 January 12 UT), shows that the blue quasi-continuum is not a result of residual contamination from the host galaxy.
Figure 11. Host Galaxy nucleus spectrum. The spectrum was taken on 2012 February 20 UT using LRIS mounted on Keck-I 10 m telescope and is calibrated to r band photometry. Two spectra of SN 2010mb (2011 March 4 and July 5 UT) are given for comparison, showing the different spectral energy distribution between the host galaxy and the SN, and demonstrating that the SN is much bluer than the host, also evident from color comparison of the host (g − r = 0.45; SDSS) and the SN (g − r = −0.93 on 2010 July 10 UT and g − r = −2.73 on 2011 January 12 UT). Spectra are available in digital form from the Weizmann Interactive Supernova Data Repository (WISeREP; Yaron & Gal-Yam 2012; http://www.weizmann.ac.il/astrophysics/wiserep/).
Download figure:
Standard image High-resolution image
Host galaxy analysis was performed using two different spectra: for the SN position using the spectrum taken on 2010 September 5 UT, and for the galaxy nucleus, using the spectrum taken on 2012 February 20 UT. The SN offset from the host galaxy center is 255 or 5.9 kpc in the radial direction at the redshift of the host (see Section 2.2). We detected and measured the emission line fluxes of Hα, Hβ [O ii], [O iii], and [N ii] using the standard IRAF procedure splot. We find that the host galaxy properties derived from the nucleus and from the SN position agree with each other within the error bars, with the SN position values having larger errors because of the lower signal-to-noise ratio at the SN position. We estimate a reddening of E(B − V) = 0.19 ± 0.03 mag for the nucleus and E(B − V) ⩽ 0.09 mag for the SN site, having used the observed ratio of the Balmer lines, and assuming the Cardelli et al. (1989) extinction law with RV
= 3.1, as well as case B recombination with a Balmer decrement of Hα/Hβ = 2.86. In the following, we correct the detected emission line fluxes for reddening. To compute the oxygen abundance from these H ii region emission lines, we follow Modjaz et al. (2011 and references therein) and employ the scales of Pettini & Pagel (2004; PP04-O3N2) and of Kewley & Dopita (2002, hereafter KD02), to obtain oxygen abundance values for the host galaxy nucleus of 12 + log (O/H)PP04 − O3N2 = 8.39 ± 0.01 and 12 + log (O/H)KD02 = 8.60 ± 0.05, respectively, where we consider only statistical uncertainties. The oxygen abundance at the SN site is consistent with that of the host galaxy nucleus within the error bars. We conclude that the metallicity of the SN host galaxy is  Z☉, having used the scale of Pettini & Pagel (2004) and a solar oxygen abundance value of 12 + log (O/H) =8.69 (Asplund et al. 2009). The total star formation rate that we measured using the Hα luminosity (Kennicutt 1998) is ∼0.32 M☉ yr−1.
4. DISCUSSION
4.1. Indications for a Pulsational Pair Instability Event
The observed data are consistently explained by a PPI event followed by a CC SN. During the first ∼150 days after discovery, ∼90% of the optical display is coming from the SN explosion. At later times, as the ejecta reach the hydrogen-free CSM, a shock wave is generated at the interface between the two media, and X-ray photons generated at the shock front are exciting both the CSM and the ejecta, thus introducing a new source of energy. Eventually, this new source dominates the optical radiation—as can be seen from the long-lasting optical display compared to other Type Ic SNe, the change in the SED, and the evolution of the forbidden [O i] line. If we assume a non-spherical geometry for the CSM, the high energy photons will excite mostly the ejecta in the plane of the torus, thus perhaps generating the observed internal structure in the nebular lines (Figure 5). Mazzali et al. (2007) suggest that a flat-topped profile might be the result of a disk observed edge-on (leading to a double peak line profile), where the inner component of the disk would contain more mass, so that its emission could fill the valley between the two peaks.
A recent model of a 110 M☉ star in a low metallicity environment produces a stripped C/O core when encountering the pair instability for the first time (Chatzopoulos & Wheeler 2012). The period of pair instability will result in the ejection of a ∼3 M☉ shell that is significantly enhanced in He, C, and O. Subsequent pulses may be even richer in carbon and oxygen, as they probe inner regions of the progenitor. Later, the progenitor will return to the normal evolution track, until it ends its life in an iron-CC SN. In the case of SN 2010mb, we estimate the time gap between the last pulse and the CC event was ∼2.2 yr, if we assume a velocity of 800 km s−1 for the matter ejected in the final pulse based on the observed [O i] λ5577 recombination line blueshift, again in accordance with models (Woosley et al. 2007). While in the past PISNe and PPI events were assumed to happen only in very low metallicity environments, recent works (Langer et al. 2007; Chatzopoulos & Wheeler 2012; Yusof et al. 2013) predict these explosions can also occur in local dwarf galaxies with metallicity values which are well within the errors of those measured for SN 2010mb, i.e., metallicities as high as Z = Z☉/3.
4.2. H-free CSM Disposition Around Massive Stars
Interaction of SN ejecta with hydrogen-free material is also observed in Type Ibn SNe (Pastorello et al. 2008a; Smith et al. 2012). These events are defined by strong He i emission lines, with a blue quasi-continuum, which are suggested to be the result of a blend of Fe ii lines that are observed in at least two cases (SN 1999cq, Matheson et al. 2000a; SN 2006jc, Foley et al. 2007). Type Ibn SNe are associated with the explosion of WR progenitors embedded in a helium-rich hydrogen-diluted CSM. The interacting material composition is consistent with that of WR winds, i.e., hydrogen and helium for WN progenitors, and helium for WC/WO progenitors (Pastorello et al. 2008b). The main differences between Type Ibn SNe and SN 2010mb are as follows: (1) Type Ibn SNe have much shorter timescales than that of SN 2010mb; therefore, 56Ni/56Co mixing in the outer shells is not a possible explanation for the blue quasi-continuum in our case as it decays too fast (a half-life of 8/77 days, respectively). Scattering from interstellar dust Matheson et al. (2000a) as echoes also cannot explain the plateau because the integrated flux during the plateau is higher than the flux from the peak in the case of SN 2010mb. (2) In Type Ibn SNe, B band and g band magnitudes decrease with time. (3) While in Type Ibn the interaction has a modest influence on the observed LC and a fairly modest amount of CSM is involved (less than ∼0.3 M☉; Pastorello et al. 2008a), in the case of SN 2010mb, CSM interaction is the dominant power source at late times, and it probably involves a much higher mass of CSM (>3 M☉). We conclude that a similar scenario to the one generating Type Ibn SNe is not adequate for SN 2010mb.
The presence of a large amount of CSM can also be attributed to wave excitation by vigorous convection in the late stages of stellar evolution (Si nuclear burning phase; Quataert & Shiode 2012). In this scenario, convective motions excite internal gravity waves that in some cases are converted to sound waves as they tunnel toward the stellar surface. As the sound waves dissipate while crossing through the star envelope, they release a large amount of energy that can unbind up to several solar masses of the stellar envelope. In case of SN 2010mb, the interaction goes for long time, indicating the CSM must extend over large distances, and it was ejected at an earlier phase than the Si nuclear burning phase of the progenitor. It remains to be demonstrated that high mass loss rates can be produced during earlier nuclear burning stages in order to explain the optical display of SN 2010mb.
Luminous blue variable stars (Humphreys & Davidson 1994, Meynet et al. 2011) are also associated with strong eruptions. Maeder (1992) has shown that in the outer shells of these stars, the free fall time becomes longer than the thermal diffusion time, leading to super-Eddington luminosity, and the ejection of a large amount of material. In cases where this process sets in after the progenitor lost its hydrogen and helium outer shells, the ejected material will be comprised from intermediate mass elements, mainly O and C, as seen in our case. This option is speculative at this time and needs to be further explored.
Finally, another event where interaction of SN ejecta with H-free CSM was suggested as a way to explain an increased, short lived luminosity is SN 2009dc, an SN interpreted as a 'Super Chandrasekhar' Type Ia SN. Hachinger et al. (2012) suggest that a non-violent white dwarf merger can culminate in a Type Ia SN interacting with H-/He-free CSM, causing an increase in the observed flux with respect to the flux of a typical Type Ia SN. In such a case, if the emitting CSM is concentrated in clumps or in a torus, the observed emission will be a sum of two components: one from the SN explosion, and the other from the ejecta-CSM interaction, as is the case for SN 2010mb. However, the total amount of radiation that can be added by interaction with white dwarf debris is much smaller than seen for SN 2010mb.
4.3. Other Scenarios
4.3.1. Photon Diffusion
Type II-P SNe also exhibit a plateau in their LCs. The mechanism driving this plateau is photon diffusion through the expanding ejecta. We analyze the SN 2010mb LC in the context of the recombination front model Popov (1993). In this model, the opacity is approximated by a step function and is constant above the ionization temperature, Tion, and equals zero below that. We assume that above the ionization temperature the opacity is dominated by Thomson scattering, and since the envelope contains mainly metals, we take k = 0.2 cm2 g−1. This approximation to the opacity is an upper bound on the real opacity, which is already smaller than 0.2 cm2 g−1 at temperatures of Tion ≈ 3 × 10⁴ K Rabinak & Waxman (2011). We assume the effective temperature of the radiation is ≈5, 000 K from the models described in Section 3.2, and we get an ion temperature of Tion ≈ (Teff/21/4) ≈ 4170 K. Based on this analytic model, we get the following estimation for the ejecta mass, explosion energy, and progenitor radius:


where t185 = tp /185 days, T4170 = Tion/4170 K, L41 = L/1041 erg s−1, v5 = vph /5 × 108 cm s−1, and κ0.2 = κ/0.2 cm2 g−1. Even when considering the uncertainties in the measurements, the model suggests an unrealistically large ejecta mass (several hundred solar masses of He, C, and O), and therefore, we pursue it no more.
4.3.2. Magnetar
Magnetars, very highly magnetic (B > 1014 G) and rapidly rotating (Ps ≈ 2–5 ms) NSs, generated at the time of SN explosion, can have a large impact on SN LCs (Mazzali et al. 2006; Maeda et al. 2007; Kasen & Bildsten 2010; Woosley 2010; Inserra et al. 2013). These magnetars spin down in a few months (comparable to the radiative diffusion time in SN ejecta, td ), depositing enough energy to power the rare superluminous (L > 1044 erg s−1) hydrogen poor SLSN-I Quimby et al. (2011); Gal-Yam (2012); Inserra et al. (2013). The much lower (and nearly constant) luminosity, LSN ≈ 1042 erg s−1, of SN 2010mb over a prolonged (>500 days) period requires a different interpretation. Specifically, a young NS with a magnetic dipole spin-down luminosity Lp ≈ 1042 erg s−1, and a spin-down timescale, tp , longer than 10 yr, so that Lp is approximately constant over the 500 days, is needed. Such a power source (Kasen & Bildsten 2010) would overwhelm the adiabatic losses from the initial explosion, and reset the SN luminosity to Lp . Setting Lp = 1042 erg s−1 gives the relation B ≈ 3 × 10¹³G(Ps /8 ms)2, and requiring a spin-down timescale longer than 10 yr implies that Ps < 8 ms. Though more rapidly rotating than the fastest known young pulsar, PSR J0537-6910 (Marshall et al. 1998) (at Ps = 16 ms), such an initial spin and magnetic field are certainly allowed (e.g., the implied B ≈ 4 × 10¹² G for an initial spin of 3 ms is entirely reasonable). In this scenario, the young NS spin-down luminosity is reprocessed by the SN ejecta, allowing for a long, visible event. Though we remain unsure as to the form (i.e., Poynting flux, particles, or radiation) of the spin-down power, Lp , we will assume that the thinning of the ejecta due to expansion will eventually lead to an inefficient coupling and, hence, a reduction in the optical brightness of the event. For an ejecta mass of Mej ≈ 5 M☉ moving at an average velocity fixed by E = Mej V2/2, the column depth in the ejecta will evolve with time as
implying thinning to fast energetic ions and hard radiation at about the time where the SN faded.
The magnetar model can explain the LC timescale but fails to explain the color evolution of SN 2010mb, the high density narrow O lines, and the presence of strong nebular lines that require an optically thin medium, while the reprocessing of the radiation emitted by the magnetar requires a thick medium.
5. CONCLUSIONS
Observations of SN 2010mb give direct evidence for interaction of SN ejecta with a large amount of hydrogen-free CSM. The extended LC, the rise in magnitude in the g band and B band, and the blue quasi-continuum that becomes more significant with time, show that a mechanism external to the SN explosion is injecting energy at late times. The presence of the [O i] λ5577 line and its evolution shows the external source is interaction of the SN ejecta with a large mass of hydrogen-free CSM at high densities at the vicinity of the SN. Finally, the late transition from photospheric to nebular emission and the spectral decomposition based on the similar SN 1997ef shows that SN 2010mb ejected a large mass ⩾12 M☉ , compared to 1.7 M☉ in "normal" Type Ic SNe (Drout et al. 2011), as is expected in an explosion of an extremely massive progenitor.
Combining all these signatures, a PPI scenario naturally comes to mind. In such a scenario, the period of PPI will result in the ejection of a few solar masses of matter that is composed mostly of He, C, and O. After the PPI period, the progenitor will return to the normal evolution track associated with massive stars, until it ends its life due to photo-disintegration and neutronization at its core (a CC). In case of a successful SN following the CC, the expected optical signature is a long-lasting event, where the SN ejecta will interact with the large amount of CSM ejected in the recent past. Other scenarios, such as wave-driven mass loss during late stages of nuclear burning, may be possible as well. A similar, if more intense, hydrogen-free CSM interaction may explain the energy source behind SLSN-I events (Quimby et al. 2011, Chomiuk et al. 2011, Pastorello et al. 2010, Leloudas et al. 2012, Inserra et al. 2013; see Gal-Yam 2012 for a review), which are found in growing numbers by various sky surveys in recent years.
The authors thank C. Franson, S.E. Woosley and K. Maeda for useful discussions on the theoretical aspects of SN 2010mb. S.B. acknowledges support by a Ramon Fellowship from ISA. A.G. acknowledges support by grants from the ISF, BSF, GIF, Minerva, the FP7/ERC grant n o 307260, the "Quantum-Universe" I-core program of the planning and budgeting committee and the ISF, and a Kimmel Investigator award. P.A.M. acknowledges financial support from INAF/PRIN 2011 and ASI. D.P. is supported by the Alon fellowship for outstanding young researchers, and the Raymond and Beverly Sackler Chair for young scientists. M.S. acknowledges support from the Royal Society. J.S.B. was partially supported by an NSF-CDI grant. M.M.K. acknowledges generous support from the Hubble and Carnegie-Princeton Fellowships. E.O.O. acknowledges the Arye Dissentshik career development chair and a grant from the Israeli MOST. The National Energy Research Scientific Computing Center, supported by the Office of Science of the U.S. Department of Energy, provided staff, computational resources, and data storage for this project.
Funding for SDSS-III has been provided by the Alfred P. Sloan Foundation, the Participating Institutions, the National Science Foundation, and the U.S. Department of Energy Office of Science. The SDSS-III Web site is http://www.sdss3.org/.
SDSS-III is managed by the Astrophysical Research Consortium for the Participating Institutions of the SDSS-III Collaboration including the University of Arizona, the Brazilian Participation Group, Brookhaven National Laboratory, Carnegie Mellon University, University of Florida, the French Participation Group, the German Participation Group, Harvard University, the Instituto de Astrofisica de Canarias, the Michigan State/Notre Dame/JINA Participation Group, Johns Hopkins University, Lawrence Berkeley National Laboratory, Max Planck Institute for Astrophysics, Max Planck Institute for Extraterrestrial Physics, New Mexico State University, New York University, Ohio State University, Pennsylvania State University, University of Portsmouth, Princeton University, the Spanish Participation Group, University of Tokyo, University of Utah, Vanderbilt University, University of Virginia, University of Washington, and Yale University.
Footnotes
- 17
We define a detection as a 5σ signal above the zero point photon count. In cases where the object did not pass this criterion, 2010 April 30 and May 12 UT (MJD 55316 and MJD 55328, respectively), the signals were 4σ and 2.6σ above the zero point photon count, respectively.
- 18
Image subtraction using previous images of the same field of view taken with the same instrument during 2009 as references was carried out, followed by forced PSF photometry and absolute calibration to the SDSS catalog as done, e.g., in Ofek et al. (2013).
- 19
See also Laher et al. 2012 for details on the Aperture Photometry Tool.
- 20
NASA/IPAC Extragalactic Database (NED) is operated by the Jet Propulsion Laboratory, California Institute of Technology, under contract with the National Aeronautics and Space Administration.
- 21
As the spectra are calibrated to host-subtracted photometry, this component is unlikely to be residual host contamination.
- 22
Cloudy is designed to compute the ionization and thermal properties, as well as the emitted spectrum, of plasma in collisional or photoionization equilibrium.