


ABSTRACT
We use data taken as part of Hubble Space Telescope (HST)/Wide Field Camera 3 (WFC3) observations of the Cosmic Assembly Near-infrared Deep Extragalactic Legacy Survey (CANDELS) to identify massive and evolved galaxies at 3 < z < 4.5. This is performed using the strength of the Balmer break feature at rest-frame 3648 Å, which is a diagnostic of the age of the stellar population in galaxies. Using the WFC3 H-band-selected catalog for the CANDELS GOODS-S field and deep multi-waveband photometry from optical (HST) to mid-infrared (Spitzer) wavelengths, we identify a population of old and evolved post-starburst galaxies based on the strength of their Balmer breaks (Balmer break galaxies, BBGs). The galaxies are also selected to be bright in rest-frame near-IR wavelengths and hence massive. We identify a total of 16 BBGs. Fitting the spectral energy distribution of the BBGs shows that the candidate galaxies have average estimated ages of ∼800 Myr and average stellar masses of ∼5 × 10¹⁰ M☉, consistent with being old and massive systems. Two of our BBG candidates are also identified by the criteria that are sensitive to star-forming galaxies (Lyman break galaxy selection). We find a number density of ∼3.2 × 10⁻⁵ Mpc−3 for the BBGs, corresponding to a mass density of ∼2.0 × 10⁶ M☉ Mpc−3 in the redshift range covering the survey. Given the old age and the passive evolution, it is argued that some of these objects formed the bulk of their mass only a few hundred million years after the big bang.
Export citation and abstract BibTeX RIS
1. INTRODUCTION
Understanding the evolution of galaxies with look-back time is among the greatest challenges in observational astronomy today. According to the ΛCDM scenario, galaxies assembled most of their mass through sequential merging, becoming more massive as they move down to lower redshifts (Kauffmann et al. 1993; Reed et al. 2003). These hierarchical models predict that dark matter halos become ever more massive as we move to the more recent past, with the gravitational potential wells produced by these halos providing the required seeds for gas collapse, leading to formation of galaxies (Sheth et al. 2001; Navarro et al. 1996). As a result, more massive galaxies are expected to form in massive halos at lower redshifts with younger and less massive systems often located at a more distant past (i.e., higher redshifts). However, recent studies have indicated a new population of massive galaxies at redshifts as high as z ∼ 5 when the universe was ∼1 Gyr old (Mobasher et al. 2005; Wiklind et al. 2008; Caputi et al. 2012). Furthermore, some of these galaxies show evidence for an evolved stellar population, formed through an initial burst of star formation followed by passive evolution (Labbé et al. 2005; Mancini et al. 2009; Fontana et al. 2009; Guo et al. 2012; Stefanon et al. 2013; Straatman et al. 2014; Oesch et al. 2013; Huang et al. 2011). This implies that most of these objects formed the bulk of their mass at very high redshifts.
A widely used method for selecting high-redshift (z > 3) galaxies is based on the identification of the Lyman break feature, the so-called dropout technique (Steidel et al. 1996; Giavalisco et al. 2004a; Bouwens et al. 2007; Beckwith et al. 2006). Many of the evolved systems at high redshifts lack the strong UV continuum characteristic of star-forming galaxies and therefore will be missed by such surveys. These evolved systems could strongly constrain galaxy formation scenarios and may constitute a significant fraction of the mass density of galaxies (Ilbert et al. 2013). Studying the contribution of this population to the global number and mass density will strongly constrain the high-mass end of the galaxy mass function at high redshifts. If such evolved and massive systems, missed from high-redshift Lyman-break-selected surveys, exist in large numbers, they could put strong constraints on evolutionary scenarios and predictions from hierarchical models for galaxy formation.
We propose to identify these evolved systems by searching for the pronounced Balmer break feature at rest-frame 3648 Å, which is an age-dependent diagnostic of their stellar population (hence the name Balmer break galaxies, BBGs). The Balmer break is most prominent in A-type stars with surface temperatures ∼10, 000° K. The strength of the Balmer break feature does not monotonically increase with age, and it reaches a maximum in stellar populations with ages 0.3–1 Gyr. Therefore, it is an efficient tool for identifying relatively quiescent (quenching) systems with current star formation rates (SFRs) significantly lower than the past average (Kriek et al. 2008).
In this work, we use the new Hubble Space Telescope (HST)/Wide Field Camera 3 (WFC3) near-infrared data from observations taken as a part of the Cosmic Assembly Near-infrared Deep Extragalactic Legacy Survey 11 (CANDELS: PI. S. Faber and H. Ferguson; see Grogin et al. 2011 and Koekemoer et al. 2011) program to identify redshifted Balmer break features at 3.0 < z < 4.5. In this redshift range the Balmer break falls between the H- and K-band filters. Here we also take advantage of the very deep Ks-band observations (at ∼2.2 μm) redward of the Balmer break from the Very Large Telescope (VLT)/HAWK-I instrument in the GOODS-S (A. Fontana et al., in preparation). The very deep near-IR photometry (from WFC3 and HAWK-I) ensures an accurate measurement of the Balmer break amplitude. Also the HST/WFC3 and optical data (blueward of the break) help to break the degeneracy and avoid contamination by lower-redshift dusty galaxies. This redshift range was chosen to take full advantage of the available deep WFC3 data when selecting the BBG candidates. This also reduces the lower-redshift red color contaminants in the sample. Finally, since the objects are brighter at these lower redshifts, it provides a higher likelihood of successful spectroscopic observation compared to higher-redshift (fainter) candidates (Wiklind et al. 2008).
The search for massive galaxies at high redshift is greatly aided by the availability of deep infrared data from the Spitzer Space Telescope. Massive galaxies are brightest in their rest-frame near-IR, which is shifted to mid-infrared Spitzer bands at higher redshifts. In this respect, Spitzer IRAC (Fazio et al. 2004) provides excellent probes of the stellar mass of galaxies at high redshifts (Papovich et al. 2006). Here we use Spitzer images, specifically the very deep IRAC observations at 3.6 μm and 4.5 μm, which are essential for estimating the stellar mass of these candidates.
This paper is organized as follows. In Section 2 we discuss the photometric data used for this study. In Section 3 we develop the criteria used to select the BBG candidates and discuss the robustness of the selection criteria. In Section 4 we present the spectral energy distribution (SED) fitting of the candidate BBGs identified from the color–color plots and discuss the candidate properties. In Section 5 we discuss the MIPS-detected BBG sample. We compare properties of the galaxies selected through the Lyman break galaxy (LBG) and BBG techniques over the same redshift range in Section 6, and we discuss the results in Section 7. Throughout this paper we assume a standard cosmology with  , Ωm = 0.3, and
  . All magnitudes are in the AB system, where mAB = 23.9–2.5log (fν/1μJy) (Oke & Gunn 1983).
2. THE PHOTOMETRIC DATA
We use the multi-waveband deep photometric observations in the GOODS-S field (Giavalisco et al. 2004b). In this study we focus on the CANDELS GOODS-S Deep area, which has very deep observations by the VLT HAWK-I instrument (A. Fontana et al., in preparation). The WFC3/IR observations in the CANDELS GOODS-S deep area consist of a rectangular grid of 3 × 5 tiles (∼6 8 × 10'; Grogin et al. 2011) and photometric observations in more than 14 broadband filters. In the redshift range of interest here, we explore a volume of ∼2.05 × 10⁵ Mpc3. In the following we describe details of the data and the construction of the photometric catalog.
2.1. U Band
The U-band data in GOODS-S were taken using the VIMOS instrument on the VLT (Nonino et al. 2009). They reach a magnitude limit of U = 27.97 (5σ over 0 8 radius aperture). These data are much deeper than the previous CTIO U-band observations available in the GOODS-S (U ∼ 26.53) and have a narrower point-spread function (PSF).
2.2. Optical Data
The optical data in GOODS-S are from observations by the HST/Advanced Camera for Surveys (ACS) instrument. The observations are done in the F435W (B435), F606W (V606), F775W (i775), and F850LP (z850) filters to magnitude limits of 28.95, 29.35, 28.55, and 28.55 mag, respectively (with 5σ detections in FWHM-sized apertures; Guo et al. 2013). We use version 3.0 ACS images, which are the deepest in the optical bands.
2.3. Near- and Mid-infrared Data
Near-infrared data for GOODS-S were taken with the WFC3 infrared instrument on HST as part of the CANDELS treasury program (Koekemoer et al. 2011; Grogin et al. 2011). The observations are in the F105W (Y105), F125W (J125), and F160W (H160) filters. The 5σ limiting magnitudes are 28.45 in Y105, 28.34 in J125, and 28.16 in H160 (Guo et al. 2013). These are the deepest near-IR data in the GOODS-S field, being more than 2 mag deeper than previous data from the VLT/ISAAC in the J and H bands.
The GOODS-S has also been observed in the near-IR by the VLT HAWK-I in the Ks filter at effective wavelength 2.2 μm (A. Fontana et al., in preparation). The HAWK-I Ks magnitude limit is 26.45 over an aperture of 04 (Guo et al. 2013). This is more than a magnitude deeper than the previous VLT/ISAAC Ks data. The final field of view of this work is chosen to take advantage of the deep Ks-band observations by the VLT/HAWK-I. The depth variation of the HAWK-I across GOODS-S does not play a significant role in selecting our candidates because of the small variations in the sky standard deviation at the position of our sources.
The mid-infrared data for this study are from observations by the Spitzer Space Telescope IRAC instrument (Fazio et al. 2004) of the GOODS fields covering the four IRAC bands (3.6 μm, 4.5 μm, 5.8 μm, and 8.0 μm bands). Particularly important for this study are the IRAC 3.6 μm and 4.5 μm bands, which are deeper given the data acquired during the Spitzer warm mission as part of the SEDS program (Ashby et al. 2013), with 3σ limiting magnitudes of 26 in both bands. The IRAC 5.8 μm and 8.0 μm bands have limiting magnitudes of 23.75 and 23.72, respectively (Guo et al. 2013).
2.4. The Photometric Catalog
We use the WFC3 H-band-selected catalog for the GOODS-S field, which is generated using the Template-FITting (TFIT) algorithm (Guo et al. 2013; Laidler et al. 2007). TFIT is a robust method for combining multi-waveband data observed with different instruments. One of the complications of performing consistent multi-waveband photometry of objects is the difference in resolution and PSFs among different instruments. Objects that are well separated in high-resolution images (ACS/WFC3) could be blended in the lower-resolution data (ground based or IRAC).
TFIT uses prior information from high-resolution images to construct object templates that are then fitted to the lower-resolution image from which fluxes are extracted (Laidler et al. 2007). Here we used the H-band-selected catalog because in the redshift range of interest here, the WFC3 H160 falls blueward of the Balmer break feature, and hence we need detections in this filter to be able to identify the BBGs. The final photometric catalog has data in more than 12 bands, including VLT/VIMOS U, HST/ACS B435, V606, i775, and z850, HST/WFC3 Y105, J125, and H160, VLT/ISAAC and HAWK-I Ks, and Spitzer/IRAC 3.6 μm, 4.5 μm, 5.8 μm, and 8.0 μm bands (Guo et al. 2013).
3. BBG SELECTION CRITERIA
We use the strength of the Balmer break feature, shifted to near-infrared wavelengths, to develop color criteria to identify post-starburst galaxies at 3.0 < z < 4.5. The near-infrared colors can also get a contribution from redshifted emission lines to broadband filters. Although we do not generally expect to have a strong emission spectrum for passively evolving galaxies, these emissions can mimic the Balmer break feature, leading to false identification of the BBGs. The post-starburst galaxy SEDs in the redshift range of interest could get contributions from several nebular emission lines, with the most prominent being [O ii], [O iii], and Hβ. In this section we develop the method and the criteria for selection of the BBG candidates and discuss the effect of nebular emission on the BBG templates.
3.1. Color–Color Selection Method
The Balmer break feature in post-starburst galaxies causes a break in the broadband colors of galaxies that can be used to identify the BBGs. In the redshift range of this study, the Balmer break (at rest-frame 3648 Å) falls between the WFC3 H160 and the HAWK-I Ks filters. Therefore, we use (H160 − Ks), straddling the Balmer break feature, as the primary color for identifying the quiescing galaxies. Figure 1 shows a sample post-starburst galaxy template at redshift z = 3.9 with relatively old stellar population (age > 350 Myr) and no dust extinction. The blue and red curves show the filter response functions of the WFC3 H160 and the HAWK-I Ks, respectively. At the redshift of this galaxy these filters probe the blue and red sides of the Balmer break.

Figure 1. Post-starburst galaxy template SED (Fλ) at z = 3.9 (black) with the WFC3 H160 (blue) and HAWK-I Ks filters (red) straddling the Balmer break at observed 1.8 μm (the plots have been normalized to a peak of one).
Download figure:
Standard image High-resolution imageWe use the synthetic SED code from Bruzual & Charlot 2003 (BC03; Bruzual & Charlot 2003) to create a library of model SEDs of galaxies spanning a wide range in parameter space and different galaxy types. We consider an exponentially declining star formation history (SFR) ∝exp(− t/τ)) for all of our models with the characteristic timescale for star formation, τ, ranging from 0 to 200 Myr with steps of 25 Myr. We use a Salpeter initial mass function and use solar metallicity. We used the Calzetti attenuation curve (Calzetti et al. 2000) for treatment of the extinction with color excess E(B − V) ranging from 0 to 0.9 (corresponding to Av = 0–3.6) in steps of 0.05. Attenuation due to neutral hydrogen in the intergalactic medium was estimated using Madau's prescription (Madau 1995). The age parameter, defined as the time since the onset of recent star formation, ranges from 0 to 2.5 Gyr (from 5 to 30 Myr in steps of 5 Myr, from 30 to 100 Myr in steps of 10 Myr, and steps of 100 Myr after that). The redshift range varied from z = 0 to 9 in redshift bins of Δz = 0.1. The maximum age possible in each redshift is limited to the age of the universe at that redshift.
We divide galaxy models into three different categories: the dusty starburst galaxies with an exponentially declining SFH, moderate to high values of extinctions, and relatively young ages (measured from the onset of star formation); the elliptical galaxies with no dust extinction and old ages; and the passively evolving post-starburst galaxies with moderate ages and low extinction values. The dusty starburst galaxies could also have an older age but with a new burst of star formation. The post-starburst galaxy population is considered to be the phase after the initial starburst in galaxies when the more massive stars leave the main sequence after a few hundred million years and is considered to be the phase before galaxies evolve into the early types at the lower redshifts with very old ages. The parameters used for the model evolutionary track are listed in Table 1.
Table 1. Parameters Used for the Model Evolutionary Tracks
| Models | Age | Extinction | τ | Redshift |
|---|---|---|---|---|
| (Gyr) | E(B − V) | (Gyr) | ||
| Post starburst | 0.3–1.5 | 0.0–0.2 | 0.0 | 0.0–9.0 |
| Dusty starburst | 0.005–0.1 | 0.4–0.9 | 0.0–0.2 | 0.0–9.0 |
| Elliptical | 1.5–2.5 | 0.0 | 0.0 | 0.0–3.0 |
Download table as: ASCIITypeset image
We integrated the WFC3 near-IR and HAWK-I Ks-band filter response functions over the model SEDs and found the corresponding magnitudes in the desired filters after incorporating the stellar and intergalactic extinctions. Changes in the color evolutionary tracks with redshift were then calculated. The degeneracies in the stellar population model parameters such as age, redshift, and extinction can also lead to red (H160 − Ks) colors. It is important to use more than one color to break the degeneracy between the high-redshift relatively quiescent galaxies (BBGs) and the dusty starburst systems. Therefore, in addition to the main (H160 − Ks) colors, we used the WFC3 (J125 − H160) and (Y105 − J125) and also nondetection conditions in the U and B435 bands in order to minimize the fraction of the contaminants. The region on the color–color plots where BBG candidates are located is shown as the gray shaded area in Figure 2. This is adopted to minimize the number of contaminants.

Figure 2. (Y − J) vs. (H − Ks) (left) and (J − H) vs. (H − Ks) (right) evolutionary tracks from BC03 models. In both plots solid red, solid blue, and dashed black evolutionary tracks represent elliptical, dusty starburst, and post-starburst galaxies, respectively. The parameters used to generate the model tracks are listed in Table 1. The yellow and red circles on the post-starburst galaxy tracks correspond to redshifts 3.0 and 4.5, respectively. The BBG selection criteria are identified by the gray shaded area on the plots.
Download figure:
Standard image High-resolution imageTherefore, for the post-starburst galaxies on the (Y105 − J125) versus (H160 − Ks) plot, we choose the following selection criteria:


and for the (J125 − H160) versus (H160 − Ks) plot, we choose


Equations (1a)–(2e) correspond to the shaded region in Figure 2 and are taken as our BBG selection criteria. In addition to the color location within the diagram, we imposed an additional constraint. The selected BBGs should also not be detected in the U and ACS B435 bands, as in the redshift range of our interest the Lyman break falls longward of these filters. These additional conditions help in removing the lower-redshift contaminants from the sample.
To further test the validity of the selection criteria, we generated post-starburst and dusty starburst evolutionary tracks as a function of the age of the galaxy. Analysis of these age-dependent evolutionary tracks recovers the same selection criteria that we originally identified for post-starburst galaxies. Also, we find that the main source of contamination is from very dusty starburst galaxies with strong nebular emission lines (and not lower-redshift early-type galaxies).
3.2. Simulations
In order to assess the robustness of our color selection criteria, we generated a WFC3 H160-band-selected mock catalog. The simulated catalog resembles the GOODS-S field as closely as possible. It has the same filters with the same wavelength, coverage area, and photometric depth. We use the observed luminosity functions from Dahlen et al. (2007) and randomly extracted galaxies with different absolute magnitudes from the luminosity function and randomly assign redshifts to each extracted galaxy. We then assigned spectral types to the simulated galaxies in the three main categories of early types, late types, and starbursts. We then randomly assign photometric errors to the simulated galaxies and add extinction spanning the range EB − V = 0–0.9, based on the galaxiesassigned spectral types.
The simulated catalog contains sources to a detection limit of 3σ in F160W. We used the observed Coleman, Wu, and Weedman spectral templates (Coleman et al. 1980) to calculate the K-correction. Using the assigned redshift to calculate the distance modulus, we measured the apparent magnitude in each of the filters for the simulated galaxies. The result is a mock galaxy catalog with apparent magnitudes in the same filters as in the GOODS-S, redshifts, spectral types, and extinction values.
Figure 3 shows the simulated color–color plots overlaid on the BBG selection criteria developed in Section 3.1. The green points represent the post-starburst galaxy population in the mock catalog that are in the redshift range z ≃ 3–4.5. We also show the simulated data for the early-type and dusty starburst galaxies as red and blue points, respectively. The simulations show that there is very little contamination from the elliptical galaxies, while the dusty starburst galaxies still contaminate the BBG sample. We will address this issue later in Section 4 when we fit the SED of the BBG-selected candidates to galaxy models.

Figure 3. Simulation color–color diagrams. The blue, red, and green data points correspond to elliptical, dusty starburst, and post-starburst galaxies from our simulation, respectively, with the BBG selection shown as the gray shaded area. Although we get very little contamination from the lower-redshift early-type galaxies (red points), the dusty star-forming systems could still contaminate the sample (blue points).
Download figure:
Standard image High-resolution image3.3. Candidate Identification from the Color–Color Criteria
We applied the BBG selection criteria derived in Section 3.1 to the deep WFC3 H-band-selected TFIT catalog, setting a 10σ detection requirement in the WFC3 H band for the catalog. We apply the (Y105 − J125) versus (H160 − Ks) and (J125 − H160) versus (H160 − Ks) criteria on the WFC3 H-band-selected catalog. We find a total of 24 sources in the combined two selection criteria identified as BBG candidates. Figure 4 shows the color selection criteria as the shaded region along with data from the H-band-selected TFIT catalog. Sources that are within the shaded region but did not satisfy the U- and/or B-band nondetection conditions were not included. The SEDs of all the identified candidates show pronounced Balmer breaks between the WFC3 H and HAWK-I Ks bands, as expected from the color selection.

Figure 4. Left: (Y − J) vs. (H − Ks) selection criteria (Equation (1)) applied to the CANDELS WFC3 H-band-selected TFIT data (black data points). Right: Plot of (J − H) vs. (H − Ks) (Equation (2)). Blue circles correspond to the selected candidates that lie within the selection criteria and are not detected in the U and B bands (i.e., are at z ∼ 3 and z ∼ 4). The red triangles are the UVJ-selected passive systems by Straatman et al. 2014. The final candidates are from the two combined color–color plots.
Download figure:
Standard image High-resolution imageOne widely used selection criterion for distinguishing quiescent galaxies from star-forming systems is by using the rest-frame U, V, and J in a (U − V) versus (V − J) color plot (the so-called UVJ selection; Labbé et al. 2005; Wuyts et al. 2007; Williams et al. 2009). The bimodality between dusty star-forming and quiescent galaxies in the UVJ selection becomes less prominent at z > 2 mostly because of photometric redshift uncertainties and weaker fluxes (Williams et al. 2009). Figure 5 shows the distribution of the near-infrared BBG-selected sources on a UVJ color–color plot. We see from the figure that many of the candidates are at the boundary of dusty star-forming and quiescent criteria or will be identified as dusty galaxies by this selection.

Figure 5. Distribution of the near-infrared color-selected BBG sources on the rest-frame UVJ color selection criteria (Williams et al. 2009). The area on the plot shows the UVJ predicted location for quiescent galaxies. The BBG-selected sources fall close to the boundary of dusty star-forming and quiescent candidates.
Download figure:
Standard image High-resolution imageRecently Straatman et al. (2014) and Spitler et al. (2014) extended the UVJ selection of passive galaxies to z ∼ 3–4 using medium-band data. The UVJ-selected quiescent candidates by Straatman et al. (2014) are plotted along with the BBG-selected candidates in Figure 4. All the UVJ-selected quiescent candidates fall on the BBG color selection criteria, while not all of them are selected as BBG candidates because of the additional criteria imposed on the U and B435 bands.
3.4. Effect of Nebular Emission on the BBG Selection
The nebular emission lines can play a significant role in both the selection and SED fitting of the BBG candidates. The sensitivity of the final estimated parameters on the nebular emission will be discussed in Section 4, while here we examine the effect of nebular emission on colors and hence on selection of the BBGs.
We account for the effect of nebular emission (both continuum and emission lines) following Schaerer & de Barros (2009) and Schaerer & de Barros (2010). The strength of nebular emission depends mainly on the number of Lyman continuum photons, which is computed from stellar population synthesis models. Relative line intensities are taken from Anders & Fritze-v. Alvensleben (2003) and Storey & Hummer (1995), for a typical interstellar medium (ISM) (ne = 100 cm3, T = 104° K). We assume that the Lyman escape fraction is equal to zero, which means that our models produce the maximum theoretical strength for nebular emission (under our assumptions about the ISM). Additionally, we also apply the same attenuation between nebular and stellar emission.
Figure 6 shows an example of the observed photometry for one of our BBG candidates at z = 3.6, along with fitted template SEDs without nebular emission (green), showing the Balmer break at ∼2 μm, and with nebular emission (blue). This reveals how redshifted nebular emission could disguise itself as a Balmer break feature. The infrared broadband photometry of the candidates could also be affected by the nebular emission lines. In particular, in the redshift range covered in this study, the Hα line at rest-frame 6563 Å could potentially contaminate the IRAC 3.6 μm flux at z ∼ 3.8. In order to further study the effect of nebular emission lines on the SED fit for our candidate galaxies, we measured the IRAC (m3.6 − m4.5) color of the BBG sample as the presence of the Hα line is only expected to affect the 3.6 μm band as it shifts to this band at a ∼ 3.8. For our BBG sample, there are four galaxies that have both IRAC 3.6 μm and 4.5 μm detections at the redshift range affected by this emission. Figure 7 shows the IRAC colors of the four BBG candidates for which Hα emission lines shift to the IRAC 3.6 μm. For three of these candidates, it is clear that the observed infrared colors are better represented by model SEDs that include nebular emission in the fit, accounting for the Hα contribution. Post-starburst galaxies are relatively old systems, and we do not expect to see strong Hα emission in their spectra. The candidates that are affected by this feature are relatively younger. Figure 7 implies that the absence of correction for nebular emission in the redshift range of interest here would lead to redder (m3.6 − m4.5) colors, which would mimic the Balmer break and hence overestimate their stellar mass.

Figure 6. Example of an SED fit to a BBG candidate at z = 3.60 without nebular emission (green) and with nebular emission (blue). This shows the extent to which nebular emission could mimic the Balmer break feature shifted to near-IR.
Download figure:
Standard image High-resolution image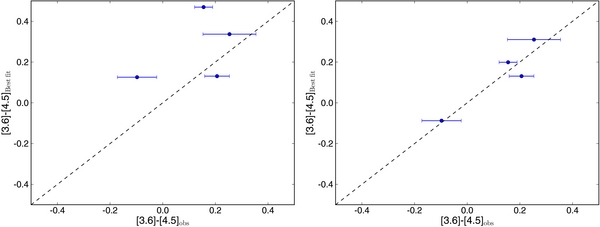
Figure 7. Left: observed IRAC colors of the four BBG candidates with strong contribution from the Hα shifted to the infrared passbands are plotted against the best-fit model color with no nebular emission contributions incorporated in the fit. Right: same as the left plot but with nebular emission added to the fit.
Download figure:
Standard image High-resolution imageIn order to better quantify the effect of nebular emissions, we also generated color evolutionary tracks for the post-starburst galaxies including contribution from nebular emission and recovered the same color selection criteria as for the model tracks in Figure 2, where no nebular emissions were incorporated. The effect of nebular emission on evolutionary tracks is most noticeable for dusty star-forming galaxies. For the highly dusty star-forming systems, inclusion of nebular emission would further shift them into the BBG selection domain, further contaminating the sample. Most of the contamination in the sample comes from this heavily dust-obscured, young, and star-forming population.
4. MEASUREMENTS OF THE OBSERVABLE PARAMETERS
In this section we study the nature of the BBG candidates by measuring their physical properties (stellar mass, age, etc.). We use this to examine whether the candidates fit the expected requirements for the BBGs. The photometric redshifts and physical parameters of the BBG candidates, selected from the criteria in Section 3.1, are inferred from fitting the observed SEDs with a BC03-generated template library using a modified version of the SED fitting code HyperZ (Bolzonella et al. 2000). In the SED fitting code, the redshift is a free parameter that is allowed to vary from z = 0 to z = 9 for fits with and without nebular emission. We consider solar metallicity and allow the extinction to vary from 0 < Av < 3. In the following we will discuss the SED fitting results of the BBG-selected sample.
4.1. Effect of Nebular Emission on Parameter Estimation
Adding nebular emission to the SED fitting is expected to lower the age and stellar mass estimate for the candidates that are affected by these emissions as it would reduce the mass-to-light ratio of these systems.
Figure 8 compares the stellar mass estimates for the BBG sample with and without nebular emission. Here, the blue filled circles correspond to the BBG candidates for which the SED fit, after adding nebular emission, gives a lower age estimate (by more than 0.5 dex). There is excellent agreement between the stellar mass estimates for the BBG candidates for which the difference in age estimate is small (Δlog (age) < 0.5). Figure 9 shows the age distribution of the color-selected BBG candidates that are affected by the nebular emission (blue filled circles in Figure 8). Here, including nebular emission in the fit significantly affects their parameter estimation, as seen from the distributions. Out of the 24 BBG candidates selected from color–color plots, 8 show strong nebular emission effects in their SED fit and were removed from the BBG sample as this causes false identification. The three candidates mentioned in Section 3.4 as having strong Hα contamination are among these eight galaxies. The strong nebular emission line galaxies are identified based on having a better χ2 fit with nebular emission. Figure 10 shows the postage stamp images of the final 16 BBG candidates in the multi-waveband. We see from this figure that many of the BBG-selected sources are relatively compact. This is in agreement with recent studies indicating that the first galaxies to become passive in the universe are the massive compact systems (Cassata et al. 2013; Williams et al. 2014).

Figure 8. Comparison of the stellar mass values for BBGs estimated with and without including nebular emission contribution. The blue filled circles correspond to sources with an age estimate difference of larger than 0.5 dex in fits with and without nebular emission.
Download figure:
Standard image High-resolution image
Figure 9. Age distribution of BBGs shown with filled symbols in Figure 8. The red histogram shows the age distribution of these sources without nebular emission added to the SED fit, and the blue histogram is the age distribution with the nebular emission effect added to the fit. These are the galaxies for which both their age and stellar masses are sensitive to the inclusion of nebular emission lines. Clearly, including nebular emission lines leads to younger ages and lower stellar mass estimates.
Download figure:
Standard image High-resolution image
Figure 10. Postage stamp images of the BBG candidates. From left to right, the VLT/VIMOS U band, ACS optical, WFC3 near-IR, VLT/HAWKI Ks, Spitzer IRAC, and MIPS 24 μm bands. The candidates are very faint in the bluer bands and get brighter in the redder bands. Three of the candidates are marginally detected in the MIPS 24 μm. The cutouts are 5'' × 5'' in size.
Download figure:
Standard image High-resolution image4.2. Photometric Redshift
By fitting the SED for individual BBGs, we estimated the photometric redshifts for each of our candidates selected from the color criteria. The relatively quiescent galaxy candidates at z ∼ 3–4 currently lack spectroscopic confirmation as a result of the absence of prominent emission features because of their passive nature, which would not allow us to further check the robustness of the estimated photometric redshifts. Figure 11 shows the distribution of the photometric redshifts for the color-selected BBG candidates. As expected, the BBG population has a redshift distribution that peaks between 3.0 < z < 4.5.

Figure 11. Properties of the BBG candidates selected from the color–color criteria. From left to right: photometric redshift distribution showing that most of the color-selected BBGs have Phot-z distributions that are consistent with the redshift range of interest here; mass distribution showing that the BBG selection is targeting the more massive galaxy population; age distribution indicating that our selection targets evolved systems; extinction distribution showing the range of reddening values.
Download figure:
Standard image High-resolution image4.3. Mass Measurement
The stellar masses for the BBG candidates were measured by fitting their SEDs to templates generated from the population synthesis models. In Figure 11 we plot the distribution of their stellar masses. The distribution has a median at log (M/M☉) ∼ 10.6, with the majority of the BBGs having large stellar masses. Mid-infrared observations by the Spitzer Space Telescope provide a direct measure of the stellar mass at the redshift range considered here (Papovich et al. 2006; Yan et al. 2006). Massive galaxies are brightest in the rest-frame near-IR band and at the redshift range considered here, which roughly corresponds to the observed IRAC 4.5 μm. The accuracy of the selection criteria and the estimated parameters are therefore directly affected by the depth and quality of the IRAC data. Therefore, the very deep IRAC data at 3.6 μm and 4.5 μm are essential for the present study as they are probing redward of the Balmer break. As discussed in Section 2.4, the depth achieved in the SEDS data (Ashby et al. 2013) gives a unique opportunity to constrain the SEDs of the most massive galaxies and to accurately measure the mass.
4.4. Extinction
We derive the extinction of the BBGs from SED fitting. The extinction is added to the templates used for the SED fitting in the range of 0 < Av < 3. Figure 11 shows the extinction distribution for the color-selected BBGs. From our classification in Table 1 we see that the post-starburst population has modest extinction values. Figure 11 shows that the majority of the BBGs have low to moderate extinction values. There are four color-selected candidates that have relatively large derived extinctions of E(B − V) > 0.3. These galaxies have relatively large SED-inferred SFRs, indicating that they could be part of the dusty galaxy population that contaminates the sample by replicating near-IR colors of the BBGs. We will further discuss this population in Section 5.
4.5. Age
The ages of the BBG sample are plotted in Figure 11. Age is perhaps the most loosely constrained parameter in the SED fit. It is also the parameter that affected the near-infrared colors of the post-starburst evolutionary tracks the most. The BBGs are an evolved population owing to their strong Balmer breaks (Table 1) and have relatively old ages (∼109 yr). Also, as we discussed earlier, this is the parameter that is most significantly affected (along with the stellar mass) by the presence of nebular emission lines to the SEDs of the galaxies (Figures 8 and 9).
5. MIPS-DETECTED BBGs
We now study the properties of our candidate BBGs as a function of MIPS detection at 24 μm. The detection in the Spitzer MIPS at the redshift of interest here can be interpreted as due to dust. At this redshift, the MIPS (at 24 μm) probes rest-frame 5–6 μm, which can result from the polycyclic aromatic hydrocarbon (PAH) feature, i.e., star formation. We cross-matched our BBG candidates selected from the color–color plots with the MIPS catalog for the GOODS-S (Magnelli et al. 2011), using a matching radius of 15. The matching radius is chosen to identify the MIPS sources while avoiding contamination from the neighbors. Out of 16 candidates identified as BBGs, 3 have an MIPS source associated with them. The bluest strong PAH band is at 6.2 μm, and for the BBG candidates to be bright enough to be detected by MIPS 24 μm band (assuming that the photometric redshifts are correct), this would mean that the detection is likely to come from hot dust continuum, most likely from an active galactic nucleus (AGN). One of the sources is detected in both X-ray and MIPS, which indicates the presence of an obscured AGN. We find that the three candidate galaxies that are detected in the MIPS 24 μm have moderate to high extinctions, with the candidate that is selected in both the MIPS and the X-ray having SED measured color excess (E(B − V)) of 0.6, indicating heavy dust obscuration. The candidates with MIPS and/or X-ray detections are listed in Table 2.
Table 2. List of the Color-selected BBG Candidates in the CANDELS GOODS-S
| ID a | R.A. | Decl. | Phot-z | log(Mass) | E(B – V) | log(Age) | SFR | F160W | (H-Ks) | MIPS | X-ray |
|---|---|---|---|---|---|---|---|---|---|---|---|
| (M☉) | (Gyr) | (M☉Yr−1) | |||||||||
| 2782 | 53.0835712 | −27.8875292 | 3.28 | 10.8 | 0.19 | 8.70 | 0.8 | 24.9 | 1.47 | N | N |
| 4356 | 53.1465968 | −27.8709872 | 3.88 | 11.1 | 0.69 | 8.86 | 261.2 | 26.3 | 1.56 | Y | Y |
| 4624 | 53.1379933 | −27.8682475 | 3.10 | 10.7 | 0.29 | 8.71 | 5.6 | 25.4 | 1.36 | N | Y |
| 6189 | 53.2057581 | −27.8521496 | 4.00 | 9.72 | 0.00 | 8.26 | 0.0 | 26.3 | 1.33 | N | N |
| 7526 | 53.0786782 | −27.8395462 | 4.48 | 10.6 | 0.04 | 8.71 | 0.5 | 25.9 | 1.55 | N | N |
| 9177 | 53.0383219 | −27.8252681 | 2.42 | 10.4 | 0.69 | 8.71 | 75.8 | 25.2 | 1.27 | N | N |
| 9286 | 53.2243550 | −27.8243357 | 3.27 | 10.7 | 0.39 | 9.23 | 31.8 | 25.6 | 1.24 | Y | N |
| 10479 | 53.1974865 | −27.8140435 | 3.91 | 10.5 | 0.19 | 9.16 | 9.1 | 26.4 | 1.45 | Y | N |
| 12178 | 53.0392836 | −27.7993085 | 3.22 | 10.6 | 0.04 | 9.16 | 1.8 | 25.1 | 1.28 | N | N |
| 12360 | 53.2194525 | −27.7979791 | 2.93 | 10.1 | 0.14 | 9.16 | 0.5 | 26.4 | 1.19 | N | N |
| 13327 | 53.1304511 | −27.7911228 | 3.38 | 10.1 | 0.19 | 8.26 | 2.7 | 25.6 | 1.18 | N | Y |
| 16671 | 53.1901828 | −27.7691400 | 2.69 | 10.8 | 0.19 | 9.36 | 2.1 | 24.8 | 1.20 | N | N |
| 17749 | 53.1968943 | −27.7604529 | 3.37 | 10.9 | 0.24 | 8.71 | 0.1 | 25.2 | 1.78 | N | N |
| 18180 | 53.1812226 | −27.7564225 | 3.32 | 10.8 | 0.19 | 8.71 | 0.0 | 25.1 | 1.60 | N | N |
| 18694 | 53.0503542 | −27.7521307 | 3.30 | 9.97 | 0.44 | 7.59 | 129.7 | 24.9 | 1.37 | N | Y |
| 19195 | 53.0643105 | −27.7477684 | 3.20 | 9.37 | 0.19 | 7.96 | 4.8 | 26.0 | 1.78 | N | N |
Note. aCANDELS GOODS-S TFIT WFC3 H160-band-selected catalog (Guo et al. 2013).
Download table as: ASCIITypeset image
6. COMPARISON BETWEEN THE SOURCES SELECTED BY THE LBG AND BBG TECHNIQUES
We now compare photometric properties of the candidates selected by the LBG and BBG criteria. For consistency, we apply these techniques to the same parent sample of GOODS-S galaxies with the same photometry to minimize systematic effects. This approach helps us to better understand the differences (or similarities) between the two populations of galaxies, color selected in different ways.
The LBG selection mostly targets star-forming galaxies with the pronounced Lyman break at rest-frame 912 Å while the Balmer break selection targets relatively quiescent systems with Balmer break feature at rest-frame 3648 Å. In principle, the BBG selection is expected to complement the LBG selection by identifying galaxies with older stellar populations, missed from the LBG selection.
In order to directly compare the BBG and LBG populations, we use the LBG selection criteria to identify galaxies over the same redshift range and area as the BBG sample in this study (3.0 < z < 4.5), using the same photometric data. This reduces sources of bias, providing a direct comparison between the two populations and selection methods. We use B-dropout selection criteria developed in Stark et al. 2009 as the criteria for LBG selection. Using the same photometric catalog and library of model galaxies to generate template SEDs, we fitted the SED of the LBG candidates and estimated their Phot-z, stellar mass, age, and extinction. Figure 12 compares the distribution of these values for the BBG and LBG populations. The BBG-selected galaxies have average mass of 5 × 10¹⁰ M☉ and average age of ∼800 Myr (from the Gaussian fits to the distribution). The LBG-selected galaxies, on the other hand, are less massive and have much younger ages. The Kolmogorov−Smirnov test confirms that the LBG- and BBG-selected galaxies are drawn from statistically different populations with high confidence. This shows that the BBG selection criteria target more massive and evolved systems than the LBG selection. Using the SED inferred photometric redshifts to shift SEDs to the rest frame, we stacked the best-fit SEDs of the BBG- and LBG-selected sources. Figure 13 shows the stacked rest-frame best-fitted template SED of the BBG and LBG sources. The LBG-selected star-forming systems are bright in the rest-frame UV and are characterized by the prominent Lyman break and strong emission lines, while the BBG-selected quiescing systems are relatively faint in the UV and are distinguished by the break at ∼4000 Å, as we see from Figure 13.

Figure 12. Distribution of the properties for the LBGs (blue) and BBGs (red) in the GOODS-S from the same photometric catalog. The distributions had been normalized. Both populations are selected in the same redshift range. From the distribution, we see that the BBG selection is targeting a more evolved and massive population than the LBG selection.
Download figure:
Standard image High-resolution image
Figure 13. Stacked best-fit template SED of the BBG candidates (red) and the LBGs (blue), both normalized to the flux at 2000 Å. The LBGs are distinguishable from BBGs by having bright rest-frame UV and strong nebular emission lines.
Download figure:
Standard image High-resolution imageFigure 14 shows the distribution of the BBGs on the color–color diagram used to identify LBGs (from Stark et al. 2009). Also shown is the LBG locus as the gray region. Two of our color-selected BBGs also satisfy LBG selection criteria (the blue filled circles in Figure 14). The two BBG-selected sources that are also selected as an LBG have high estimated SFRs and extinction, suggesting that these are the dusty star-forming galaxies and likely contaminants. One of these sources (ID 9286) has an MIPS counterpart indicative of a dusty galaxy and, the other (ID 18694) has an X-ray source associated with it, which could be an AGN. The overlap with the LBG selection is mainly due to the fact that post-starburst galaxies are in the phase of passive evolution but they still can have residual star formation present, resulting in the dual selection. The quiescent galaxies are relatively faint in the rest-frame UV (observed optical U and B bands in the redshift of interest here) as their stellar population is dominated by cooler and older stars. The BBG candidates were selected to be faint (nondetected) in the VLT/VIMOS U and HST/ACS F435W (Section 3). Candidates that have less than 2σ detections in the optical bands are shown with upper limit arrows in Figure 14.

Figure 14. Optical color–color plot of LBG B-dropout selection. The color-selected BBG sources are plotted as black points, and the color-selected BBG sources that are also identified as an LBG are plotted as blue. The arrows represent 2σ upper limits on the ACS bands for the optically faint BBGs. The B-dropout selection criteria are identified as the shaded area.
Download figure:
Standard image High-resolution image
7. DISCUSSION
Two of the widely used methods for identifying high-redshift galaxies are the narrowband selection technique, where line-emitting galaxies at given redshift slices are selected, and the LBG selection, which primarily selects UV-bright objects. Both techniques select actively star-forming systems and are biased against old and quiescent galaxies at high redshifts. The BBG selection technique is developed to allow for selection of these galaxies, which are missed by other techniques. Study of the nature of the BBGs would constrain star formation efficiency and mass assembly at high redshifts.
In this study we developed the criteria to identify BBGs at 3 < z < 4.5. Several recent studies (Bell et al. 2004; Brammer et al. 2011; Ilbert et al. 2013) have confirmed that the red sequence had already been in place by z ∼ 1, that there is a significant fraction of high-mass quiescent galaxies at z ∼ 2–3 (Kriek et al. 2008; Brammer et al. 2011; Marchesini et al. 2010; Whitaker et al. 2010), and support the presence of passively evolving galaxies at z ∼ 3–4 (Muzzin et al. 2013; Stefanon et al. 2013). Furthermore, using medium-band observations from ZFOURGE,12 Straatman et al. 2014 and Spitler et al. 2014 identified populations of optically faint, massive, and quiescent galaxies at z ∼ 4. These studies show that although there are relatively fewer of these systems compared to the star-forming galaxies at the same redshift, they still make a significant contribution to the global stellar mass density of the universe.
The most massive BBGs (> 1010 M☉) in our sample have an observed number density of ∼3.2 × 10⁻⁵ Mpc−3, corresponding to a stellar mass density of ∼2.0 × 10⁶ M☉ Mpc−3 at 3.0 < z < 4.5 compared to the BBGs with no MIPS 24 μm detection, which show an observed number density and mass density of ∼2.5 × 10⁻⁵ Mpc−3 and 106 M☉ Mpc−3, respectively, consistent with the ZFOURGE study. The BBG selection is specifically developed to minimize the contamination from dusty star-forming galaxies. As discussed in Section 3.1, all the UVJ-selected sources at z ∼ 4 by Straatman et al. 2014 fall in the BBG selection criteria, although not all of them are selected as BBG candidates because of the additional nondetection condition in the observed U and B435 bands (which probe the rest-frame UV at these redshifts). On the other hand, most of the BBG-selected sources at z ∼ 3–4 fall close to the dusty star-forming and quiescent boundary condition in the UVJ diagram, further confirming the complications involved in distinguishing the two populations on the UVJ plane with broadband photometry at z > 3.
The high-redshift star-forming galaxies are mostly selected through the LBG selection (Madau et al. 1996; Steidel et al. 1999, 2003; Stark et al. 2009) and the narrowband selection targeting the Lyα line (Kunth et al. 1998; Shapley et al. 2006; Gronwall et al. 2007). Given the passive nature of the quiescent systems, they lack the strong emission to be targeted by the narrowband selection, and they lack the strong UV continuum to be targeted by LBG selection. Using the rest-frame UV luminosity function (Reddy et al. 2008; Reddy & Steidel 2009; Bouwens et al. 2007, 2014), we estimated an observed number density of ∼(4–5) × 10−3 Mpc−3 for the star-forming galaxies at 〈z〉 ∼ 3–4 (down to  ), indicating that the relatively passive galaxies at z ∼ 3–4 (identified from BBG selections) are less than 10% as numerous as the star-forming systems at similar redshifts.
The mass function of galaxies has been studied extensively over the past few years out to z ∼ 4–5, for both the star-forming and quiescent galaxies (Dickinson et al. 2003; Fontana et al. 2006; Rudnick et al. 2006; Elsner et al. 2008; Pérez-González et al. 2008; Ilbert et al. 2013; Muzzin et al. 2013). Using a Spitzer IRAC-selected sample, Pérez-González et al. (2008) estimated the stellar mass function of galaxies and calculated the global stellar mass density of ∼2.7 × 10⁷ M☉ Mpc−3 at 3.0 < z < 3.5. In more recent studies, Marchesini et al. (2010) and Muzzin et al. (2013) estimated the stellar mass function of galaxies out to z ∼ 4, using a near-infrared-selected sample of galaxies. These studies estimate a stellar mass density of ∼4 × 10⁶ M☉ Mpc−3 in 3.0 < z < 4.0 for the most massive (> 1010 M☉) systems. Given the uncertainties inherent in the global stellar mass functions and corresponding mass densities at these redshifts, the BBG-selected passive candidates could contribute as much as 10%–40% to the stellar mass density of the universe at z ∼ 3–4.
With an average age of ∼800 Myr, the BBGs are expected to have formed the bulk of their mass in a burst of star formation at much higher redshifts and have been living a relatively quiescent life ever since (z ∼ 6; Mobasher et al. 2005; Wiklind et al. 2008; Straatman et al. 2014; Toft et al. 2014). Assuming a constant SFH, these massive galaxies must have assembled their mass with SFRs ∼ 50–100 M☉ yr−1. With a bursty SFH, which is more favored for these systems as supported by the strength of the Balmer break and the passive evolution, the progenitors of these systems must be forming stars well in excess of 100 M☉ yr−1. Recent works indicate young and highly star-forming Lyα-emitting systems at z ∼ 6–7 identified through narrowband detections with SFRs as high as a few hundred M☉/yr (Shimasaku et al. 2006; Ouchi et al. 2010; Mallery et al. 2012; Ono et al. 2012). Although these systems could potentially be the progenitors of the quenching systems that we identify at z ∼ 4, their predicted number density is very small (Straatman et al. 2014). Recent studies have indicated the presence of very highly star-forming galaxies at high redshift identified as dusty star-forming galaxies detected in the far-infrared and submillimeter wavelengths (Younger et al. 2007, 2009; Magnelli et al. 2012; Karim et al. 2013). These submillimeter galaxies (SMGs) are among the most star-forming systems with SFRs  (Capak et al. 2008; Fu et al. 2013). The intense star formation is believed to be the result of gas-rich major mergers (Tacconi et al. 2008; Ivison et al. 2012; Fu et al. 2013). Based on an 870 μm selected sample of submillimeter-selected galaxies, Toft et al. (2014) showed that these systems could be the progenitors of the quiescent galaxies found at z ∼ 2. By studying the number density of quiescent systems at z ∼ 4, Straatman et al. (2014) showed that the high-redshift SMGs might have the right number density to be the progenitors of these systems. Given the similar number densities for the BBGs in the same redshift range and assuming a relatively short formation timescale for these systems (∼200 Myr, as supported by the bursty models; Straatman et al. 2014), we see that the BBG-selected passive systems could be the descendants of the intensely star-forming submillimeter galaxies at
  .
.
At z ∼ 3, the most massive BBG candidates (M⋆ > 1010 M☉) will be residing in host dark matter halos (DMHs) of Mh ∼ 1012 M☉(M⋆/Mh ∼ 0.01) according to semianalytic models (Behroozi et al. 2013). These systems could potentially constrain the hierarchical galaxy formation scenarios (the ΛCDM models), if their number density exceeds the DMH number density required to host them at their redshifts (Wiklind et al. 2008). The observed number density of the BBGs is approximately 2 dex smaller than the predicted DMHs at these redshifts (∼3 × 10⁻³ Mpc−3; Mo & White 2002; Behroozi et al. 2013). This indicates that the formation of these systems is acceptable within the hierarchical scenarios of galaxy formation, although the exact mechanism of rapid mass growth is still controversial. Whether these galaxies formed their mass monolithically in these very massive halos at high redshift through constant gas accretion or through sequential merging, the physical process of this assembly is still controversial. A test of this would be to search for BBGs at higher redshifts (Wiklind et al. 2008). A large number density for the BBGs at z ∼ 5–7 favors the monolithic collapse hypothesis as galaxies at those redshifts (∼1 Gyr after the big bang) have not had enough time to go through the merger process and to consume all their gas making stars (Mobasher et al. 2005; Wiklind et al. 2008).
8. SUMMARY
- 1.We select relatively quiescent galaxy candidates based on their observed near-infrared colors in the HST/WFC3 filters using the age-dependent Balmer break in post-starburst systems to develop the BBG selection criteria. We identify 16 candidates in the GOODS-S Deep area at z ∼ 3–4.
- 2.The nebular emission lines play a significant role in estimating the SED-inferred parameters of the BBG candidates as they could alter mass and age measurements of the potential candidates.
- 3.There is an overlap between the BBG selection and an LBG selection in the same redshift range of study. The BBG sample that is also selected as an LBG happens to have very high SED-inferred SFRs. Also, we see that the BBG selection is picking a more massive and more evolved population compared to the LBG selection.
- 4.The most massive (M⋆ > 1010 M☉) BBG-selected candidates have observed number densities of 3.2 × 10⁻⁵ Mpc−3 (2.5 × 10⁻⁵ Mpc−3 for the MIPS nondetected sample) and observed mass densities of 2.0 × 10⁶ M☉ Mpc−3 (106 M☉ Mpc−3 for the MIPS nondetected sample) at z ∼ 3–4. The massive quiescent candidates are less than 10% as numerous as star-forming galaxies at similar redshifts and could contribute as much as 10%–40% to the mass budget of the universe at the redshift of the survey.
- 5.The BBG candidates have estimated average ages of ∼800 Myr. These systems must have had a passive evolution after the initial burst of star formation, which would indicate a high redshift of formation for these systems. The quiescent massive BBG candidates at z ∼ 3–4 could be the descendants of the very highly star-forming galaxies found at higher redshifts.
This work is based in part on observations made with the Spitzer Space Telescope, which is operated by the Jet Propulsion Laboratory, California Institute of Technology, under a contract with NASA. Support for HST Programs GO-12060 is provided by NASA through a grant from the Space Telescope Science Institute, which is operated by the Association of Universities for Research in Astronomy, Inc., under NASA contract NAS5-26555. The authors also wish to thank the anonymous referee for thoroughly reading the manuscript and providing very useful comments and suggestions.