


Abstract
A new method of momentum measurement of charged particles through multiple Coulomb scattering (MCS) in the OPERA lead-emulsion target is presented. It is based on precise measurements of track angular deviations carried out thanks to the very high resolution of nuclear emulsions. The algorithm has been tested with Monte Carlo pions. The results are found to describe within the expected uncertainties the data obtained from test beams. We also present a comparison of muon momenta evaluated through MCS in the OPERA lead-emulsion target with those determined by the electronic detectors for neutrino-charged current interaction events. The two independent measurements agree within the experimental uncertainties, and the results validate the algorithm developed for the emulsion detector of OPERA.
Export citation and abstract BibTeX RIS
1. Introduction
The multiple Coulomb scattering (MCS) process offers a means of estimating the momentum of charged particles in any detectors able to measure precisely particle trajectories even in the absence of a magnetic field. This technique has been used in the past in a large variety of tracking technologies. Early applications of the multiple scattering theory to measure momentum have been developed for cloud chambers [1], emulsion detectors [2] and spark chambers [3], the latter being essentially for balloon-borne cosmic ray experiments. This technique is still widely used and is continuously adapted for new detector technologies and concepts, such as for the recent measurements of the momenta of through-going atmospheric muons from MCS carried out by the MACRO collaboration [4] that used streamer tubes, and by the ICARUS collaboration with the T600 liquid argon TPC [5]. Alternatively, the MCS of cosmic ray muons passing through dense material is used to develop novel methods for muon tomography as described in [6].
The study described in this paper is an application of the MCS process to momentum measurement in a new generation emulsion experiment. The momentum of charged particles can be measured in emulsion cloud chambers (ECC) [7] made of massive material plates, used as the target, interleaved with nuclear emulsion films acting as high-resolution tracking devices. This technique was exploited by the DONUT experiment [8, 9] and is currently used in the OPERA experiment searching for νμ → ντ oscillations in the CNGS neutrino beam [10]. The study uses the geometry and the characteristics of the OPERA neutrino target ECC elements called 'bricks'. They have dimensions of 12.7 × 10.2 × 7.5 cm3 and are composed of a sequence of 56 lead plates (1 mm thick) and 57 emulsion films (44 μm thick emulsion layers on each side of a 205 μm thick plastic base). The total length of a brick corresponds to about 10X0.
Charged particles crossing the emulsions ionize silver bromide crystals, and clusters of silver grains, appearing as black dots, are formed along their paths after film processing. Automatic microscopes [11] are used to reconstruct three-dimensional (3D) particle track segments. Micro-track segments are reconstructed in single-emulsion layers as sequences of aligned grains. Two matching micro-tracks in a film define a base-track, obtained as the straight line connecting the grains closest to the plastic base in the two emulsion layers.
A track reconstructed through connecting segments in two or more films is called a volume-track.
The momentum measurement by MCS can be carried out by either the track position (coordinate method) [12] or the track angle (angular method) [13] measured in each emulsion film. The two methods determine the deviations of the trajectory from a straight line on the basis of position or angle measurements, respectively. The use of one method rather than the other depends on the required accuracy, and on the achievable spatial and angular resolutions. In OPERA ECC bricks, base-track directions are measured with a precision of a few mrad. Moreover, the angular method does not depend on a precise knowledge of the relative alignment of the different emulsion films. The evolution of slopes of consecutive base-tracks forming a volume-track can thus be used to compute the mean Coulomb scattering angle in a given lead thickness, which is directly related to the particle momentum. The angular resolution of the emulsions allows the determination of charged particle momentum from several hundreds of MeV c−1 to a few GeV c−1, which corresponds to the momentum range of secondary hadrons produced in neutrino interactions in the OPERA experiment. Several approaches to making angular deviation measurements in lead have been tested and compared in previous studies. The method presented in this paper is based on the work detailed in [14], and is used for the analysis of the neutrino events observed in OPERA [15].
The first part describes the method and the special treatment used for the large angle tracks. Results from Monte Carlo (MC) and from data analysis with pions from 1 to 8 GeV c−1 momentum for various track lengths are summarized in sections 3 and 4. In the last section, the results of the application of the algorithm to muon tracks reconstructed independently in the OPERA electronic detectors with momenta below 6 GeV c−1 are presented.
2. Measurement method
2.1. The scattering angle dependence on lead thickness
The main ingredient of the angular method measurement is the availability of several angular measurements along a volume-track. The present approach uses the angle differences measured in pairs of emulsion films separated by lead. In the following, one cell corresponds to one lead plate and one film. Figure 1 provides a schematic view of a volume-track and its associated base-tracks in the XZ projection plane. Let θi be the angle of a given base-track in the ith emulsion film,  in the XZ or Y
Z projection plane. Defining θik = θi+k − θi as the scattering angle after crossing a number k of cells, its distribution is peaked at zero and has a shape that can be approximated by a Gaussian with a standard deviation given by [16]
in the XZ or Y
Z projection plane. Defining θik = θi+k − θi as the scattering angle after crossing a number k of cells, its distribution is peaked at zero and has a shape that can be approximated by a Gaussian with a standard deviation given by [16]

where p is the particle momentum in MeV c−1, βc is its velocity, x is the distance traversed and X0 is the radiation length in the material. The accuracy of this approximation of Moliere's theory of scattering is better than 11% in any material, with 0.001 < x/X0 < 100 [17] for single charged particles with β ≈ 1.

Figure 1. Sketch of five lead cells in a target brick, where a volume-track and its base tracks are represented in the XZ projection.
Download figure:
Standard imageThe scattering is dominated by the lead since the radiation length in the emulsion layers and the plastic base is larger by more than one order of magnitude. For this reason, the value X0 = 5.6 mm will be assumed in the analysis and a thickness of 1 mm will be used for each cell, neglecting the emulsion films. By denoting the number of cells crossed by a particle track by Ncell, the above-mentioned expression becomes

The variance of the scattering angle distribution for a given cell depth Ncell = k is given by

where Nmeas is the number of scattering angle measurements and δθ is an additional term corresponding to the base-track angular resolution49.
The current experimental value of δθ is about 2.1 mrad. In order to determine p up to a few GeV c−1 through the scattering angle, a fit of the dependence of θmeas on the number of crossed cells is performed, treating p as a free parameter and fixing the angular resolution. With increasing p, the MCS starts dominating over δθ at larger values of Ncell, where the number of available measurements decreases, thus increasing the statistical error. In order to improve the sensitivity to high-momentum tracks, it is important to reduce the statistical uncertainty at large crossed thicknesses.
The method is illustrated in figure 2. It consists of using the differences between all combinations of pairs of angles separated by Ncell cells. For a given cell depth Ncell and a total track span Npl measured as the number of lead plates traversed by the particle, the number of available measurements Nmeas is given by


Figure 2. Representation of the number of possible measurements available when applying the MCS method up to Ncell = 3.
Download figure:
Standard image2.2. Track angle dependence
For large-angle tracks the following effects have to be taken into account. Firstly, the crossed lead thickness varies as 1/cos θ, with θ being the track angle measured with respect to the normal to the emulsion plane (the Z coordinate). Secondly, also the angular resolution δθ depends on θ, as the longitudinal uncertainty affects the measured grain positions along the optical Z-axis. This effect is dominated by the vertical resolution of the scanning system and is about 2.5 μm [11]. For angles above 200 mrad, this uncertainty is one order of magnitude larger than that in the transverse X and Y coordinates.
In order to decouple the intrinsic angular resolution from the slope-dependent contribution, the algorithm is constructed in a new reference coordinate system. It uses transverse and longitudinal coordinates (denoted, respectively, by T and L) as defined in [11], projected on the θT and θL axes of the reference frame schematically shown in figure 3. The T and L coordinates are obtained from X and Y by applying a rotation:


where  ). The 3D space angle can be written as


Figure 3. Schematic view of T–L coordinate reference frame, superimposed on the θy versus θx plot for the base tracks of 10 GeV c−1 MC muons at large angle (θX = θY = 500 mrad).
Download figure:
Standard imageAs can be seen in figure 3, the T coordinate gives an angular spread which remains the same for any track angle. The angular dependence of the resolution can be parameterized as [18]

and

where  z is a parameter that linearly depends on the longitudinal uncertainty.
This transformation allows keeping θT centred around 0 mrad as shown in figure 4. As discussed in section 3.2, an unbiased algorithm would use the 3D coordinate (both T and L or X and Y measurements) for small angles, and only the T coordinate at large angles. However, the latter choice results in only half the statistics, even though it is angle independent and free of bias. In the following, all the results are obtained using the T–L coordinate system.
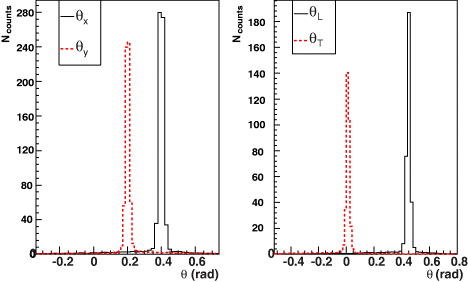
Figure 4. Angular distributions of base tracks from 4 GeV c−1 MC pions simulated with θX = 400 mrad and θY = 200 mrad in the XY (left) and TL projection planes (right).
Download figure:
Standard image2.3. Momentum and resolution estimate
In order to estimate the momentum resolution, samples of the same-momentum tracks can be analysed. Assuming a Gaussian distribution for θ0, the shape of the momentum distribution can be approximated by the function

where p0, p1 and p2 are free parameters. The parameter p1 corresponds to the average of the reconstructed momenta pmean. Figure 5 (left) shows an example of this fitted distribution for tracks of 4 GeV c−1 MC pions passing through 56 cells. In order to take into account possible uncertainties coming from the Gaussian analytic approximation of 1/p, the mean reconstructed momentum is obtained from the average fits of the distributions of both momentum and inverted momentum (figure 5 (right)). The first one has sensitivity to the high reconstructed momentum tail while the second is more sensitive to the lower reconstructed momentum values. The difference of the two results is the systematic uncertainty of the average fitted momentum determination. In the previous example, the results give 〈p〉 = 3.97 ± 0.01(stat) ± 0.08(syst) GeV c−1.

Figure 5. Momentum distribution (left) and inverted momentum distribution (right) for about 4000 tracks of 4 GeV c−1 MC pions reconstructed in an ECC brick.
Download figure:
Standard imageSince the inverted momentum distribution 1/p has a Gaussian shape, the width of the Gaussian divided by 1/pmean directly gives the momentum resolution estimate  . Its uncertainty can be obtained by propagating the errors on the two components, which are the width of the distribution and the reconstructed momentum. Therefore, the momentum resolution of the 4 GeV c−1 MC sample of pions passing through an entire OPERA target brick is 20.1 ± 0.6%.
3. Monte Carlo results
In this section, the results obtained from MC simulations are reported. The MC data correspond to 2, 4, 6 and 8 GeV c−1 pion samples of 1000 events each that have been generated with the simulation tool ORFEO, based on GEANT and developed in the OPERA framework [18]. It simulates particle interactions inside a brick and includes the main experimental effects such as the track efficiency and spatial resolution.
This section is divided into two parts: the first gives the results for small incident angles (θ < 200 mrad) and the second for large incident angles (θ > 200 mrad).
3.1. Tracks at small incident angles
Figure 6 shows the dependence of the scattering angle on Ncell for different momenta from 1 to 8 GeV c−1 50. Since the MC samples contain a large number of tracks with the same momentum, the single base-track angular resolution δθs can be directly determined together with the particle momentum from the fits of figure 6. The results are summarized in table 1.

Figure 6. The θmeas dependence on Ncell for MC pions of different energies, where δθs has been simulated at a value of δθMCs = 1.67 mrad. The solid curves correspond to the fitted expectations.
Download figure:
Standard imageTable 1. Reconstructed values of the single base-track resolution δθs, the average momentum 〈p〉 and the momentum resolution  for MC samples of tracks crossing an entire brick and for different energies simulated with δθMCs = 1.67 mrad.
| pMC (GeV c−1) | δθs (mrad) | 〈p〉 (GeV c−1) |  ) ) |
|---|---|---|---|
| 1 | 1.80±0.20 | 1.03±0.01 | 14.2±0.3 |
| 2 | 1.76±0.05 | 2.04±0.03 | 15.4±0.3 |
| 3 | 1.67±0.02 | 3.01±0.05 | 17.6±0.5 |
| 4 | 1.68±0.01 | 3.97±0.09 | 20.1±0.6 |
| 6 | 1.66±0.01 | 5.99±0.17 | 22.0±0.7 |
| 8 | 1.66±0.01 | 8.13±0.30 | 26.0±1.0 |
The values of 〈p〉 and  have been obtained with the method described in section 2. It appears that the linearity between reconstructed and MC momenta is kept over the whole range and that the momentum resolution worsens with the momentum, as expected. The linearity of the MC reconstructed momentum and the evolution of the momentum resolution show the consistency of the method. They also demonstrate that the approximation of lead as the main scattering element is well suited for the OPERA ECC configuration.
These results were obtained for tracks passing through 56 cells of an ECC brick. Figure 7 shows how the resolution worsens with increasing momentum and with decreasing track span.

Figure 7. Momentum resolution dependence on track span Npl for MC pions with δθMCs = 1.67 mrad. The solid lines correspond to the fitted parameterized resolution function of equation (11).
Download figure:
Standard imageUsing all the MC results for different track spans and momenta values, the momentum resolution  has been parameterized in terms of the momentum p and track span Npl as

The fitted function describes well all momentum measurements from 1 to 8 GeV c−1 for various track lengths.
3.2. Tracks at large incident angles
A first sample of 2, 4 and 6 GeV c−1 MC pions has been generated at angles of θX = 200 and 400 mrad and θY
= 0 mrad. The δθT
and δθL angular dependences have been parameterized according to equations (8) and (9) using the resolution parameters measured with a special brick consisting of a sequence of emulsion films, without lead exposed to 7 GeV c−1 pions at several incident angles. The track resolution parameters are measured to be δθL(0) = δθT
(0) = 2.1 mrad and z = 9.3.
Different MC samples have been simulated using this parameterization of the angular resolution. For the MC event samples at θX = 200 mrad, the measured values of 〈p〉 in 3D and 2D projections T,L are consistent with the expected values. The values of 〈p〉 in the 3D and L projections for 4 and 6 GeV c−1 pions at θX = 400 mrad are 10 and 20%, respectively, lower than the true momentum, while there is agreement in the T projection. This is explained by the angular dependence of longitudinal resolution, which increases linearly with the angle reaching already a factor of two for track angles of 200 mrad. Note that the T projection is not affected since it is angle independent.
For the same reason, the momentum resolution is stable, as can be observed in figure 8 depicting the dependence of  on angle in the T projection. This plot also shows that the momentum resolution in the T projection is worse than in the 3D case for tracks at 0 mrad, due to the 50% reduced statistics when using only one projection.

Figure 8. Momentum resolution with respect to the 3D angle θ for different MC pion momenta, obtained using only the T projection. As a reference, the values obtained at 0 mrad in 3D are indicated by the open symbols.
Download figure:
Standard imageAll the previous considerations lead to the conclusion that, at large angles, the optimal method for estimating the momentum is to use the T projection, which is not biased and not angle dependent. However, at small angles, the 3D calculation remains statistically more accurate, resulting in improved momentum resolution. In the algorithm, the threshold for large angles is set to 200 mrad, such that the angular resolution δθ is kept independent and always equal to the value for θ = 0.
A second sample of 2 and 4 GeV c−1 MC pions has been generated with θX = 400 mrad and θY
= 200 mrad. Since the 3D angle is above 200 mrad, we report only the results obtained with the T projection. The value of δθT
is fixed at 2.1 mrad. The measured values of 〈p〉 and  are given in table 2. The momentum measurements are consistent with the input values, and the momentum resolutions agree with previous estimates.
Table 2. The results on 〈p〉 and  with the T projection for 2 and 4 GeV c−1 pions, with θX = 400 mrad and θY
= 200 mrad.
with the T projection for 2 and 4 GeV c−1 pions, with θX = 400 mrad and θY
= 200 mrad.
| pMC (GeV c−1) | 〈p〉 (GeV c−1) |  |
|---|---|---|
| 2 | 1.9±0.1 | 22±1 |
| 4 | 3.9±0.2 | 26±1 |
The method of using the T projection for angles larger than 200 mrad is thus validated. Similarly to equation (11) for small angles, it is now possible to parameterize this dependence at large angles as well, using the T projection and a similar analytic formula. It gives

This single function, shown in figure 9, describes all the MC results from 1 to 8 GeV c−1 for various p and Npl values. As in equation (11), it is used to assign the confidence level ranges of single-track momentum measurement.

Figure 9. The momentum resolution dependence on track span Npl for MC pions using the T projection with δθMCs = 1.67 mrad. The solid lines correspond to the fitted parameterized resolution function of equation (12).
Download figure:
Standard image3.3. Comments on method comparisons and systematics
Various MC studies concerning systematic errors and comparisons with other methods have been carried out in [14]:
- As explained in section 2, using the differences between all combinations of pairs of angles separated by Ncell cells increases the number of measurements. It has been established that when using only the differences between successive pairs of angles, the fit of the momentum distributions diverges above 4 GeV c−1. Moreover, the momentum resolutions are 1.5 times worse.
- A track momentum p can be measured with both δθ (angular base-track resolution) and p as free parameters in the fit procedure. However, an error of a few per cent on δθ can affect the momentum reconstruction by more than 10% for high-energy tracks (above 4 GeV c−1). The best results are obtained with the proposed method keeping δθ constant. The physical value of the base-track angular resolution is usually between 1 and 2 mrad and depends mainly on the experimental conditions. The value of δθ can be determined or verified with reference measurements of angular deviations in emulsion films, without scattering in heavy materials.
- Effects from the correlations among the θmeas values measured at different Ncell cells have been estimated by building covariance matrices at different energies and track lengths with MC samples. Fits of the track scattering angle dependence on Ncell have been repeated by incorporating the covariance matrix in the minimization function used to compute the track momentum. The difference from the uncorrelated fit is found to be less than a few per cent for the absolute momentum value determination for pion momenta ranging from 2 to 8 GeV c−1 and the resolution stays unchanged.
4. Analysis of pion test beam data
We report here the results obtained with real data collected in a test beam exposure of OPERA bricks to 2, 4, 6 and 8 GeV c−1 pions produced by the CERN PS accelerator. Figures 10 and 11 compare the momentum distributions of MC (red solid line) to real data (black crosses) for pions crossing the entire brick with momenta of 2 and 6 GeV c−1, respectively. Table 3 summarizes the values of the single base-track resolution δθs, the average momentum 〈p〉 and the resolution  obtained for each data sample.

Figure 10. Data/MC comparison for 2 GeV c−1 pions. Left: momentum distribution. Right: inverted momentum distribution (〈p〉/p − 1).
Download figure:
Standard image
Figure 11. Data/MC comparison for 6 GeV c−1 pions. Left: momentum distribution. Right: inverted momentum distribution (〈p〉/p − 1).
Download figure:
Standard imageTable 3. Reconstructed values of δθs, 〈p〉 and  obtained with pion test beam data.
| pπ (GeV c−1) | δθs (mrad) | 〈p〉 (GeV c−1) |  |
|---|---|---|---|
| 2 | 2.26±0.01 | 2.08±0.05 | 19.6±0.4 |
| 4 | 1.72±0.01 | 4.32±0.08 | 19.4±0.4 |
| 6 | 1.90±0.01 | 5.9±0.2 | 21.0±3.0 |
| 8 | 1.48±0.01 | 7.2±0.5 | 32.0±2.0 |
The results for real and simulated data are consistent within 11%. Concerning additional systematic uncertainties coming from beam composition, it appears that while the 4 and 6 GeV c−1 data samples have the expected p resolution, the momentum resolution for 2 and 8 GeV c−1 data is measured to be 4 and 10%, respectively, worse than for the MC expectations. The discrepancy at 8 GeV c−1 has been understood to come from a higher muon contamination produced after the momentum selection collimators in the pion beam, which was not taken into account in the simulation. In the case of the 2 GeV c−1 sample, the resolution is slightly worse due to scattering on different materials placed along the beam line in front of the bricks.
Data at large angles from test beam pions of several energies and different incident angles recorded in one OPERA brick have also been analysed. Figure 12 shows the angular distribution in θX for reconstructed tracks with length (Npl) ranging from 25 to 30 plates. The different peaks correspond to
- 2 GeV c−1 pions at 200 and 400 mrad,
- 4 GeV c−1 pions at −200 and −400 mrad,
- 6 GeV c−1 pions at 100, 300 and 600 mrad,
- 8 GeV c−1 pions at 50 mrad, used as reference data at small angles.

Figure 12. Angular distribution in θX for pion tracks reconstructed in the brick with a span between 25 and 30 plates.
Download figure:
Standard imageThe results for large angles are summarized in table 4. The values of 〈p〉 are compatible with the expected pion beam momentum. The reconstructed momentum resolution can be compared with the one parameterized in equation (12), also given in table 4. The measured values are compatible with the expectations except for the 2 GeV c−1 samples, where the measured value of  is overestimated by 25–40%. This effect is also due to the scattering on different materials, placed along the beam line in front of the brick during the test beam. The 2 GeV c−1 pions have been particularly affected, as can be seen from the broad peaks in figure 12: the interactions on materials lead to a dispersion in angle and in energy, which deteriorates the results on momentum resolution at low energies.
Table 4. Results of momentum measurements obtained with the pion test beam at different angles and energies. The calculation was performed in the T projection, with δθT fixed at 2.1 mrad.
| ptrue (GeV c−1) | Npl | θ3D (rad) | 〈p〉 (GeV c−1) |  (%) (%) |
 (%) (%) |
|---|---|---|---|---|---|
| 2 | 36 | 0.2 | 2.2±0.2 | 37±5 | 26 |
| 2 | 28 | 0.4 | 2.1±0.1 | 38±3 | 30 |
| 4 | 36 | 0.2 | 4.3±0.3 | 32±2 | 32 |
| 4 | 28 | 0.4 | 4.0±0.5 | 42±6 | 37 |
| 6 | 36 | 0.1 | 6.3±0.6 | 44±5 | 38 |
| 6 | 36 | 0.3 | 6.1±0.6 | 38±4 | 38 |
| 6 | 28 | 0.5 | 5.7±0.5 | 45±4 | 44 |
Taking into account these effects, one can conclude that MC and test beam data are compatible and give consistent results at both small and large angles.
The results obtained in this study at different track angles are in agreement with the 23% resolution obtained at small angles (<300 mrad) by Kodama et al [9] with similar emulsion stacks of 24 plates exposed to pions of 0.8 and 1.5 GeV c−1. The present work adds a major contribution to the use of MCS for momentum measurement in ECC by extending the method to track angles larger than 300 mrad keeping the momentum resolution at large angle better than 40% for momentum less than 6 GeV c−1.
5. Soft muon momentum measurement in OPERA
In order to validate the algorithm with charged particles produced in neutrino interactions, a sample of muons recorded in the 2008 run originating from charged current interactions (νCCμ) in the OPERA target bricks was selected. Details of the detector characteristics, data acquisition, event reconstruction and analysis procedures can be found in [19]. More details of the performance of the OPERA electronic detectors can be found in [20].
The muon momentum in the electronic detectors was obtained either from the range of the particle in the OPERA target tracker or in the spectrometer yoke or from the magnetic spectrometer measurement. The corresponding momentum resolution Δp/p is estimated at about 10% for the sample analysed. In order to match the momentum range accessible with the MCS algorithm, charged current interactions where a muon was reconstructed in the electronic detectors with a momentum below 6 GeV c−1 were selected. The corresponding neutrino interaction vertices were located in the emulsion target, and one emulsion track per event was matched to the muon track predicted by the electronic detectors. Additional selection criteria have been applied on track quality and length. The required minimum track span is 10 cells. The final sample corresponds to 43 events. Figure 13 shows the dependence of the angular deviation on the thickness of lead traversed in the 3D (left) and the T (right) coordinates for two different muon tracks. The dashed line shows the expected angular dependence obtained with the momentum measured by the electronic detectors, while the solid line is the result of the fit of the momentum by the MCS method described in this paper. The two momentum measurements from MCS and electronic detectors are fully compatible.

Figure 13. The angular deviation dependence on the thickness of lead traversed by a muon track with an incident angle of 98 mrad using the 3D coordinates (left) and for a muon track with an incident angle of 321 mrad using the T coordinate (right). The dashed line shows the expected angular dependence obtained with the momentum measured by the electronic detectors, while the solid line corresponds to the momentum measured by the MCS algorithm in emulsion.
Download figure:
Standard imageThe muon momenta in the selected sample range from 2 to 6 GeV c−1, as can be seen in the left plot of figure 14, which shows the correlation between the two measurements: the right plot shows the relative difference with respect to the electronic detector value.

Figure 14. Left: muon momenta measured by MCS (PMCS) as a function of the momenta obtained from the electronic detectors (PED). The error bars correspond to the 68% confidence level range. Right: the relative difference between the two measurements with respect to the electronic detector measurement.
Download figure:
Standard imageThe distribution is a Gaussian centred at zero. The width gives an average resolution of (22 ± 4)%, compatible with the expectation obtained by folding the track sample characteristics with the parameterized resolution functions. The width includes also a contribution from the electronic detector resolution. In order to cross-check the estimate of the experimental uncertainty, the differences of the measured inverted momenta have been normalized to the uncertainty estimates on 1/p, given by equations (11) and (12) for the different track spans and angles. The resulting Gaussian distribution has a standard deviation of 1.10 ± 0.24, compatible with unity. This shows that the uncertainty for each track is properly estimated.
6. Conclusions
An improved angular method has been developed to exploit MCS for the momentum measurement of charged particles in ECC detectors. The results of MC studies and pion test beam data show that momenta up to 8 GeV c−1 can be measured with a resolution better than 30%. The approach has been optimized for small incident angles, as well as for large-angle tracks entering the OPERA lead-emulsion target elements, and is well suited for the neutrino interaction analysis. The results obtained with muons measured with the OPERA electronic detectors have confirmed the validity of the approach and assessed the performance of the algorithm.
Acknowledgments
We thank CERN for the successful operation of the CNGS facility and INFN for the continuous support given to the experiment during the construction, installation and commissioning phases through its LNGS laboratory. We acknowledge funding from the following national agencies: Fonds de la Recherche Scientifique—FNRS and Institut Interuniversitaire des Sciences Nucléaires of Belgium; MoSES of Croatia; CNRS and IN2P3 of France; BMBF of Germany; INFN of Italy; JSPS (Japan Society for the Promotion of Science), MEXT (Ministry of Education, Culture, Sports, Science and Technology), QFPU (Global COE programme of Nagoya University 'Quest for Fundamental Principles in the Universe' supported by JSPS and MEXT) and the Promotion and Mutual Aid Corporation for Private Schools of Japan; SNF, the Canton of Bern and the ETH Zurich of Switzerland; the Russian Foundation for Basic Research (grant no. 09-02-00300 a), the programmes of the Presidium of the Russian Academy of Sciences 'Neutrino Physics' and 'Experimental and theoretical researches of fundamental interactions connected with work on the accelerator of CERN', Programs of Support of Leading Schools (grant no. 3517.2010.2) and the Ministry of Education and Science of the Russian Federation; a Korea Research Foundation grant (KRF-2008-313-C00201); and TUBITAK, the Scientific and Technological Research Council of Turkey. We are also indebted to INFN for providing fellowships and grants to non-Italian researchers. We thank the IN2P3 Computing Centre (CC-IN2P3) for providing computing resources for the analysis and hosting of the central database for the OPERA experiment. We are indebted to our technical collaborators for the excellent quality of their work over many years of the design, prototyping and construction of the detector and of its facilities. Finally, we thank our industrial partners.
Footnotes
- 49
δθ is the angular resolution between two base-tracks. The single base-track angular resolution is
 .
. - 50
The MC samples have been tuned in order to reproduce the measured δθs, obtained in the scanning of the test beam data samples with the same momenta.
