Abstract
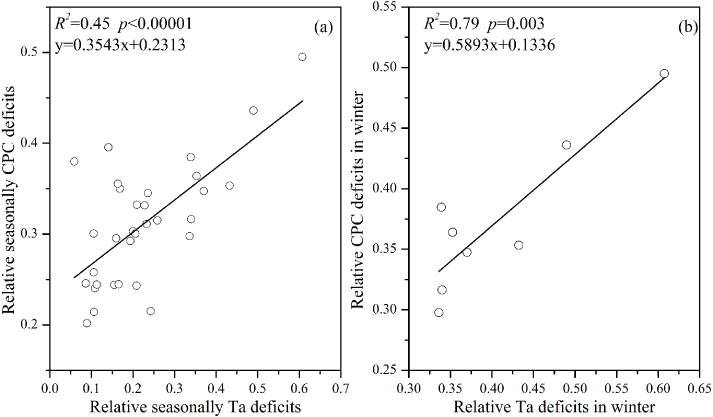
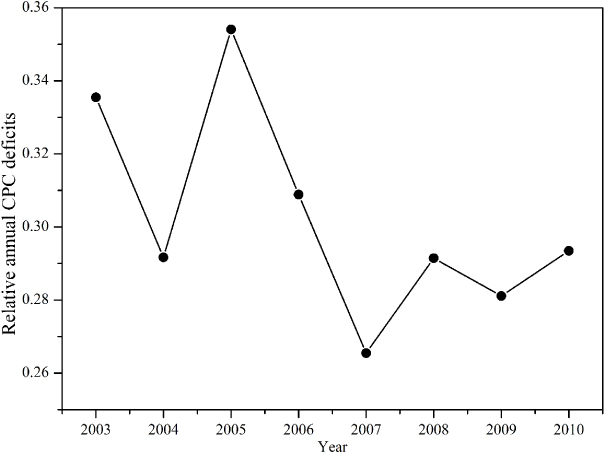
Increasing occurrences of climate extreme events urge us to study their impacts on terrestrial carbon sequestration. Ecosystem potential productivity deficits could characterize such impacts and display the ecosystem vulnerability and resilience to the extremes in climate change, whereas few studies have analyzed the yearly dynamics of forest potential productivity deficits. Based on a perfect-deficit approach, we used in situ eddy covariance flux data and meteorological observation data at Qianyanzhou station from 2003 to 2010 to explore the relationship between potential productivity and climate extremes, such as droughts in 2003 and 2007, ice rain in 2005, and an ice storm in 2008. We found (1) the monthly canopy photosynthetic capacity (CPC) deficits could be mainly explained by air temperature (Ta) deficits (R2 = 0.45, p < 0.000 01); (2) a significant correlation was noted between seasonal CPC deficits and co-current Ta deficits (R2 = 0.45, p < 0.000 01), especially in winter (R2 = 0.79, p = 0.003); (3) drought in summer exerted a negatively lagged effect on potential productivity (R2 = 0.59, p = 0.02), but at a short time scale; and (4) annual CPC deficits captured the impacts of climate extremes on the forest ecosystem potential productivity, and the two largest potential productivity deficits occurred in 2003 (relative CPC deficits = 0.34) and in 2005 (relative CPC deficits = 0.35), respectively. With the perfect-deficit approach, the forest ecosystem vulnerability to extremes was analyzed in a novel way.
Export citation and abstract BibTeX RIS

Content from this work may be used under the terms of the Creative Commons Attribution 3.0 licence. Any further distribution of this work must maintain attribution to the author(s) and the title of the work, journal citation and DOI.
1. Introduction
With China becoming the largest emitter of fossil fuel CO2 in the world (1.5 Pg C yr−1 in 2006) (Gregg et al 2008), there is a strong impetus to increase the terrestrial ecosystem carbon sink to mitigate greenhouse gas (GHG) emission in China. Forests play a significantly important role in the global carbon cycle, and it is necessary to get a clear understanding of carbon (C) sequestration of forests in the international GHG reduction negotiation (Pan et al 2011). According to the 7th National Forest Resource Inventory Report from the State Forestry Administration (www.forestry.gov.cn), forests cover ∼20.36% of China. And more than 65% of the carbon sink of China is located in southern China due to climate change, shrub recovery and large-scale afforestation programs since the 1980s (Fang et al 2001, Piao et al 2009, Wang et al 2011). Plantations are the major component of forest in southern China, occupying 54.3% of the total planted forest area and 52.6% of the stock volume of plantations in the whole of China (Sun et al 2006). In addition, the rapid increase in plantation area resulting from national afforestation programs contributes to about 10% of the terrestrial ecosystem carbon sink in China, which was estimated to mitigate 28–37% of its fuel carbon emission in the past two decades (Piao et al 2009, Xu et al 2012). The planted forests in southern China have an important effect on the pattern of the global carbon sink. Nevertheless, the planted forests can be vulnerable to ecosystem disturbance, such as deforestation, fire, extreme events, etc (Lugo 1997). Also these disturbances may turn the plantation ecosystem into a carbon source in certain years, thus the impact of disturbances on the carbon sink capacity of planted forests in southern China is of great concern.
The trend is that an increase in climatic extreme events will appear in the future (Easterling et al 2000). Also extreme climate events (e.g., heat waves, droughts, ice storms) have been observed in many areas, such as the USA, Europe and China (Zhao and Running 2010, Stone 2008, Gu et al 2008, Ciais et al 2005, Meehl and Tebaldi 2004). With observation data and the VEGAS model, the biological productivity across much of the Northern Hemisphere was found to decline by 0.9 Pg C yr−1, or 5%, compared to the average of the past twenty years due to a rare drought occurring from 1998 to 2002 (Zeng et al 2005). A 30% reduction in gross primary productivity over Europe due to the unprecedented drought in 2003 was estimated by the ORCHIDEE biosphere model and eddy covariance flux observation, which resulted in a strong anomalous net source of carbon dioxide (0.5 Pg C yr−1) (Ciais et al 2005). In particular, southern China has also suffered from ice storms, ice rain and drought in recent decades (Zhou et al 2011a, Pei et al 2013). The extent of damage to plantations in southern China caused by ice rain during the spring of 2008 varied among the tree species through two field transect surveys across Jiangxi province, in which slash pine suffered the most (Shao et al 2011). Ying et al (2012) found that a nonlinear relationship existed between the greenness rebound time and ice rain impact severity through enhanced vegetation index and ground visits, and 80% of the forests in southern China returned to normal status within one year after the ice rain. The spring drought occurring in southwestern China reduced regional annual gross primary productivity and net primary productivity in 2010 by 65 and 46 Tg C yr−1, respectively (Zhang et al 2012). The sustainability of forest carbon sinks is greatly influenced by the frequency and intensity of large extreme events (Frolking et al 2009, Turner and Dale 1998) and depends on how quickly the forests recover their capacity for photosynthesis (Amiro et al 2010, Ying et al 2012).
The subtropical coniferous plantation ecosystem at Qianyanzhou (QYZ) site in southern China experienced an extreme summer drought in 2003, a moderate drought in 2007 and two extreme freezing events in 2005 and 2008 (Wen et al 2010, Zhang et al 2011b), which provided a good opportunity to investigate the role extreme climate events play in the forest C sequestration. The forest ecosystem productivity at QYZ station in southern China showed seasonality, with low rates during the drought in 2003 (Wen et al 2010). The variation of net C uptake in this site could mainly be ascribed to extreme freezing early in the year (Zhang et al 2011a, 2011b). However, the relationship between extreme climatic events and forest ecosystem potential productivity is still unclear, and few studies have analyzed the dynamics of forest ecosystem potential productivity through eddy covariance observation data. Based on the canopy photosynthetic capacity derived from eddy covariance flux measurements, the ecosystem carbon assimilation potential was defined as the area under the canopy photosynthetic capacity (CPC) curve (Gu et al 2009). A significant correlation was seen between the potential productivity and extreme drought in the grassland ecosystem by a new perfect-deficit approach, which provided a reliable way to detect the impacts of extreme climate events on ecosystem productivity (Yi et al 2012).
In this study, we will apply the perfect-deficit approach to the eddy covariance flux data and meteorological data observed from 2003 to 2010 at QYZ site, and address the following questions. (1) What are the dynamics of the potential productivity in this coniferous plantation ecosystem? (2) How do the extreme freezing events influence its potential productivity? (3) What is the relationship between its ecosystem potential productivity and extreme summer drought?
2. Data and methodology
2.1. Site description
Qianyanzhou Ecological Experimental Station (QYZ, 26°44'29''N, 115°03'29''E, and elevation 102 m) is located in Jiangxi Province of southern China (humid climate zone), a part of the ChinaFLUX network, which was established in late August of 2002. The mean annual air temperature is 17.9 ° C, whereas the highest and lowest extreme temperatures are 39.5 ° C and −5.8 ° C, respectively (Wen et al 2006). During the investigated period, an extremely cold early growing season and freezing rain occurred in 2005 and 2008. Also, mean annual precipitation is 1542 mm, along with a dry period from July to August (Wang et al 2011). This coniferous forest was planted around 1985, with a tree density of about 1460 stems ha−1 and total biomass of 106 t ha−1. The prevailing species are slash pine (Pinus elliottii), Masson pine (Pinus massoniana) and Chinese fir (Cunninghamia lanceolata). This plantation is on gently undulating terrain with slopes between 2.8° and 13.5° (Wen et al 2006). The soil parent material consists of red sandstone and mud stone, and soils are mainly red earth, which is weathered from red sand rock (Wang et al 2004). In addition, an inconsistency of precipitation and temperature often results in a late summer drought (e.g. 2003) at QYZ station, southern China. Further details of the Qianyanzhou site are available in the literature (Wang et al 2011, Wen et al 2006, Yu et al 2008).
2.2. Flux and meteorological data
CO2 and H2O fluxes in this study were measured from 1 January 2003 to 31 December 2010 using the eddy covariance (EC) technique (Baldocchi et al 1988). The above-canopy flux was observed at a height of 39.6 m by an open-path eddy covariance system located on a ventilated tower. All original data were sampled at 10 Hz by a CR5000 datalogger (Model CR5000, Campbell) and then scaled to 30 min mean fluxes. Synchronous meteorological observation data include photosynthetically active radiation (PAR), air temperature, soil temperature, soil humidity, radiation and precipitation, which were sampled at 1 Hz, from which 30 min averages were calculated.
The flux of net ecosystem CO2 exchange (NEE, mg CO2 m−2 s−1) or evapotranspiration (ET, gH2O m−2 s−1) between the ecosystem and the atmosphere was calculated using equation (1), the net ecosystem productivity (NEP) was assigned as −NEE.

where the first term on right-hand side is the eddy flux for carbon dioxide or water vapor below the height of observation (zr), and all advective terms in the mass conservation equation were ignored.
The methods of flux calculation and correction for CO2 and water vapor in this study were consistent with those in Wen et al (2010). To avoid possible underestimation of fluxes under stable conditions during night, these observed NEE and ET values during night (solar elevation angle <0°) were excluded when the value of friction velocity (u*) was less than 0.19 ms−1, which was the maximum u* threshold in the years 2003–2010 at QYZ station. Further measures of spike detection and weak turbulence elimination followed the process of Wen et al (2006).
Missing values of NEP and ET resulting from equipment failure were inevitable in long-term measurements. The present study utilized the prevailing nonlinear regression method (Moffat et al 2007, Richardson and Hollinger 2007) to fill larger gaps (>2 h), while the small gaps (<2 h) were linearly interpolated. The daytime missing NEP values of large gaps were estimated by the Michaelis–Menten equation with a ten-day window:

where α is the ecosystem apparent quantum yield (mg CO2 μmol−1), Qp is the photosynthetic photon flux density (μmol m−2 s−1), Nes is the asymptotic gross ecosystem photosynthesis (GEP; mg CO2 m−2 s−1) at saturating light, and REday is the average value of daytime respiration (RE; mg CO2 m−2 s−1) (Zhang et al 2011b).
For the nighttime data, NEP was defined as the ecosystem respiration (REnight; mg CO2 m−2 s−1). The missing REnight values were filled by employing a function of soil temperature and soil water content with a yearly interval (Reichstein et al 2002, Wen et al 2010):

where REref,b1,b2 are the fitted parameters, REref is the RE rate (mg CO2 m−2 s−1) at reference temperature Tref (set as 15 ° C here), and Sw and Tsoil stand for soil water content (m3 m−3) at 5 cm depth and the soil temperature (° C) at 5 cm depth, respectively. To estimate gross ecosystem photosynthesis, the daytime ecosystem respiration (REday) was estimated by extrapolating the relationship function of nighttime respiration with soil temperature and soil water content.
Additionally, the missing ET data were linearly interpolated for small gaps (<2 h). For large gaps, the missing ET values were filled by mean diurnal variation methods in combination with a look-up table (Reichstein et al 2005).
2.3. Canopy photosynthetic capacity (CPC)
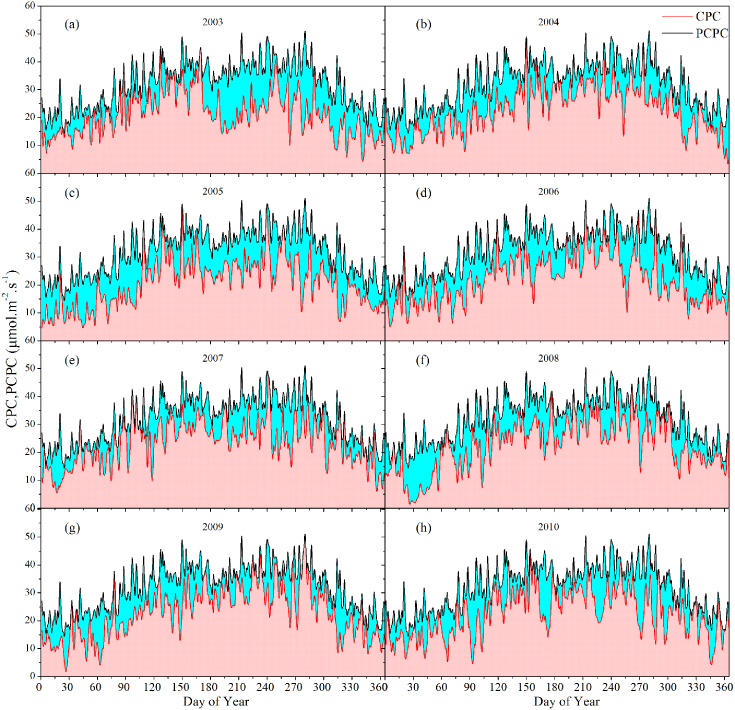
The canopy photosynthetic capacity (CPC) was defined as the daily maximum potential carbon storage capacity of an ecosystem (Yi et al 2012). For a specified year, the daily CPC of ecosystems observed by eddy flux towers was termed as the maximum GEP derived from half-hourly CO2 eddy covariance flux data (Gu et al 2009). The daily observation data comprised a yearly CPC curve smoothed with the algorithm in Yi et al (2012). This CPC curve formed an upper boundary line for the scatter plot of instantaneous canopy photosynthesis rate against time (red curve in figure 1). The area between the curve and the time axis (red area in figure 1) denoted the ecosystem's carbon assimilation potential in an individual year (Gu et al 2009).
Figure 1. Daily dynamics of CPC and CPC deficits at Qianyanzhou station from 2003 to 2010. Both the CPC curve (red line) and PCPC curve (black line) were algorithmically smoothed. The CPC deficits were the difference between the CPC and PCPC (blue area).
Download figure:
Standard image High-resolution image2.4. Perfect CPC and deficit CPC
A perfect CPC (PCPC) curve was defined as a measure of the maximum carbon assimilation for a site given 'perfect' climate conditions for a specified day of the year, over the years for which data were available (Yi et al 2012). The eddy covariance data of the present study at QYZ site ranged from 2003 to 2010 (>4 years), which was adequate to construct PCPC for a single site (Lauenroth and Sala 1992). The perfect CPC values were estimated for each day of the year as the maximum CPC recorded on that day across all the accessible years of flux data at each site. Similarly, a perfect CPC curve (black line in figure 1) which represented the maximized carbon assimilation potential could be constructed and smoothed with the same algorithm as the CPC. The CPC deficit (blue area in figure 1) was defined as the difference between the CPC and the perfect CPC on a particular day (Yi et al 2012). Apart from CPC deficits, the air temperature (Ta) deficits and net radiation (Rn) deficits were analyzed with this perfect-deficit approach.
We will focus on the relationship between deficits of the ecosystem potential productivity and deficits of the climate factors (maximum Ta and Rn), as the perfect-deficit method is capable of identifying extreme climate events and their impacts on ecosystem productivity (Yi et al 2012).
2.5. Water balance index
The daily precipitation data (P; mm) was observed near the flux tower simultaneously. The ratio of P to ET measured by the EC flux tower was adopted as a simple water balance index (P/ET; mm). In this analysis, a monthly water balance index (drought index) was used to illustrate the severity of summer droughts in the QYZ plantation ecosystem. Previous studies have shown that the QYZ plantation ecosystem suffered frequent summer drought caused by an inconsistent distribution of precipitation and temperature, generally with net water gains during the preseason (June) and net water losses during midseason (July) and postseason (August) (Wen et al 2010). Therefore, we will put an emphasis on the impacts of drought on CPC deficits in summer, which was indicated by this simple water balance index (P/ET) used in summer.
3. Results and discussion
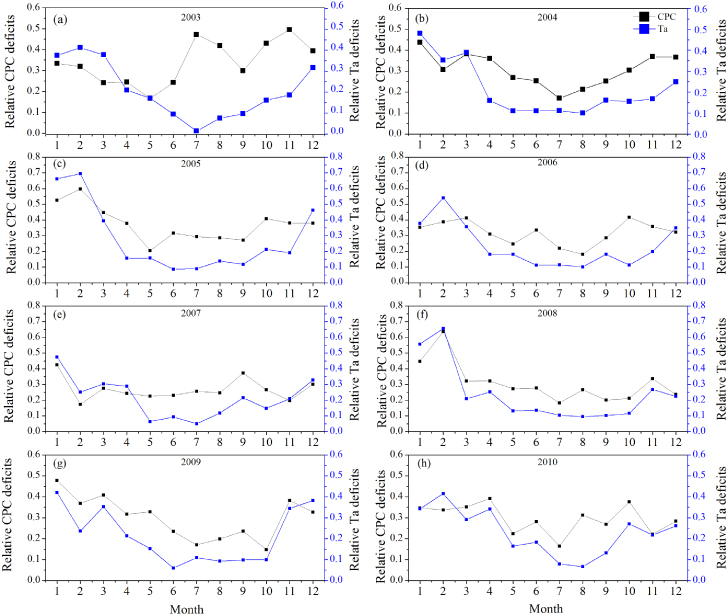
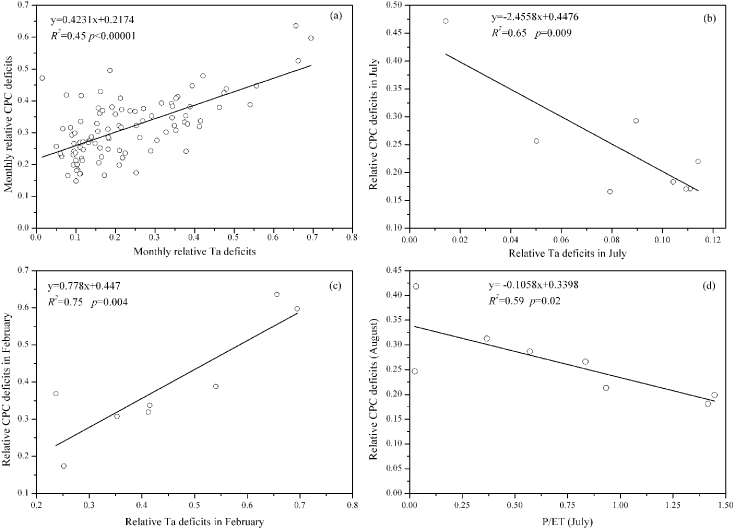
We found the CPC deficits of a subtropical coniferous plantation ecosystem at QYZ station were significant in relation to air temperature deficits (Ta deficits) rather than deficits of Rn. Figure 1 demonstrated that the distribution of CPC deficits (blue area) differed from one year to another and large CPC deficits existed in 2003 (drought year), 2005 and 2008 (both ice rain years), except for 2007 (moderate drought year). Meanwhile, the fact that no obvious fluctuations of summer CPC deficits were observed from 2006 to 2008 (blue line in figure 4(a)) also supported that conclusion. This might be explained by the fact that less rain in association with fewer clouds increased the available light duration and led to an increase of GEP (Wen et al 2010). Figure 2 showed the relative monthly CPC deficits almost consistently varied with the relative monthly Ta deficits. To a large extent, the relative CPC deficits increased with relative Ta deficits. Figure 3(b) showed that the relative CPC deficits were mostly negatively associated with relative Ta deficits in July (R2 = 0.65,p = 0.009). In contrast, figure 3(c) showed that the relative CPC deficits were positively associated with relative Ta deficits in February (especially for 2005 and 2008). This was partly because of the lack of water in July, whereas the extremely low air temperature (large Ta deficits) dominated the CPC deficits in February. The precipitation anomalies of July 2003 and July 2007 were −0.9611 and −0.9635, respectively, which were the two lowest precipitations in July among the 8 years. But the relative CPC deficits in July were not sensitive to the corresponding precipitation (R2 = 0.12,p = 0.2) and water balance index (p = 0.27). Meanwhile, subtropical ecosystems became more vulnerable to low temperature and freezing, whereas boreal and temperate plants adapted to the low temperature (Gu et al 2008, Teklemariam et al 2009, Zhang et al 2011b). As illustrated in figures 1(c), (f), 2(c) and (f), the largest relative Ta deficits (>0.65) and relative CPC deficits (>0.6) happened in February of 2005 and 2008. These reflected the moderate freezing (−2 ° C below average) in the winter of 2005 and the extreme freezing (−5 ° C below average) in the winter of 2008 caused by ice storms in southern China (Shao et al 2011, Zhou et al 2011a). Figure 3(a) showed that about 45% of the variation in relative monthly CPC deficits could be explained by relative monthly Ta deficits. This fact verified that the determiner of relative CPC deficits was air temperature at the monthly time scale all year round. The more air temperature deficits there were, the more CPC deficits we found at the monthly time scale.
Figure 2. Variation of relative monthly CPC deficits and relative monthly air temperature (Ta) deficits. CPC deficits monthly dynamics (black line) and Ta deficits monthly dynamics (blue line). Ta deficits were calculated by corresponding half-hourly meteorological data with the perfect-deficit approach. The relative deficits were the values of CPC and Ta deficits normalized by the total area of their perfect curve integrated over each month, respectively.
Download figure:
Standard image High-resolution imageFigure 3. (a) Relative monthly CPC deficits versus relative monthly Ta deficits; (b) relative monthly CPC deficits in July; (c) relative monthly CPC deficits in February versus relative monthly Ta deficits in February; (d) relative CPC deficits in August versus water balance index (P/ET) in July.
Download figure:
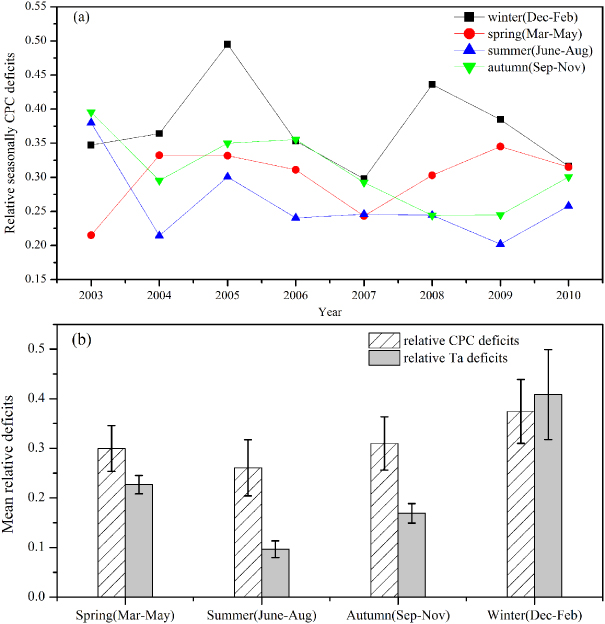
Standard image High-resolution imageFigure 4. Seasonal dynamics of: (a) relative CPC deficits at QYZ station from 2003 to 2010; (b) mean relative CPC and Ta deficits. Error bars denote the standard deviation of deficits in each season. The subtropical coniferous forest ecosystem at Qianyanzhou station was divided into four seasons: spring (March, April and May); summer (June, July and August); autumn (September, October and November); winter (December, January and February) in regard to episodic summer drought attributable to the Asian monsoon climate.
Download figure:
Standard image High-resolution imageMoreover, large CPC deficits were noted during the summer in 2003, which identified that extreme drought inhibited the forest ecosystem potential productivity. Figure 3(d) demonstrated that the drought in July influenced the CPC deficits in August significantly, which might be ascribed to a time-lag effect of drought. However, no significant relationships were found between relative monthly CPC deficits and the simultaneous water balance index during summer. Generally, precipitation at QYZ site decreased in July followed, to some extent, by an increment in August, while Ta reached the highest value in July (Wen et al 2010). Previous studies that a lagged response of plant growth to drought was observed in humid forests highlighted the point in figure 3(d) (Breda et al 2006, Vicente-Serrano et al 2013). Table 1 showed that the lagged effect of summer drought on CPC deficits only existed between drought stress in July and CPC deficits in August, which further confirmed the potential productivity response lag to drought was around one month. The summer could be divided into three parts: June (preseason), July (midseason) and August (postseason). Generally, precipitation at QYZ site decreased in July followed, to some extent, by an increment in August, while Ta reached the highest value in July (Wen et al 2010). Meanwhile, the soil water contents at different depths showed obviously declining trends during the midseason or postseason. The water balance index (P/ET) usually reached a minimum in July. That was in agreement with the lagged effect of drought shown in table 1. Despite the significantly negative influence of air temperature deficits on CPC deficits in summer, the trend of both two lines came back to positive correlation in latter months.
Table 1. The relationship between relative CPC deficits in a specific month and P/ET in previous months. In general, summer droughts lasted from June to August, and we will focus only on the monthly CPC deficits in those three months.
| P/ET | Relative monthly CPC deficits in summer | |||||
|---|---|---|---|---|---|---|
| June | July | August | ||||
| R2 | p | R2 | p | R2 | p | |
| Previous one month | 0.39 | 0.057 | 0.1 | 0.233 | 0.59 | 0.020 |
| Previous two months | 0.01 | 0.374 | 0.11 | 0.606 | 0.14 | 0.704 |
| Previous three months | 0.16 | 0.937 | 0.04 | 0.421 | 0.16 | 0.827 |
In addition, relative seasonal CPC deficits were found to some extent to be determined by relative seasonal Ta deficits (R2 = 0.45,p < 0.000 01). The variation trend of winter was sharper than the other three seasons in terms of relative CPC deficits from 2003 to 2010 (figure 4(a)). Also, figure 4(b) confirmed that the CPC deficits in winter were the largest among the four seasons (mean= 0.38), so was the variation magnitude (SD= 0.064). The trend of mean relative seasonal CPC deficits totally followed that of the mean relative seasonal Ta deficits. Specifically, figure 5(b) demonstrated that most of the variation of relative CPC in winter could be explained by the air temperature deficits (R2 = 0.79,p = 0.003). Also the significant correlation existing between CPC deficits and Ta deficits further confirmed that CPC deficits in winter were the most vulnerable to extreme low temperature and freezing (large Ta deficits). We found that CPC deficits in winter (black line in figure 4(a)) were almost largest among the four seasons in each year, especially in 2005 and 2008. Long-term extreme ice rain lasting for about 60 days in early 2005 made the daily Ta anomaly drop to −2 ° C at QYZ site (Zhang et al 2011b). Also southern and central China (including the QYZ site) suffered heavily from the 2008 Great Chinese Ice Storm from 10 January to 6 February in 2008 (Zhou et al 2011b). Both of these two extreme climate events were reflected as two sharp increases of winter CPC deficits (black line, figure 4(a)). Additionally, figure 5(a) showed that a 45% variation of relative seasonal CPC deficits could be explained by relative seasonal Ta deficits. Evidence showed the vegetation of humid biomes mostly responded at short drought time scales and recovered to its previous state in a short period, which was ascribed to the mechanisms affecting the resistance and resilience of vegetation to drought stress (Vicente-Serrano et al 2013). This fact implied it was possible that the constraint of the episodic summer drought on CPC deficits at QYZ site was restricted within summer itself due to rapid recovery of the forest ecosystem from the short time scale droughts. The positive correlation between CPC deficits in September and Ta deficits in September also verified that (R2 = 0.41,p = 0.041).
Figure 5. Relationship between relative seasonal CPC deficits and relative seasonal Ta deficits. (a) Relative deficits of all the 4 seasons; (b) relative deficits of winter.
Download figure:
Standard image High-resolution imageFigure 6 showed that the annual CPC deficits were high in 2005 and 2008. Generally, the trend was in agreement with the inhibition of extreme events against forest potential productivity, although there was a reduction of CPC deficits due to more available incoming solar radiation in 2007. The two largest potential productivity deficits occurred in 2003 (relative CPC deficits = 0.34) and in 2005 (relative CPC deficits = 0.35), respectively, which verified the effects of extreme drought in 2003 and extreme ice rain in 2005 on the potential productivities. But the annual CPC deficits were not significantly associated with annual Ta deficits (R2 = 0.16,p = 0.3). This was partly because the forest ecosystem was more complex and of greater diversity than grassland ecosystems typically stressed by water availability. The perfect CPC denoted the essential characteristics of the local system, and the increase in CPC deficits reflected the impacts of the disturbance and climate change (i.e., extreme climate events) on the potential productivity of the local ecosystem (Yi et al 2012). The forest system was more capable of adjusting itself to the extreme climate disturbance and recovery from it, so that the CPC deficits were not determined by a single occasional extreme event (i.e., low temperature in early year) at an annual time scale.
Figure 6. Annual dynamics of relative CPC deficits at QYZ site.
Download figure:
Standard image High-resolution image4. Conclusion
This study explored the response of subtropical coniferous forest ecosystem potential productivity to climate extreme events occurring in southern China with in situ EC flux observation during 8 years (2003–2010). The annual forest ecosystem potential productivity was significantly reduced by extreme drought and ice rain. In particular, the plantation potential productivity in winter was most severely reduced by the extreme freeze events. Also, our analysis indicated the lag time of ecosystem potential productivity response to drought was approximately one month. Nevertheless, with the increase in frequency and intensity of extreme climatic events (Easterling et al 2000, Meehl and Tebaldi 2004, Min et al 2011), the planted forest ecosystems which play an important role in terrestrial carbon sink will possibly become more vulnerable to extreme events and act as a net carbon source. Uncertainties resulting from the forest ecosystem seasonality and complexity existed in the feedback between the potential productivity and extreme climate. Furthermore, eddy covariance flux observation in collaboration with remote sensing and ground field surveys are highly desired in any future research.
Acknowledgments
This study was supported by the National Natural Science Foundation of China (Grant No. 31070438), the National Basic Research Program of China (973 Program) (Grant No. 2010CB833503) and the CAS for Strategic Priority Research Program (Grant No. XDA05050602).


