
Abstract
The focus of land-use related efforts in developing countries to reduce carbon emissions has been on slowing deforestation, yet international agreements are to reduce emissions from both deforestation and forest degradation (REDD). The second 'D' is poorly understood and accounted for a number of technical and policy reasons. Here we introduce a complete accounting method for estimating emission factors from selective timber harvesting, a substantial form of forest degradation in many tropical developing countries. The method accounts separately for emissions from the extracted log, from incidental damage to the surrounding forest, and from logging infrastructure, and emissions are expressed as units of carbon per cubic meter of timber extracted to allow for simple application to timber harvesting statistics. We applied the method in six tropical countries (Belize, Bolivia, Brazil, Guyana, Indonesia, and Republic of Congo), resulting in total emission factors of 0.99â2.33 Mg C mâ3. In all cases, emissions were dominated by damage to surrounding vegetation and the infrastructure rather than the logs themselves, and total emissions represented about 3â15% of the biomass carbon stocks of the associated unlogged forests. We then combined the emission factors with country level logging statistics for nine key timber producing countries represented by our study areas to gain an understanding of the order of magnitude of emissions from degradation compared to those recently reported for deforestation in the same countries. For the nine countries included, emissions from logging were on average equivalent to about 12% of those from deforestation. For those nine countries with relatively low emissions from deforestation, emissions from logging were equivalent to half or more of those from deforestation, whereas for those countries with the highest emissions from deforestation, emissions from logging were equivalent to <10% of those from deforestation. Understanding how to account emissions and the magnitude of each emissions source resulting from tropical timber harvesting practices helps identify where there are opportunities to reduce emissions from the second 'D' in REDD.
Export citation and abstract BibTeX RIS

Content from this work may be used under the terms of the Creative Commons Attribution 3.0 licence. Any further distribution of this work must maintain attribution to the author(s) and the title of the work, journal citation and DOI.
1. Introduction
The international community has come to accept that confronting global climate change cannot succeed without considering actions that reduce carbon emissions from deforestation and forest degradation (Stern 2007, UNFCCC 2007). Now known as REDD+Â (reducing emissions from deforestation and forest degradation in developing countries; and the role of conservation, sustainable management of forests and enhancement of forest carbon stocks in developing countries), the topic has been the subject of intense negotiations since 2005 at COP 11 (the 11th Conference of the Parties to the United Nations Framework on Climate Change).
To date, the main focus has been on the first 'D', deforestation, in terms of emissions quantification (Achard et al 2002, DeFries et al 2002, 2007, Baccini et al 2012, Harris et al 2012) and the kinds of policies and programs that could be put in place to reduce these emissions (Meridian Institute 2009). Emissions related to the second 'D', representing those from forest degradation, are poorly quantified. Many studies have examined selective logging in tropical forests, but these have focused largely on the extent of damage to the residual stand (e.g. Uhl and Vieira 1989, Uhl et al 1991, Verissimo et al 1992, White 1994). The studies of Pinard and Putz (1996), Feldpausch et al (2005) and Medjibe et al (2011) detailed the carbon impact of timber harvesting but did not include all emissions source. Selective logging as a source of forest degradation should not be ignored, however, as in the Brazilian Amazon alone, Asner et al (2005) estimated that emissions caused by selective logging were equivalent to between 60 and 123% of previously reported deforestation emissions.
In tropical humid forests, selectively harvesting trees for timber and/or fuelwood can degrade the forest because the loss in live biomass resulting from harvesting practices often exceeds biomass accumulation by regrowth over many years. The loss of live biomass is due to the immediate damage that occurs by felling the selected trees, the incidental damage to surrounding trees caused by the felled trees, and the infrastructure built for removing the logs out of the forest. For commercial timber operations, infrastructure can be extensive and is composed of skidding trails (caused by use of bulldozers or other equipment to transport the logs from the felling area to roads), logging decks or landings (areas where the logs skidded out from the forest are piled awaiting transport) and logging roads (used by motor vehicles to transport the logs out of the forest).
Although techniques are being developed for detecting the extent of forest degradation, little has been done to estimate associated carbon emissions from degrading activities. The basic method recommended by the Intergovernmental Panel on Climate Change (IPCC 2006) is to derive the product of activity data (e.g. areal extent of loss in forest cover in ha yrâ1) and the emission factor (e.g. change in carbon stock as a result of the activity, as Mg C haâ1). For deforestation, activity data can be readily obtained from the use of remote sensing imagery (GOFC-GOLD 2013) and the methods for this are well established and commonly used for many parts of the tropical world (e.g. Achard et al 2002, DeFries et al 2007, Hansen et al 2010). For estimating emission factors for deforestation, field data collection and analyses are based on well-established methodologies (Brown 1997, Pearson et al 2005, 2007, GOFC-GOLD 2013).
The IPCC (2006) guidance for estimating emissions and removals for forest degradation is covered in the section referred to as 'Forests Remaining as Forests', and although similar to that for deforestation, obtaining the activity data and estimating the emission factors is not so straightforward. The goals of our work were therefore to: (1) develop a new and complete methodology to estimate carbon emissions resulting from selective timber harvesting operations in tropical forests, (2) demonstrate the application of the methodology by producing emission factors for example logging operations in several key tropical timber producing countries, and (3) determine the relative significance of each emission source from the logging operations in relation to total emissions. We then use the results from our analysis to produce a first order estimate of the magnitude of emissions from degradation due to logging versus those from deforestation for key timber producing countries represented by our study sites. The methodology is designed to provide emission factors for all emissions sources as a function of the unit of timber production as recommended by the IPCC (2006).
2. Methods
2.1. Carbon accounting methodology
The methodology that we present here for estimating emissions caused by selective logging practices in tropical forests was originally conceived for one of the earliest forest-based carbon offset projectsâthe Noel Kempff Climate Action project (Brown et al 2000). We used the IPCC gainâloss approach that focuses on the direct losses in live biomass caused by the felled trees, incidental damage to other trees caused by the felling, and related logging infrastructure, and the gains from regrowth in and around the gaps caused by the felled and damaged trees and infrastructure (figure 1). In this sense, it is more appropriate to estimate the change in live and dead biomass pools due to logging impacts directly in the harvested areas as opposed to estimating the difference in the carbon stocks of the pre- and post-logged forest.
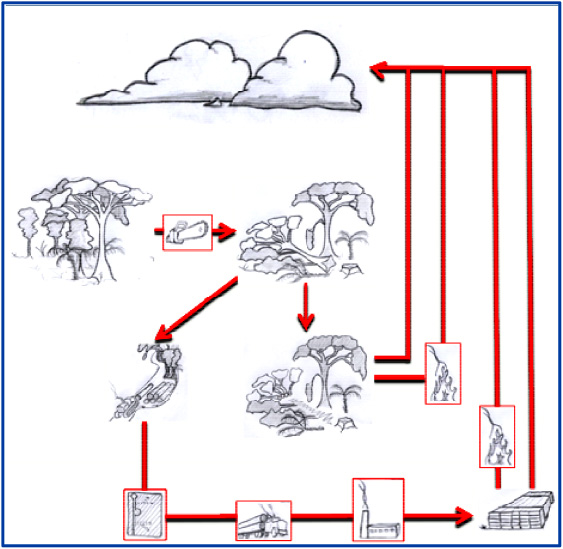
Figure 1. Illustration of the carbon cycle within tropical timber harvest. During felling surrounding trees are incidentally damaged and killed, this dead material plus the top, stump and roots of the felled tree decompose through time and return to the atmosphere. The log is extracted from the forest and converted into wood products. Waste during conversion and retired products return to the atmosphere either through burning or through decomposition.
Download figure:
Standard image High-resolution imageThe total emission factor from selective logging is estimated as the sum of three factors: (1) emissions relative to extracted volume; (2) damaged biomass in the process of logging; and (3) damaged biomass resulting from infrastructure necessary for logging:

where TEF is the total emission factor resulting from timber harvest (Mg C mâ3), ELE is the extracted log emissions (Mg C mâ3 extracted), LDF is the logging damage factorâdead biomass carbon left behind in gap from felled tree and incidental damage (Mg C mâ3 extracted), LIF is the logging infrastructure factorâdead biomass carbon caused by construction of infrastructure (Mg C mâ3).
We did not include carbon emissions from soil as selective logging has been shown to have no impact on soil carbon over large concessions because of the relatively small area impacted, the short duration of impact and the retention of vegetative cover (Johnson and Curtis 2001). And although we do recognize that there will be carbon emissions from the construction of the unpaved logging roads, these emissions are not included in our analysis.
Extracted log emissions (ELE). Extracted log emissions are equal to the emissions resulting from conversion of the log to wood products and the subsequent emissions from retired wood products. Emissions can be estimated to occur fully at time of harvest (committed emissions) or they can be estimated for specific years after harvest to account for emissions that happen over a prolonged period (well over 100 years for some products as timber is stored in long-lived wood products and in landfills, e.g. IPCC 2006). Here we focus on committed emissions to simplify the carbon accounting process, and also adopt the simplifying IPCC Tier 1 assumption that all extracted carbon is emitted at the time of the event. In application for REDD+ accounting, it is possible that annual emission accounting rather than committed emissions would be required.
Logging damage factor (LDF). The logging damage factor reflects the emissions that occur at the location (gap) where the specific tree(s) are felled caused by the decomposition of all the dead wood produced as a result of felling the tree(s). This represents the carbon in the aboveground and belowground biomass of the stump and top of the timber tree felled and left as dead wood in the forest, trees incidentally killed or severely damaged (i.e. uprooted or snapped), and large branches broken off from surviving trees during tree felling.
The dead wood stocks in the logging gap are equal to the total biomass of the felled tree minus the biomass of the extracted log, plus the biomass of trees incidentally uprooted or snapped (i.e. killed), and the biomass of any broken branches from surviving trees during tree felling. This is expressed on the per extracted timber volume and averaged over all sampled gaps:
where DW is the dead wood carbon stock (Mg C mâ3), f(dbh) is the allometric function for calculation of tree biomass based on diameter at breast height (dbh) and species specific wood density (Mg biomass), GAPVol is the volume of timber over bark extracted in gap G (m3 gapâ1), WD is the wood density of felled trees (Mg mâ3), CF is the Carbon fraction (0.47 Mg dry mass), BI is the biomass of incidentally killed/damaged trees (Mg C gapâ1), Number of Gaps is the the total number of gaps inventoried.
Logging infrastructure factor (LIF). Logging infrastructure emissions include emissions resulting from the creation of logging roads, skid trails and logging decks. Under some accounting schemes, roads and decks will be counted as deforestation because they will show up in moderate resolution imagery analysis (e.g. Landsat), and their emissions can be addressed through stock-difference approach (e.g. area of change multiplied by emission factor derived from C stocks of unlogged forest); however the direct correlation with logging makes it logical to include all sources of emissions under timber management.
Infrastructure emissions are considered to occur at time zero (i.e. committed emissions):

where LIF is the logging infrastructure factorâdead biomass carbon caused by construction of infrastructure (Mg C mâ3), RF is the road factorâemissions per km of road construction (Mg C kmâ1), RL is the road length (km), DF is the decks factorâemissions per deck constructed (Mg C deckâ1), #D is the number of decks, SF is the skid trail factorâemissions per km of trail (Mg C kmâ1), SL is the skid length (km), TotSampleVol is the total extracted volume across the area sampled for infrastructure (m3).
Where road and deck areas are obtained from interpretation of remote sensing imagery then areas are used directly rather than length resulting in the RL being in hectares and the RF in Mg C haâ1. In such a case, roads and decks are combined.
2.2. Field data collection
Data were collected in 13 commercially operated forest concession areas within the tropical moist climate zone of six countries (five concessions in Indonesia, four in Guyana, and one in each of the other four countries). These were selected to cover a wide range of extraction rates, logging practices, and forest carbon stocks in aboveground and belowground biomass (table 1). The dominance of specific timber species differed among sites (supplemental information available at stacks.iop.org/ERL/9/034017/mmedia). In some sites, aerial imagery and/or high resolution satellite imagery was used to supplement field measurements.
Table 1. Key characteristics of the concessions areas in six countries used for estimating total emissions from selective logging.
| Site name | Province | Year sampled | Number of gaps & trees sampled | Extraction rate (m3Â haâ1) |
|---|---|---|---|---|
| RO Congo | Sangha | 2004 | 99 & 120 | 9 |
| Indonesia | East Kalimantan | 2006 and 2009 | 413 & 481 | 34 |
| Belize | Orange Walk | 2001 | 47 & 66 | 2 |
| Bolivia | Santa Cruz | 1999 | 97 & 108 | <5 |
| Brazil | Para | 2005 | 105 &123 | 5 |
| Guyana | Upper Demerara/Berbice | 2010â2012 | 183 & 203 | 13 |
aAverage rate across the five concessions (range of 26â38Â m3Â haâ1).
Measurements for assessing the carbon impacts in the logging gaps (volume of felled timber tree, biomass from crown and stump left in the forest, and incidentally killed trees and broken branches due to timber-tree felling), were made across all sites. Logging infrastructure measurements occurred in the Republic of Congo (ROC), Indonesia, and Guyana, with methods varying slightly across sites because this component of the methodology has evolved through time. Aerial imagery and/or high resolution satellite imagery were used to supplement field measurements in these three countries. Detailed information on the field measurements and conversion of field measurements into estimates needed for application of the carbon accounting equations given above are presented in the supplemental material (available at stacks.iop.org/ERL/9/034017/mmedia).
3. Results
3.1. Field measurements
A total of 944 logging gaps were examined across the concessions in the six countries including 1101 harvested trees (table 1). In all sites more than 75% of the gaps were formed by a single felled tree with this proportion as high as 90% in Bolivia. The largest trees harvested in terms of DBH and extracted volume were on average in ROC, followed by Indonesia, Brazil, Guyana, Bolivia, and Belize (table 2). The longest logs were in Indonesia and ROC (â¥22 m long) and these two countries also had the highest proportion of total tree biomass extracted in logs (>40%).
Table 2. Estimates of the mean gap related metrics (with 90% CI) and the resulting extracted log emissions (ELE) factor. The number of gaps measured at each of the six areas is given in table 1.
| Country | Mean DBH (cm) | Mean log length (m) | Mean gap area (m2) | Volume extracted per gap (m3) | Biomass extracted per gap (Mg C) | ELE (Mg C mâ3) |
Percent of felled tree extracted |
|---|---|---|---|---|---|---|---|
| RO Congo | 123 (3) | 22 (1) | 719 (85) | 25.1 (2.4) | 6.4 (0.6) | 0.25 | 43 (1) |
| Indonesia | 103 (3) | 22 (1) | 309 (29) | 17.3 (1.5) | 4.7 (0.4) | 0.25 | 47 (0) |
| Belize | 63 (3) | 10 (1) | n/m | 3.7 (0.9) | 1.0 (0.3) | 0.28 | 25 (2) |
| Bolivia | 69 (2) | 11 (1) | n/m | 4.5 (0.5) | 1.3 (0.2) | 0.30 | 28 (2) |
| Brazil | 86 (3) | 20 (1) | 340 (40) | 10.7 (1.1) | 4.0 (0.4) | 0.38 | 43 (2) |
| Guyana | 54 (2) | 16 (0.4) | 111 (15) | 3.5 (0.3) | 1.3 (0.1) | 0.36 | 44 (2) |
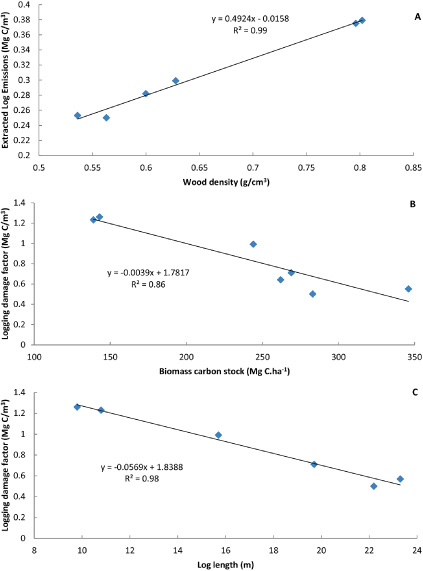
The area of gaps was highly variable among sites with the largest gaps formed in the felling of trees in ROC and Indonesia where the average felled tree was also the largest (table 2). Expressing the gap area on a per unit of timber extracted results in values of more than 28 m2 mâ3 for ROC, Brazil, and Guyana, but only 18 m2 mâ3 for Indonesia. Volumes extracted per gap ranged from 25 m3 (ROC) to just 3.7 m3 (Belize) giving extracted biomasses of 6.4 Mg (ROC) to 1.0 Mg (Belize) (table 2). Extracted log emission factors (ELE) were highly correlated with the mean wood density of the harvested trees (figure 2(A)).
Figure 2. Predictive correlations in the data between: (A) wood density and extracted log emissions (ELE); (B) forest carbon stock and logging damage factor (LDF); (C) mean log length and logging damage factor (LDF).
Download figure:
Standard image High-resolution image
The mean total damaged biomass in the logging gaps varied by a four-fold factor between the lowest damage in Guyana to the highest in ROC (table 3). The biomass carbon in the roots, stump and tree top of the felled tree accounted for between 55 and 84% of the total damaged biomass recorded in the gaps by site. The logging damage factors (LDF) ranged from 0.50 to 1.26 Mg mâ3, and are negatively related to the biomass carbon stock (figure 2(B)) and to the mean total length of the extracted logs (figure 2(C)).
Table 3. Estimates of the mean (with 90% CI) amount of damage and dead biomass produced per gap and the resulting logging damage factor (LDF). The number of gaps measured at each of the six concession areas is given in table 1.
| Â | Top, stump, and root biomass per gap | Incidental damage biomass per gap | Total damage per gap | LDF |
|---|---|---|---|---|
| Country | (Mg C) | (Mg C mâ3) | ||
| RO Congo | 8.6 (0.9) | 3.9 (0.6) | 12.4 (1.3) | 0.50 (0.04) |
| Indonesia | 7.8 (1.0) | 1.7 (0.2) | 9.5 (1.0) | 0.57 (0.03) |
| Belize | 3.3 (0.8) | 0.9 (0.2) | 4.2 (0.9) | 1.26 (0.14) |
| Bolivia | 3.5 (0.4) | 1.7 (0.4) | 5.2 (0.7) | 1.23 (0.08) |
| Brazil | 5.3 (0.5) | 1.4 (0.2) | 6.7 (0.6) | 0.71 (0.05) |
| Guyana | 1.8 (0.2) | 1.5 (0.2) | 3.3 (0.3) | 0.99 (0.08) |
Logging infrastructure factors for the three countries varied by almost a four-fold factor between the lowest and highest value (table 4). In all cases roads and decks dominated total infrastructure emissions representing 96% of emissions in ROC, 70% in Indonesia and 83% in Guyana. Emissions from skid trails differed markedly, however, with the skids representing just 4% of the LIF in ROC but 17% in Guyana and 30% in Indonesia.
Table 4. Mean estimates (and 90% CI where relevant) for each parameter used to estimate the logging infrastructure factor (LIF) for three of the concession areas for which we had the relevant data.
| Country | Skid trail factor (Mg C mâ3) | Deck factor (Mg C mâ3) | Road factor (Mg C mâ3) | LIF (Mg C mâ3) |
|---|---|---|---|---|
| RO Congo | 0.01 (0.00) | Included with roads | 0.23 (0.04) | 0.24 |
| Indonesia | 0.20 | 0.02 | 0.45 | 0.67 |
| Guyana |
0.17 | Included with roads | 0.81 | 0.98 |
aData are the national 5Â yr average for the period 2006â2011 for length of skid trails and area of roads.
3.2. Logging emission factors
Of the three sites for which we have complete data, the total emission factor (TEF) varied by a more than two-fold factor, with the lowest for ROC and highest for Guyana (table 5). The committed emissions from the logging gaps per cubic meter extracted (ELE plus LDF) accounted for 76% of the TEF for ROC and 55â58% of TEF for Indonesia and Guyana.
Table 5. Summary of all logging emission factors and the total emission factor (TEF), all in units of Mg C mâ3, for each of the six concession areas.
| Country | ELE | LDF | ELEÂ +Â LDF | LIF | TEF |
|---|---|---|---|---|---|
| RO Congo | 0.25 | 0.50 | 0.75 | 0.24 | 0.99 |
| Indonesia | 0.25 | 0.57 | 0.82 | 0.67 | 1.49 |
| Belize | 0.28 | 1.26 | 1.54 | NA | NA |
| Bolivia | 0.30 | 1.23 | 1.53 | NA | NA |
| Brazil | 0.38 | 0.71 | 1.09 | NA | NA |
| Guyana | 0.36 | 0.99 | 1.35 | 0.98 | 2.33 |
The emissions associated with the extracted logs were consistently the smallest proportion of the total emissions (even without considering sequestration in wood products) representing between 15 and 25%. The emissions associated with logging damage (LDF) varied more widely and were governed by the amount of dead wood produced during timber harvest, itself dominated by the top and stump of the timber tree. The logging damage emissions were a significant proportion of the total logging emissions, accounting for between 38 and 51%. The infrastructure emissions (LIF) varied widely depending upon the width and length of logging roads and decks mainly, but also on the density of skid trails and type of skidding machinery used. In Indonesia and Guyana, where bulldozed skid trails are combined with wide roads, most emissions are caused by construction of infrastructure.
3.3. Carbon emissions from tropical timber harvesting
To determine the relative significance of each emission source from logging operations across the study sites (excluded Belize where we had no means of estimating infrastructure emissions with confidence), we have combined the emission factors on a per cubic meter of timber extraction with the extraction rates (table 6). Despite the often perceived notion that logging in tropical forests is very damaging, the proportion of the above and below ground biomass carbon of the unlogged forest that is emitted from all logging sources represents only about 15% for the highest intensity of logging sites in Indonesia and as little as 3% for Brazil and ROC (table 6). These emissions will be offset to some degree depending on the rate of regrowth during recoverâthis is discussed further in the next section.
Table 6. Gross carbon emissions from logging (ELE = extracted log emissions, LDF = logging damage factor, LIF = logging infrastructure factor) compared to the carbon stock, both normalized to a hectare of forest for five key timber producing areas (excludes Belize where no estimation of infrastructure emissions were possible). The emissions were estimated as the product of the extraction rate and each emission factor.
| Country | Timber extraction rate (m3 haâ1) | ELE (Mg C haâ1 harvestâ1) | LDF (Mg C haâ1 harvestâ1) | LIF (Mg C haâ1 harvestâ1) | Total logging emissions per harvest (Mg C haâ1) | Forest carbon stock (Mg C haâ1) |
|---|---|---|---|---|---|---|
| RO Congo | 9 | 2.3 | 4.5 | 2.2 | 8.9 | 283 |
| Indonesia | 34 | 8.5 | 19.4 | 22.8 | 50.7 | 332 |
| Bolivia | 5 | 1.5 | 6.2 | 1.4 |
9.0 | 139 |
| Brazil | 5 | 1.9 | 3.6 | 1.4 |
6.8 | 269 |
| Guyana | 13 | 4.7 | 12.9 | 12.7 | 30.3 | 244 |
aWe used the LIF of 0.27 Mg mâ3 estimated from data in Feldpausch et al (2005) for Bolivia and Brazil.
4. Discussion
4.1. Comparison with other studies
Very few comparable results exist because timber harvesting and associated emissions have not been considered in this context of tackling emissions per unit of production. Many studies exist detailing the relative coverage of roads, decks and skid trails (e.g. Jackson et al 2002, Iskandar et al 2006), number of trees or areas disturbed by timber harvest (e.g. Verissimo et al 1992, Uhl et al 1991, Holmes et al 2002, Schulze and Zweede 2006, White 1994, Pereira et al 2002) and even carbon stock changes associated with timber harvest (e.g. Medjibe et al 2011, Pinard and Putz 1996, Feldpausch et al 2005). However, to our knowledge no published literature systematically developed emission factors for timber harvest, but we were able to estimate the relevant emission factors from data presented in Feldpausch et al (2005) and Pinard and Putz (1996).
In the Feldpausch et al study in the Brazilian Amazon, the mean DBH of the harvested trees was 75 cm, a mean wood density of 0.69 g cmâ3 and 6.2 m3 haâ1 were extracted. We estimated the logging damage factor to be 0.84 Mg C mâ3, the extracted log emission 0.36 Mg C mâ3 and the logging infrastructure factor 0.27 Mg C mâ3, for a total emission factor of 1.5 Mg C mâ3. The estimated LDF is about 20% higher than our result for Brazil; the ELE is within 10% of our estimate for Brazil and identical to the estimate for Guyana; and the LIF was very close to our estimate for ROC and significantly lower than those we obtained for Guyana and Indonesia. Fifty-three percent of infrastructure emissions in the Feldpausch et al study were from roads compared to 67% and 83% for Indonesia and Guyana, respectively.
In the Pinard and Putz (1996) study of conventional logging in Sabah, Malaysia, the mean extraction was 154 m3 haâ1 and the minimum harvest DBH was 60 cm in a forest with a mean stock of 200 Mg C haâ1. We estimated their ELE to be 0.21 Mg C mâ3, and the LDF to be 0.46 Mg C mâ3; insufficient data were available for estimating the LIF. These two factors from the Pinard and Putz study are comparable to those we obtained for Indonesia despite the extremely high extraction rate per ha.
4.2. Consideration of factors affecting the net emissions profile through time
The method and factors presented here assume, like the IPCC Tier 1 method, that all emissions associated with the conversion of live to dead biomass occur in the year of the event, and thus are considered committed. In reality, however, more research is needed to understand the trajectory of carbon pathways through time and how these aspects are best addressed in an accounting framework to develop more detailed logging emission factors. The IPCC (2006) requires annual reporting by developed countries, but whether annual reporting will be required for REDD+Â reporting is unclear at present. If reporting annually rather than reporting as committed emissions will be required, several challenges will need to be overcome, such as: robust decomposition rates for lying deadwood created from felling of timber trees, decomposition rate for roots, and retirement rate of wood products for estimating long-term wood product carbon storage.
First, research shows that dead wood decomposes relatively slowly in tropical forests, although its rate of decomposition through time is very poorly known (Brown 1987, Delaney et al 1998). Most of the logging slash of tropical species is large in size, composed of the tree top and large branches, and generally low in nutrients and high in secondary compounds (Brown 1987). For a tropical moist climate typical of our study sites, the half-life of dead wood has been shown to range from 1 to 69 yr (Delaney et al 1998, Chambers et al 2000), with slower rates generally associated with larger diameter tree boles and branches. Given the high variability in rates of wood decomposition and the highly variable sizes of the dead wood in logging gaps (from twigs to large diameter boles), accounting for all emissions from dead wood as committed emissions would be a consistent and comparable approach for national level accounting.
Second, the delayed mortality of trees impacted by harvesting practices also has a time component that is not considered in our analysis. Our method considers that all trees snapped or uprooted are killed and, even if they do survive, they still contribute to emissions from the dead wood produced. However, there will be additional trees that are merely scraped or leaning that may subsequently die, and there are suggestions that this quantity is significant. The re-measurement of about 100 paired plots (one plot around a logging gap and the other same size plot in an adjacent unlogged area) four years after initial logging at our site in Bolivia showed that 28% of trees recorded as leaning after timber harvest were dead. Pinard and Putz (1996) re-measured their plots 8â12 months after timber harvest and found that for trees with 'other damage' resulting from logging (i.e. neither snapped nor uprooted), 8â10% had died. Thus our focus on just snapped and uprooted incidentally damaged trees will underestimate total mortality and thus emissions resulting from logging.
Third, we assume that all felled trees are extracted, while in reality trees could be felled and then not extracted for a variety of reasons (e.g. too damaged, hollow, misidentified, could not re-locate to skid out). In this situation the ELE factor would be zero but the total dead wood created (LDF) would include the biomass of the whole tree. Where this practice is common and not monitored (e.g. such trees can be difficult to locate if no skid trail is present), the method described here will underestimate the total emissions associated with timber harvesting.
Fourth, on the carbon gain side of the equation, carbon will accumulate in and around the gaps in existing trees and in new trees that in-grow after logging activities, and we do not account for this potential stimulation in carbon sequestration rates. Carbon storage of old-growth forests across tropical forests in Amazonia and Africa has been shown to occur (Phillips et al 2008, Lewis et al 2009), and we refer to this growth as the background rate of carbon accumulation. In contrast, we refer to the carbon accumulation that occurs only in the gaps caused by logging as the human-induced potential carbon accumulation rate. The opening of the canopy with associated light penetration and decreased competition for water and nutrients could lead to higher sequestration rates in these areas than would occur in the absence of harvest, and this is the quantity of interest for estimating the potential net gain of carbon from logging. In the gaps, large trees are felled and removed. Although the radial increment of the remaining trees may increase, the biomass carbon increment of many smaller trees will often be lower than the biomass increment of the single missing large trees. Thus the loss of a large timber tree with large canopy area could actually lead to a net reduction in absolute carbon sequestration rate.
Studies have shown that the recovery of a logged stand to conditions similar to the pre-logged forest can take 150 years or more (Meijer 1970, Riswan et al 1986) suggesting that growth cannot be greatly elevated. Kartawinata et al (2001) suggested that logging can affect natural drainage leading to flooding and ongoing tree mortality and/or climbers can invade bare ground and overgrow regenerating and residual trees suppressing growth. Silva et al (1995) in Brazil showed that logging did stimulate growth in the residual stand but that this effect only lasted 3 years with subsequent rates similar to unlogged forest. A similar trend was found for logged plots in our Bolivia study site, where we measured the rates of carbon accumulation in the 100 paired plots and found that there was no difference in the rates between the two sets of plots (unpublished data). Pinard and Cropper (2000) in Sabah, Malaysia showed that when 20â50% of the stand was killed during logging, subsequent replacement with pioneer species reduced a site's potential for carbon storage by 15â28% over 60 years. Thus it is likely that in many cases timber harvesting leads to minimal elevation in sequestration rates, and that regrowth will occur but likely it will take many decades for the forest to reach the carbon stocks of the pre-logged forest, and longer than the typical 30 year re-entry time used in the management of many tropical humid forests. It is likely therefore that managed forests with relatively high extraction rates such as those in Indonesia and Malaysia will not recover to their former unlogged state before they are logged again and thus the carbon stock will gradually decline over repeated cycles. Further detailed studies on a chronosequence of previously logged areas could determine whether or not a positive regrowth factor exists.
Finally, within our accounting methodology, all harvested wood is assumed to be emitted immediately (i.e., within the ELE factor), and thus we do not allow for the potentially significant proportions that are stored long term or even permanently sequestered in products or in landfills. During the processing of harvested logs into wood products, a portion of the log is converted to waste (e.g. sawdust and offcuts) and emitted immediately to the atmosphere, and another portion converted to long-lived products that represent a carbon sink (Winjum et al 1998). For tropical developing countries, Winjum et al (1998) estimated that on average 45% of harvested logs end up as waste and short-lived (<5 yr life) products and are essentially emitted to the atmosphere at the time of the event. The remaining wood is processed into a variety of products. Carbon is sequestered in these products over different time periods, with some fraction sequestered permanently in, e.g., a piece of furniture or a landfill, or because its sequestered life exceeds that of carbon dioxide in the atmosphere (Skog and Nicholson 2000). Using the factors in Winjum et al (1998) for tropical timber, about 10% or less of the carbon in extracted logs is essentially permanently sequestered in long-term products (life >100 yr). Thus the assumption of immediate emissions from the ELE factor will overestimate both emissions in the year of harvest and ultimate total emissions.
4.3. Implications for forest management
Knowledge of the relative magnitude of each emission source from logging provides the information needed to design possible actions for reducing emissions by improving the logging practices. Emissions from logging damage (LDF) are generally the largest source of emission for most sites, followed by infrastructure damage in Guyana and Indonesia. The emissions from the extracted log, for comparison, are between 24 and 53% of the in-forest logging damage emissions. Efforts to reduce these emission sources could include, e.g., extracting more timber per felled tree and reducing waste; improving directional felling and thus reducing incidental damage to surrounding trees; planning infrastructure more effectively in areas with greater concentration of timber trees; and use of cable extraction of timber instead of creating skid trails up to the stump of the felled trees. In several of the logging study sites, most notably Indonesia and ROC, the diameter at the base of the top of many of the trees left in the forest to decompose was 80 cm or more containing more than 50% of the tree carbon. With respect to replacing skidding trails with cable extractionâthis could potentially reduce the infrastructure emissions by up to 30%. Many such practices and thus emission reductions can be associated with Reduced Impact Logging (RIL). The ability to reduce emissions through changes in practices highlights the need for multiple emission factors with changes in practices leading to new emission factors to apply to activity data. The need to develop emission factors for both conventional and reduced impact logging will be particularly important for rewarding countries efforts to implement sustainable forest management under REDD+.
4.4. Comparison of gross carbon emissions from selective logging with those for deforestation
Although we have shown that selective logging in tropical humid forests has a relatively low impact on the biomass carbon stocks on a per hectare basis, selective logging takes place over large areas, and at a country level, the total emissions could be significant (Asner et al 2005). To produce an initial estimate of logging emissions at a national scale we used estimates of industrial roundwood production from the FAO-FRA 2010, cross checked with each country report and FAOSTAT, for five countries covered by our study sites (excluding Belize) plus a further four key timber producing countries (Democratic Republic of Congo, Gabon, Malaysia, and Suriname) represented by the data collected in our study sites; and applied the relevant emission factors obtained in this study (table 7). Although we recognize that the emission factors can be expected to vary geographically, these four additional countries were selected because we assumed, that given their location, physiognomy of their forest types, and their selective logging practices (including extraction rates per ha), that their emission factors would be very similar to those obtained in our study sites. We compared these gross emissions with those from gross tropical deforestation for these nine countries using the data reported in Harris et al (2012).
Table 7. Gross carbon emissions from logging (ELE = extracted log emissions, LDF = logging damage factor, LIF = logging infrastructure factor) and from deforestation for some key tropical timber producing countries. Estimates of industrial roundwood production for 2005 (most recent reporting year) for each country are from the FAO-FRA 2010, cross checked with each country report. Total emissions from deforestation are the median values from Harris et al (2012). Countries selected are considered those appropriate for the emission factors calculated in this study.
| Country | Industrial roundwood production (103 m3 yrâ1) | ELE (Tg C yrâ1) | LDF (Tg C yrâ1) | LIF (Tg C yrâ1) | Total emissions from logging (Tg C yrâ1) | Total emissions from logging excluding roads and decks |
Total emissions from deforestation (Tg C yrâ1) | Ratio of logging to deforestation emissions (excluding roads and decks) |
|---|---|---|---|---|---|---|---|---|
| DRC |
4208 | 1.05 |
2.10 |
1.01 |
4.17 | 3.20 | 22.5 | 0.14 |
| Gabon | 1098 | 0.27 |
0.55 |
0.26 |
1.09 | 0.83 | 3.97 | 0.21 |
| ROCongo | 1450 | 0.36 | 0.73 | 0.35 | 1.44 | 1.10 | 3.29 | 0.33 |
| Indonesia | 5839 |
1.46 | 3.33 | 3.91 | 8.70 | 5.96 | 104.6 | 0.06 |
| Malaysia | 26â706 | 7.48 |
14.7 |
17.9 |
40.1 | 27.51 | 40.8 | 0.68 |
| Brazil | 18â303 |
6.96 | 13.0 | 4.94 |
24.9 | 21.73 | 339.2 | 0.06 |
| Bolivia | 871 | 0.26 | 1.07 | 0.24 |
1.57 | 1.33 | 10.6 | 0.13 |
| Guyana | 395 | 0.14 | 0.39 | 0.39 | 0.92 | 0.60 | 1.41 | 0.43 |
| Suriname | 181 | 0.07 |
0.18 |
0.18 |
0.42 | 0.28 | 0.83 | 0.33 |
aDemocratic Republic of Congo, and data from FAOSTAT for 2005 (http://faostat.fao.org/site/626/DesktopDefault.aspx?PageID=626#ancor). bFrom natural forests only; an additional 8.6 million m3 are produced from plantations in Indonesia, and 98.7 million m3 in Brazil (www.sidra.ibge.gov.br/bda/pesquisas/pevs/default.asp). cWe used the LIF of 0.27 Mg mâ3 estimated from data in Feldpausch et al (2005) for Bolivia and Brazil. dRoads and decks excluded for comparison with deforestation to give a conservative comparison taking into account the risk that roads and decks may have been captured in the deforestation analysis. eEmission factors for Gabon and DRC from ROC. fEmission factors for Malaysia from Indonesia. gEmission factors for Suriname from Guyana.
The purpose of this analysis is to demonstrate the scale of emissions from logging relative to deforestation rather than to give definitive estimates. Such estimates would require emission factors that are country specific and rely on accurate estimates of harvested volumes from non-plantation forests. We are confident that the FAO-FRA estimates for the given countries capture extraction rates only from natural forests. Although the three emission factors will likely vary somewhat within countries, we further argue that given the robustness of the emission factors (e.g. 90% confidence intervals for individual factors <10% of the mean) and the strong relationships between LDF and forest biomass and log length, and ELE and wood density (figure 2) restricts the possible variation within timber harvesting areas in a country. To be conservative in the comparison we exclude roads and decks from the LIF because in some cases the gross deforestation data used by Harris et al may have already included these areas as deforestation. This is very conservative as many roads and decks are likely too small to be captured in the remote sensing imagery and countries may not consider thin lines of tree cover loss within the forest to be deforestation. However, the total emissions from tropical timber harvesting practices must include emissions from all infrastructure; only in this comparison with deforestation do we exclude roads and decks to reduce the risk of double counting.
Extraction spanned one order of magnitude between the nine countries leading to a similar variation in harvesting emissions. Comparison with deforestation emissions clearly illustrates the significance of timber harvest from native forests as an emissions source. For the nine countries included, emissions from logging were on average equivalent to about 12% of those from deforestation (with a range from 6% to 68%).
We found that for those countries with high deforestation emissions, such as Indonesia and Brazil, emissions from logging were relatively small and were equivalent to <10% of those from deforestation. On the other hand, for several of the countries with relatively low deforestation emissions of less than 5 Tg C yrâ1 (e.g. Republic of Congo, Guyana, and Suriname) emissions from logging were significant and equivalent to about half or more of those from deforestation. We suggest, therefore, that such countries should place equal efforts on opportunities for reducing emissions in this sector. Understanding the magnitude of each emissions source resulting from tropical timber harvesting practices as presented in this paper helps identify where there are opportunities to reduce emissions from the second 'D' in REDD.
Acknowledgments
We gratefully acknowledge funding by USAIDâCooperative Agreement No. EEM-A-00-03-00006-00 and EEM-00-06-00024-00 and from TNC and from the Guyana Forestry Commission. In data collection there are many people who participated and thank, in particular Matt Delaney (Belize and Bolivia), David Shoch and Stephen Ambagis (ROC), Rogerio Miranda (Brazil), Sean Grimland and Sarah Walker (Brazil and Indonesia), Jim Roshetko, Bambang Wahyudi and Fakhrizal Nashr (Indonesia), Carey Bhojedat and Hansrajie Sukhdeo (Guyana). Additional support was received from many contributors we would like to acknowledge, such as: the Congolaise Industrielle des Bois concession and their staff (ROC), Bronson Griscom and staff of the various concessions in which we worked (Indonesia), Ramon Pacheco and the staff from the Programme for Belize (Belize), Pradeepa Bholanath, Nasheta Dewnath and all the staff from the Guyana Forestry Commission (Guyana), and Nancy Harris for comments on drafts of the manuscript.