
Abstract
This paper looks at the response of river ice to recent warming in the Arctic at six major downstream gauges on large Russian rivers flowing to the Arctic Ocean. For the Severnaya Dvina, Ob, Yenisey, Lena, Yana and Kolyma we determine how river ice has changed in recent years and we try to understand the underlying causes of those changes. Long-term variability and trends in beginning and ending dates of ice events, duration of ice conditions, and maximum ice thickness were analyzed over 1955–2012. Significant changes in timing of ice events and a decrease in ice thickness were found for the five Siberian rivers. Duration of ice conditions decreased from 7 days for the Severnaya Dvina, Lena and Yenisey to almost 20 days for the Ob at Salekhard. The change in timing of ice events is consistent with changes in regional air temperature, which has significantly increased at each of these river gauges, except Lena-Kusur. The primary cause of the considerable increase in maximum ice thickness was not identified. Variation of mean winter air temperature and river discharge do not correlate well with maximum ice thickness and it is assumed the influence of specific local conditions can play a more important role in ice formation at these locations. Understanding this interrelationship across the Eurasian pan-Arctic using more comprehensive data archives for river ice and discharge is therefore needed.
Export citation and abstract BibTeX RIS

Content from this work may be used under the terms of the Creative Commons Attribution 3.0 licence. Any further distribution of this work must maintain attribution to the author(s) and the title of the work, journal citation and DOI.
1. Introduction
There is ample evidence showing the entire Arctic system is changing (Jeffries et al 2012, Vaughan et al 2013, AMAP 2011, ACIA 2005) and in terms of reductions in snow cover (Brown and Robinson 2011), intensifying spring melt (Bulygina et al 2011a) and increasing river flow (Shiklomanov and Lammers 2009) the northern hydrological cycle is no exception. Variability in climate and the environment is normal, however, where that change intensifies, accelerates, or intersects with human activity the level of concern rises appreciably. One of those intersections is the occurrence of ice on large rivers where changes can have immediate consequences for navigation, transport, erosion, subsistence, construction works, ice bridges, and the local and regional economies. Additionally, from a scientific standpoint river ice characteristics are closely linked with river discharge, sediment and biogeochemical loads, fish habitat, and seasonal productivity of rivers, lakes and reservoirs. Therefore, understanding ice characteristics, including dates of ice events, ice thickness and their variability is critical for these high latitude regions. In this paper we look at the Russian river ice regime and how it has changed in recent years and we try to understand the underlying causes of those changes.
2. Data and methods
Despite river ice being such an important component of the human–river interactions, it is surprising that observations for ice conditions and measurements of ice thickness are not regularly taken nor are they part of the standard hydrometeorological observations in most Arctic countries, including Canada and USA. This is primarily due to automation of hydrological observations in these countries and the absence of permanent staff at the monitoring locations for direct observations of river ice conditions. Recently, some river gauges in the USA and Canada were equipped with video cameras. However, at high latitudes where daylight hours are limited in winter, video observations for the river ice are less efficient especially on large rivers and they do not allow for estimation of ice thickness. Overall, the lack of systematic and regular ice observations will hamper the reliable evaluation of winter river discharge (Shiklomanov et al 2006). Use of contemporary satellite products can help to partly fill this gap in river ice data for large Arctic rivers, however, because of problems with reliability and regularity the remote sensing data cannot fully replace ground observations (Pavelsky and Smith 2004). Only fragmentary river ice information from ground observations is available for the USA and Canada although more detailed data over the last 10–15 years are available for several experimental research basins.
The longest records of Arctic river ice are found in Russia and these are the long-term ice data collected as part of the Russian standard hydrological monitoring network that are of high interest for the international research community. Several studies of long-term variability of the ice regime for the Russian pan-Arctic rivers, lakes and reservoirs have been made during the last 10–15 years (Smith 2000, Magnuson et al 2000, Borshch et al 2001a, 2001b, Vuglinsky et al 2002, Vuglinsky 2006). The best summary of changes in river ice regime is given by Beltaos and Prowse (2009). The most comprehensive analysis of long-term trends in river-ice freeze-up and breakup dates have been made in Russia by Soldatova (1993) and Borshch et al (2001a, 2001b) based on data until 1991. They found a significant trend towards later freeze-up and earlier breakup in European Russia and West Siberia and no trend in East Siberia. Smith (2000) tested trends in river ice phenology of Russian Arctic rivers based on data to 1994 and did not find consistent changes. Vuglinsky (2006) compared dates of freeze-up and breakup of Russian rivers between periods 1950–1979 and 1980–2000, and reported that freeze-up and breakup occurred 2–3 days later and 3–5 days earlier on average in large Siberian rivers. All these analyses were, however, based on data covering the period up to the end of the 1990s or earlier. Since then, we have witnessed the most intensive warming of Arctic regions and the greatest decline in Arctic Ocean sea ice (Maslanik et al 2011).
The Russian River Ice Thickness and duration data set from the National Snow and Ice Data Center (NSIDC, http://nsidc.org/data/g01187.html) has been a basic source of historical river ice information. This data set, obtained through the US–Russia Working Group VIII of the US–Russia Bilateral Agreement on the Protection of Environmental and Natural Resources (Vuglinsky 1999), consists of river ice thickness measurements, with beginning and ending dates for river freeze-up events from fifty stations across northern Russia. The data set includes values from 1917 through 1992 with variable record lengths for each station. The longest station record covers the period 1917–1988, however, the majority of sites have data from the end of the 1950s through to the end of the 1980s.
For the current analysis, ice data for Russian rivers selected for analysis were extended up to the middle 2000s based on information published by Roshydromet in hydrological yearbooks and for more recent years (up to 2012) data were obtained from the Arctic and Antarctic Research Institute (AARI) by processing operational hydrological information compiled on the AARI data server. Although the operational data are considered provisional, a comparable analysis of these data with officially published information over the same period has shown quite high reliability of the data. River ice information for six primary downstream gauges on the large Russian rivers flowing to the Arctic Ocean was analyzed for the period 1955–2012 to identify changes in ice thickness and timing (figure 1, table 1). River discharge data up to 2009 was obtained from the University of New Hampshire data repository, ArcticRIMS (http://rims.unh.edu/) and were extended for these six gauges to provide streamflow information consistent with the river ice data. The analysis was made for hydrological year covering 1 October to 30 September.
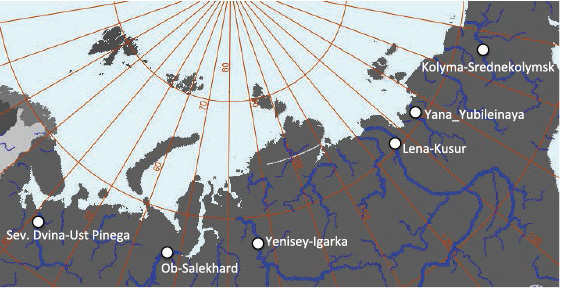
Figure 1. Locations of Russian river gauges used for river ice analysis.
Download figure:
Standard image High-resolution imageTable 1. Main attributes of analyzed down stream river gauges.
| River gauge | Drainage area (km2) | Distance to outlet (km) | Annual discharge (km3) | Start of discharge measurements (year) | Start of ice measurements |
|---|---|---|---|---|---|
| Severnaya Dvina-Ust Pinega | 348 000 | 137 | 106 | 1881 | 1953 |
| Ob-Salekhard | 2950 000 | 287 | 397 | 1930 | 1954 |
| Yenisey-Igarka | 2440 000 | 687 | 590 | 1936 | 1955 |
| Lena-Kusur | 2430 000 | 211 | 543 | 1934 | 1954 |
| Yana-Yubileinaya | 224 000 | 157 | 34 | 1972 | 1950 |
| Kolyma-Srednekolymsk | 361 000 | 641 | 70 | 1927 | 1934 |
aBased on beginning of ice thickness measurements, visual observations for river ice conditions often started earlier.
Long-term trends in river ice through time were analyzed using the commonly employed least squares linear regression. Statistical significance is determined using both the t-test for linear regression coefficients and the more robust, nonparametric Mann–Kendall test (Helsel and Hirsch 1992) that is widely used in hydrological studies (e.g. Shiklomanov et al 2007 and Smith 2000). The trend analysis was applied to maximum annual ice thickness, dates of beginning and ending of ice events and total duration of ice events. Trends were considered statistically significant at the 90% level for both methods We analyzed several air temperature data sets to find the best correlation with river ice conditions, including gridded global monthly observational data with 0.5° spatial resolution from (i) the University of Delaware (Willmott and Robeson 1995, Matsuura and Willmott 2012), (ii) daily gridded air temperature from NCEP reanalysis with original T62 Gaussian grid (∼1.75° × 2.0°) spatial resolution (Kistler et al 2001) and (iii) daily air temperature data from Russian meteorological stations included in the international data exchange from the Russian Institute of Hydrometeorological Information—World Data Center (RIHMI-WDC) (Razuvaev et al 1993). The best correspondence between air temperature and ice conditions was found for gridded monthly air temperature from the University of Delaware and these were used in following analysis.
3. Results
Timing: Long-term variations in beginning and ending dates of ice events and total duration of ice events for the downstream gauges of the six Russian rivers flowing to the Arctic Ocean are shown on figure 2.
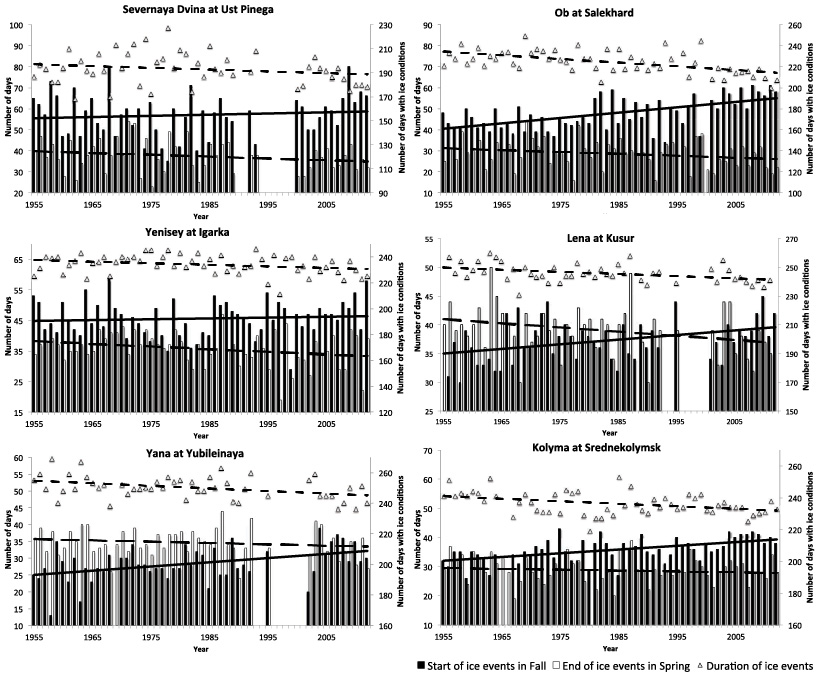
Figure 2. Long-term variations of (1) first ice appearance date in fall given as number of days (left vertical axis) from 1 September (linear trend shown as solid line), (2) end ice conditions date in spring given as number of days (left vertical axis) from 1 April, or 1 March for Sev. Dvina (linear trend shown as short dash-line) and (3) ice condition duration in number of days over the hydrological year on right vertical axis (linear trend shown as long dash-line).
Download figure:
Standard image High-resolution imageTrend analysis showed significant trends towards later ice appearance in fall for all rivers except Severnaya Dvina and Yenisey (figure 2, table 2). Over 1955–2012 the date of first ice appearance has been from 2 days later for Yenisey at Igarka to 14 days later for Ob at Salekhard. The general tendency of earlier breakup and complete ice disappearance is observed for all rivers with significant trends for Ob, Yenisey and Lena. Currently the final date for all ice events on these largest Siberian rivers is 4–5 days earlier than it was in the end of 1950s. These values agree very well with changes in dates of maximum daily spring river discharge, which has been observed on average 4 days earlier across Russian pan-Arctic from 1960 to 2002 (Shiklomanov et al 2007).
Table 2. Slope of linear trend defined from least squares regression (in numerator, days per year and cm per year for ice thickness) and total changes (in denominator, days and cm for ice thickness) over the study period 1955–2012 for river ice regime characteristics. Statistically significant trends with 90% significance level based on two methods are highlighted with bold font and grayed box.
From 1955–2012 the total duration of ice events significantly decreased for all rivers: 7 days for Severnaya Dvina, Lena and Yenisey to almost 20 days for the Ob at Salekhard (table 2). Linear trends in this ice regime characteristic are statistically significant at the 90% level for all rivers except Severnaya Dvina. The Severnaya Dvina at Ust Pinega is the only river gauge where all changes in timing of ice events were statistically insignificant. An important factor is the higher annual variability of river ice characteristics in the European part of Russia. The long-term variation of first ice appearance date in the fall between 1955 and 2012 for Lena at Kusur is 15 days and variation of total duration of ice events is 29 days whereas the same values for Severnaya Dvina at Ust Pinega are 45 and 59 days respectively (table 3). The lowest variability is observed for the last spring ice event and is in the range from 20 days for the Lena to 34 days for the Kolyma. The latest dates of ice events in the fall and earliest in spring for all studied rivers have been observed after 1990 (figure 2) and this corresponds to the period of most intensive warming in the Arctic. Comparing with analyses made on data until the early 1990s (Smith 2000, Borshch et al 2001a, 2001b, Vuglinsky 2006) we found accelerating trends towards later first ice appearance and earlier ice disappearance during the last 15–20 years for all of the studied rivers.
Table 3. Range of variation for ice regime characteristics (difference between minimum and maximum observed values) and coefficient of variation over 1955–2012.
| Characteristic | Sev. Dvina | Ob | Yenisey | Lena | Yana | Kolyma |
|---|---|---|---|---|---|---|
| Start of ice events (days) | 45/0.18 | 27/0.16 | 30/0.13 | 15/0.10 | 26/0.18 | 17/0.11 |
| End of ice events (days) | 31/0.20 | 28/0.22 | 28/0.15 | 20/0.11 | 24/0.12 | 34/0.19 |
| Duration of ice events (days) | 59/0.07 | 49/0.05 | 35/0.03 | 29/0.03 | 33/0.03 | 34/0.03 |
| Max measured ice thickness (cm) | 33/0.12 | 84/0.16 | 97/0.19 | 105/0.16 | 102/0.15 | 72/0.15 |
Thickness: River ice thickness is another important characteristic of winter hydrological regime. The maximum annual ice thickness between 1950 and 2012 for the same six river gauges and their long-term annual variations are shown on figure 3. The significant decrease in maximum ice thickness is observed for all rivers except Severnaya Dvina (table 1). The most significant negative linear trends were for gauges on the Lena, Yenisey and Yana Rivers where decreases in maximum ice thickness over 1955–2012 were 73, 46 and 33 cm respectively.
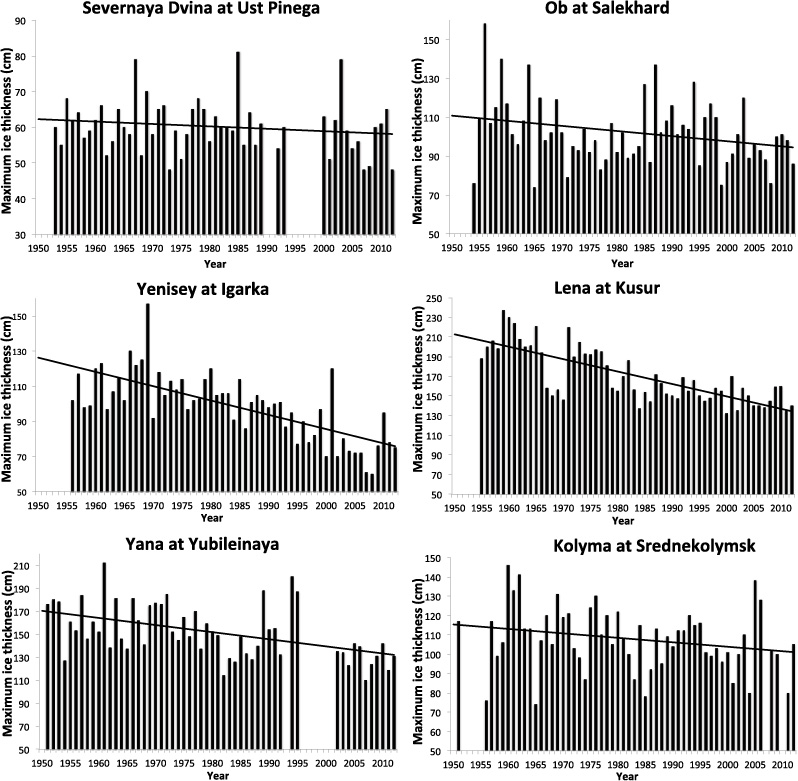
Figure 3. Maximum winter ice thickness (cm) for down stream gauges on large Russian rivers flowing to the Arctic Ocean. Linear trend is shown as solid line.
Download figure:
Standard image High-resolution imageTo better understand possible causes of such significant changes in river ice regime across the Russian Arctic we have made a combined analysis of river ice characteristics with the most obvious potential driver—air temperature. It is well known that air temperature is one of the key elements controlling variations of river ice characteristics. The changes in mean monthly air temperature during the month of first ice appearance in the fall, month of last ice event in the spring, and mean monthly air temperature (October–April with November–April for Severnaya Dvina where river ice formation begins later) over 1955–2012 were analyzed along with river ice data to evaluate the effect of changes in air temperature on river ice. Long-term mean dates of ice appearances for Ob, Yenisey and Sev. Dvina are in the second half of October and the annual dates show the best correlations with air temperature in October while Lena, Yana and Kolyma, with earlier ice appearances dates, have better correlation with air temperature in September. Dates of ice disappearance for all Siberian rivers have the best correlation with air temperature in May and for Sev. Dvina in April.
Air temperatures during ice formation, ice breakup and the entire winter period have increasing tendencies for all rivers with statistically significant positive trends observed at all gauges excluding Lena at Kusur (table 4). The greatest increases in air temperature before freeze-up (4 °C) and during winter (2.8 °C) were recorded in Western Siberia on the Ob at Salekhard. There is good correlation between air temperature during breakup and date of last ice event for Severnaya Dvina, Ob, and Yenisey with correlation coefficients in the range 0.76–0.81. Dates of first ice conditions are also related to air temperature change for the Ob, Yenisey, and Yana Rivers with correlation coefficients of 0.77, 0.77 and 0.69 respectively (table 4). There was no correlation between maximum ice thickness and winter air temperature.
Table 4. Change in air temperature over 1955–2012 evaluated from linear trend line in numerator, (°C) and correlation coefficient between air temperature and corresponding ice characteristic (max ice thickness for mean winter air temperature) in denominator. Statistically significant trends with 90% significance level based on two methods are highlighted with bold font and grayed box.
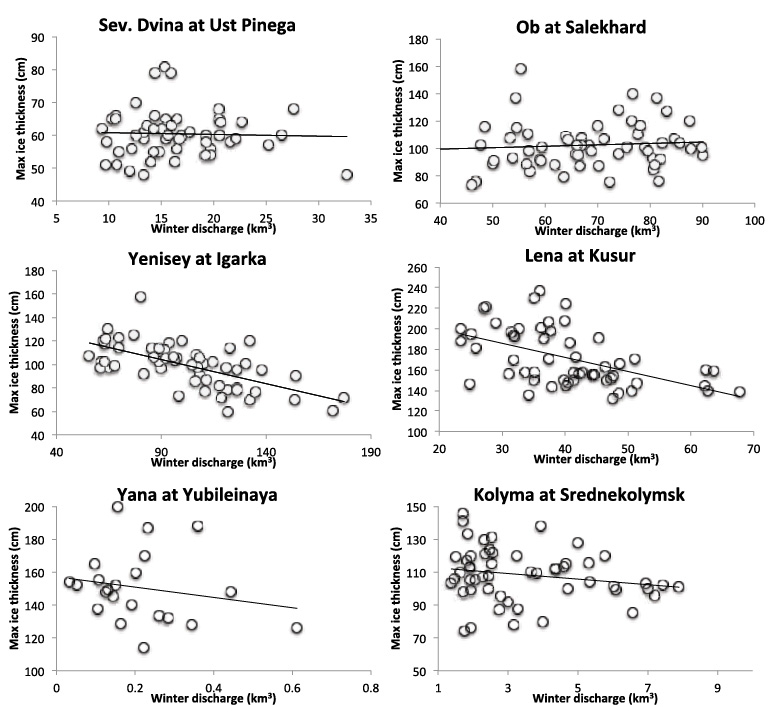
River discharge is another important component indirectly affecting river ice formation through changes of flow velocity and turbulence. To test possible effects of river discharge on maximum observed river ice thickness we evaluated the relationship and correlation between these characteristics. Maximum river ice thickness for these rivers is usually observed in April but the formation of river ice lasts throughout entire winter. Therefore, the mean discharge from November to April was used as a proxy for river velocity and turbulence under ice cover. The relationship between annual maximum ice thickness and mean river discharge over November–April has shown no significant correlation for any of these rivers (figure 4). The highest correlation coefficients were found for the Yenisey (r = −0.63) and Lena (r = −0.54). These two rivers have demonstrated the most significant changes in winter discharge over 1955–2012.
Figure 4. Mean winter discharge from November to April versus maximum ice thickness with linear trend line.
Download figure:
Standard image High-resolution image
4. Discussion and conclusions
The analysis of updated data of river ice characteristics up to 2012 for six Russian rivers flowing to the Arctic Ocean has shown more consistent results in terms of changes in ice regime of large Russian arctic rivers compared to the previous similar study by Smith (2000) based on data up to 1990. The Mann–Kendall null hypothesis of no trend was rejected at the 90% level for all ice characteristics only for the Severnaya Dvina River, the most western river in this study and the only non-Siberian basin. This agrees more generally with the conclusion of Smith (2000) that northern European Russia has experienced less change in ice regime than Siberia. Another explanation of non-significant change in the Severnaya Dvina is that annual variability in date of ice appearance and ice disappearance, and the duration of ice condition is much higher than for the Siberian rivers (table 3). This is likely due to greater cyclonic activity in western Russia with high air temperature anomalies from year to year, especially in the fall when ice formation first occurs. There is a general tendency for decreasing variability in timing of ice events from West to East (figure 2). The Ob River at Salekhard, the second most western river gauge, has shown significant changes in all ice characteristics and the greatest changes in timing. The downstream region of the Ob River has undergone very active economic development and these observed changes in ice regime will have significant effect on regional navigation, construction of winter ice roads, bridges and other river-related economic activity. We observed no significant trend in date of first ice conditions on the Yenisey River at Igarka, although, contrary to Smith (2000), there was a tendency toward later freeze-up. This is related to a significant increase of fall air temperature in this area during the late 1990s–2000s (Bulygina et al 2011b). The least significant change was found in the date of last ice appearance in spring. Although all rivers studied here showed a tendency toward earlier ice breakup from 2 to 5 days, only the three largest Siberian rivers, Ob, Yenisey and Lena, had significant changes (table 2).
The most significant changes have been seen in duration of ice conditions which have shortened from 7 days for the Yenisey to 20 days for the Ob over 1955–2012. This agrees with the generally observed warming of the Arctic that are manifested in the spring through earlier dates of snow cover disappearance and snowmelt (Tan et al 2011), soil thawing (McDonald et al 2004) and spring peak discharge (Shiklomanov et al 2007).
Considerable changes have been found in maximum ice thickness for all rivers except the Sev. Dvina with most significant trends over 1955–2012 for the Lena (−73 cm) and Yenisey (−46 cm) Rivers (table 2). The most significant changes in river ice thickness for all rivers have been observed during the last 10–15 years and this is consistent with recorded changes in sea ice extent (figure 3 and Maslanik et al 2011).
The formation of ice cover on lakes and reservoirs is mainly defined by air temperature. River ice formation is a more complicated process dependent on flow, water temperature and hydraulic conditions (Beltaos 1997). However, air temperature is usually considered as a main driver of changes in ice regime although its influence is different on each of the river's ice characteristics. Analysis of different air temperature data, both gridded and in situ, has shown that the regionally averaged interpolated observational data for the representative grid cell is much better correlated with river ice characteristics than data from the closest meteorological stations. Individual stations can be skewed by local conditions and locations and river ice conditions are better defined by air temperature averaged over the surrounding area when data from several nearby meteorological stations are taken into account and local anomalies are smoothed. The best correspondence between changes in air temperature and river ice characteristics was found for observational gridded air temperature fields from the University of Delaware Matsuura and Willmott (2012) and these were used in our analysis.
Air temperature has increased over 1955–2012 for all these rivers and during all winter periods (month of first ice appearance, month of breakup, and average over October to April) in the range from 0.8 to 4.0 °C (table 4) consistent with the regional warming of the Eurasian Arctic (Bulygina et al 2011a, 2011b). There was no general pattern in temperature change across all rivers. The smallest changes were observed at Lena-Kusur although this gauge has shown significant changes in all characteristics of ice regime. The weakest correlation between timing of ice events and air temperature for this gauge suggests a reduced effect of air temperature on ice formation or there is some uncertainty in the air temperature data for this area. Additionally, we understand that the use of monthly air temperature data with specific ice event dates will introduce additional uncertainty, which is especially large when ice events fall at the beginning of a month. Notwithstanding these arguments, there is a good correlation between air temperature and timing of ice events for most of these rivers and this relationship tends to weaken from west to east. From this we conclude that air temperature has a significant influence on changes in timing of the ice regime in these downstream locations on the large Russian Arctic rivers.
In Russia, most forecasting methods for ice thickness are traditionally based on air temperature (Shuliakovskii 1966), yet surprisingly we have not found any correlation between mean winter air temperature from November to April and maximum ice thickness, which is usually observed for all rivers in April (table 4). It is possible that maximum ice thickness is formed under the influence of specific local conditions or due to other factors defining river ice formation during the winter, including river flow and snow depth over the ice. The available observational data for snow thickness from NSIDC covers the period from 1955 to 1992 and has many gaps. Combined analysis of ice and snow thickness have not revealed any significant correlation. River discharge determines water velocity, turbulence, and mixing of heat in the river and thereby it will influence river ice growth during the length of the winter. Significant increases in cold season river discharge across the Eurasian pan-Arctic has been reported in recent publications (Smith et al 2007, Shiklomanov et al 2011) due to both climatic and anthropogenic causes. Discharge of four of the rivers: Yenisey, Lena, Kolyma and Ob, is regulated by upstream reservoirs and hydropower generation plants, which usually significantly increase discharge during the winter low flow period. The dams with reservoirs can also significantly change the thermal regime of rivers downstream and reduce formation of river ice. However, all reservoirs on these rivers are located too far upstream from the gauges to have a noticeable effect on river temperature. Lammers et al (2007) analyzed the thermal regime of these river gauges and did not find any significant changes for post-dam period. River discharge, however, has significantly increased in winter due to reservoir regulation by up to 35% and 100% for Lena and Yenisey respectively (Adam et al 2007, Stuefer et al 2011).
We tested the hypothesis of correlation between maximum river ice thickness and mean river discharge over November–April and no significant correlation was found. The highest correlation coefficients were found for Yenisey (−0.64) and Lena (−0.54) where magnitudes of changes in winter discharge over the 1955–2012 were the highest due to anthropogenic impact (see paragraph above). It should be noted that these rivers have shown the most significant decrease in maximum ice thickness, which can be partly explained by the most significant increase in winter discharge (Shiklomanov and Lammers 2013). For all other large Russian Arctic rivers studied here, it can be concluded that the current observed changes in winter discharge do not have a significant effect on formation of maximum ice thickness. However, a recent study of air temperature, ice thickness and river discharge on 16 monitoring stations in the Aldan river basin, a tributary of the Lena (Gurevich 2009) has shown that winter air temperature was correlated with winter discharge and river ice thickness. When deviations of winter air temperature from the long-term mean were 2–3 °C the deviation of Aldan river winter runoff from long-term mean were 20–30%. This study showed that lower winter temperatures yielded faster winter runoff depletion. According to Gurevich (2009) increasing temperatures weaken the influence of ice cover on river discharge causing discharge to increase. In our study we did not find the primary cause of considerable increase in maximum ice thickness, however, we believe the interrelationship between river air temperature, river ice and river discharge is complicated but exists and it can be better investigated using more detailed data for smaller sized rivers. Understanding of this interrelationship across the Eurasian pan-Arctic using more comprehensive data archives for both river ice and river discharge will be the main focus of our next investigation.
Acknowledgments
We greatly appreciate the assistance of Dr Banschikova from the State Hydrological Institute and O Golovanov from the Arctic and Antarctic Research Institute, both in St Petersburg, Russia, for compilation of the river ice and discharge data. The work was supported by the National Science Foundation under the grant ARC1204070 to improve understanding of interactions between streamflow, permafrost and river ice. A Shiklomanov also benefited from the support of the Russian Ministry of Education and Science under the contract 14.B25.31.0026