

Abstract
China has been experiencing significant climate and land use changes over the past decades. The way in which these changes, particularly a warming hiatus and national ecological restoration projects that occurred almost concurrently in the late 1990s, have influenced vegetation net primary productivity (NPP), is not well documented. Here, we estimated annual and seasonal changes in China's NPP between 1982 and 2015 using the Carnegie-Ames-Stanford Approach model and examined their shifting years (SHYs) caused by the switch in climatic factors and the restoration projects. Our analyses revealed that the growth of annual, spring and summer NPP stalled in 1997 or 1998, while the trend of autumn NPP increased in 1992 at the national scale. We also showed that the changes in the NPP trends were more sensitive to the warming hiatus in spring and autumn, as well as in the temperate monsoonal region and the Tibetan Plateau, while the larger trend of autumn NPP in eastern China after the SHY was strongly coupled with increased monsoonal precipitation. Although the starting years of the restoration projects were partially consistent with the SHYs of the NPP trends, the projects were likely playing minor roles in enhancing NPP increase. Our findings can be applied for ecological risk assessment and future management of ecological restoration projects in the context of global change.
Export citation and abstract BibTeX RIS

Original content from this work may be used under the terms of the Creative Commons Attribution 3.0 licence. Any further distribution of this work must maintain attribution to the author(s) and the title of the work, journal citation and DOI.
1. Introduction
Net primary productivity (NPP), the positive increments in plant biomass via photosynthesis per unit time, is not only an essential factor reflecting vegetation activity but also the central variable of carbon cycling (Field et al 1998, Luyssaert et al 2007). Terrestrial vegetation provides most of the food, fuel, fabrics and building materials to humans. Therefore, the dynamics of terrestrial ecosystem NPP, a measurement of potential resource products, have received attention from a growing number of researchers in the context of global change (Melillo et al 1993, Cramer et al 2001, LeBauer and Treseder 2008).
Climate change is the most important and direct factor affecting vegetation activity. Through remote sensing data analysis and manipulation experiments, many studies have reported the possible impacts of the variation of temperature (Myneni et al 1997, Richardson et al 2010), precipitation (Fang et al 2004, Liu et al 2018) and solar radiation (Zhao and Running 2010, Wang et al 2017) on vegetation growth. However, changes in climatic factors are usually phased or sudden (Lockwood 2001). On a global scale, the increase rate of average temperature between 1980 and 2000 was 0.02 °C yr−1, which is faster than ever before (Easterling et al 2000, Karl et al 2000), but this increase has clearly slowed down since 1998 (IPCC 2013, Li et al 2015). Moreover, because of volcanic eruption, solar radiation reached a minimum in 1992 (Minnis et al 1993). Apart from these global patterns, climate change in China also has some region-specific characteristics. For example, Chen and Shi (2003) noted that due to the shift in large-scale general circulation, autumn precipitation continued to decrease in most parts of China from 1951 to 1999. The CMIP5 models predicted that East Asian monsoon would be enhanced in the future, and thus, the decreasing trend of autumn precipitation was expected to be constrained (Piao et al 2010, Bao 2012). All the aforementioned climate change patterns likely lead to the phasic change of NPP in China.
Although intensive human activity is proven to be a main cause of the reduction in vegetation cover worldwide, this is not entirely the case in China (Lu et al 2018, Chen et al 2019). A series of ecological restoration projects, implemented in succession since late 1990s, such as Natural Forest Protection (started in 1998) (Ren et al 2018) and Grain for Green (2003) (Feng et al 2005), created conditions for the accelerated growth of the NPP. However, not all types of projects benefit NPP growth. Some studies have reported the destruction of vegetation caused by unsuitable afforestation and grass planting in the arid and semi-arid areas of China (Feng et al 2015). Hence, in addition to climate change, human activity can also be regarded as a critical factor triggering the NPP trend change in China.
Under the above background, it is unclear whether the increasing trend in China's NPP has changed and how did climate change and human activity affect the shifts in NPP trends. However, the following limitations have prevented previous studies from analyzing or discussing these questions thoroughly. First, estimations of NPP are inaccurate. The quality of data, interpolation method and study area all affect the estimates of NPP. However, due to fewer restrictions on these factors, previous studies show a great difference in calculation results, even those based on the same model (e.g. Zhu et al 2007, Gao and Liu 2008). Second, limited by observation time and data span, researchers did not concentrate on the shifting year (SHY) of NPP trend or distinguished it with a low level of confidence (e.g. Piao et al 2005, Yang et al 2017). Third, a piecewise regression model is commonly used to obtain SHYs. However, some researchers ignored the overfitting problem and optionally added the model parameters, misapplying the method (e.g. Liang et al 2015).
Therefore, based on more complete data and preprocessing methods, this study aims to provide a long time series (1982–2015) NPP estimation and achieve the following two goals: (1) identify potential phasic changes in China's terrestrial ecosystem NPP at different temporal (annual and seasonal) and spatial (national and regional) scales; and (2) reveal climatic or anthropogenic factors triggering shifts in NPP trends.
2. Materials and methods
2.1. NPP data estimation
We estimated the NPP using the Carnegie-Ames-Stanford Approach (CASA) model. The CASA model is a powerful tool for large-scale NPP estimation based on plant physiology and carbon sequestration process, whose input includes meteorological, soil and vegetation data (Potter et al 1993, Field et al 1995). In this model, NPP (gram carbon, gC) is expressed as the product of the amount of photosynthetically active radiation (APAR, megajoule, MJ) and light utilization efficiency (ε, gC MJ−1) (equation (1)):

where NPP(x, t) is net primary production for a specific location (x) and period (t); APAR(x, t) and ε(x, t) can be calculated by equations (2) and (3) respectively.

where FPAR(x, t) is the fraction of photosynthetically active radiation, which can be derived from vegetation type and normalized differential vegetation index (NDVI); SOL(x, t) is the total solar radiation; T1(x, t) and T2(x, t) are effects of temperature stress, which are related to extreme temperatures and deviation from optimum temperature respectively; W(x, t) is calculated by the soil moisture submodel and accounts for the effect of water stress; εmax is the maximum value of light utilization efficiency and is assigned as 0.405 gC MJ−1 in this study (Field et al 1995).
2.2. Data preprocessing
We selected China except for the non-vegetated regions marked by 1:1000 000 vegetation map (ECVMC 2007) as the study area, which covers 91.3% of China's landmass. To meet the requirements of the CASA model and clearly present the spatial differentiation of NPP variations, the study area was classified into ten vegetation types and four climatic regions (He et al 2019), namely temperate continental, temperate monsoonal, subtropical–tropical monsoonal and the Tibetan Plateau (figure S1 is available online at stacks.iop.org/ERL/14/124009/mmedia). Moreover, soil texture data for calculating the water stress coefficient were provided by the Cold and Arid Region Sciences Data Center (http://westdc.westgis.ac.cn/).
We used meteorological data from 2480 conventional and 130 radiation monitoring stations (http://data.cma.cn) to create gridded monthly temperature, precipitation, and solar radiation products. Spatial interpolation was implemented by Anusplin 4.4, which is based on improved thin plate spline method and has been proven to have better interpolation results than inverse distance weighted and kriging methods in China (Qian et al 2010, Hutchinson and Xu 2013). We tried to change the order of the spline and introduce different covariables to obtain the optimal interpolation models. Parameters and deviations derived from general cross validation of all tested models are shown in table S1. Accordingly, we selected a quadratic model using elevation as a covariate for temperature interpolation and a quadratic but non-covariate model for solar radiation. Although designating the distance to the coastline as a covariate could help to obtain a lower error, it also led to an unusual pattern in Northwest China (figure S2). Therefore, we selected quadratic but non-covariate model for precipitation interpolation in practice. Elevation data used for spatial interpolation were provided by CGIAR-CSI (http://srtm.csi.cgiar.org/).
GIMMS NDVI data with high temporal (15 d) and spatial (8 km or 0.083°) resolution have been widely used for monitoring terrestrial vegetation activity (Beck and Goetz 2011, Li et al 2014). In this study, we applied the maximum value composition method to denoise the dataset and obtained monthly data between 1982 and 2015 (Holben 1986).
Using the above data, mean annual NPP values for each pixel derived from CASA model were highly consistent with those of the MOD17A3 dataset (R2 = 0.70, p < 0.01, figure S3(a)). In addition, annual averages of the two datasets were quite synchronous (r = 0.684, p < 0.01) (figure S3(b)). Therefore, the estimation in this study was relatively reliable and able to accurately depict the spatiotemporal changes of NPP in China.
2.3. Data analyses
2.3.1. Piecewise regression model
Under the influence of climate change and human activity, ordinary linear regression model (equation (4)) is not adequate to describe the change in long time series vegetation activity (Peng et al 2011, Piao et al 2011). Therefore, we introduced the piecewise regression model with a piecewise point to identify the phasic change features of NPP. Unlike the application scenario for which the model was first proposed (Toms and Lesperance 2003), changes in NPP may not continue (Liang et al 2015), so we deformed the model as shown in equation (5)


where y is annual or seasonal NPP; t represents for the year; ε is an error term; α is the piecewise point or the SHY of the NPP trend in our case; β1 in equation (4) is the average annual increment of NPP during the entire study period; β3 and β5 in equation (5) are NPP trends before and after the SHY, respectively; β0, β2 and β4 are constant terms.
The Akaike information criterion (AIC), which comprehensively reflects fitting error and the number of parameters, was employed to compare the performances of the above two models (equation (6))

where RSS is the residual sum of squares; n is the sequence length; k is the number of parameters, which equal to 2 and 5 for equations (4) and (5) respectively.
Burnham and Anderson (2002) noted that the difference between AICs ( ) and the threshold of −2 can be used to choose the better of two models. Specifically, in this study, we used piecewise regression for model 1 and ordinary linear regression for model 2. Accordingly,
  implied that the piecewise regression model was better and there was a significant change in NPP trend. While
  suggested that there was no significant difference in the NPP trend before and after the SHY.
2.3.2. Multiple regression model
Taking temperature, precipitation and solar radiation as inputs, multiple linear regression model can commendably simulate changes in NPP in China (Wang et al 2017). Thus, equations (7) and (8) were applied to evaluate the independent impacts of these variables on NPP trends (He et al 2019)

where XT, XP and XS are sequences of temperature, precipitation and solar radiation respectively; βT, βP and βS are regression coefficients corresponding to three climatic factors; βC is a constant term; ε is an error term; t represents for the year; Ci is the derivative of the product term with respect to time and denotes the trend of NPP which is directly affected by a certain variable. It is noteworthy that CT (CP, CS) is usually expressed as the contribution of temperature (precipitation, solar radiation) to the NPP trend in this study.
The CASA model and data analyses were all implemented with R (R core team 2019).
3. Results
3.1. NPP trends at the national scale
The mean annual NPP from 1982 to 2015 was 2530 TgC in China. During the entire study period, the annual NPP significantly increased (R2 = 0.68, p < 0.01), with a mean annual increment of 12.63 TgC, or an increase rate of 0.5% (figure 1(a)). Because non-evergreen vegetation, whose NPP was close to zero in winter (December–February), occupies most of China's landmass, we concentrated only on the dynamics of vegetation NPP during the growing season (figures 1(b)–(d)). The mean annual NPP in spring, summer and autumn were 550 TgC (21.7% of annual value), 1279 TgC (50.4%) and 543 TgC (21.4%) respectively. Over the 34 years, NPP in all three seasons increased significantly (p < 0.01). Spring NPP had the largest growth rate (0.83%), followed by that of autumn (0.49%) and summer (0.30%).
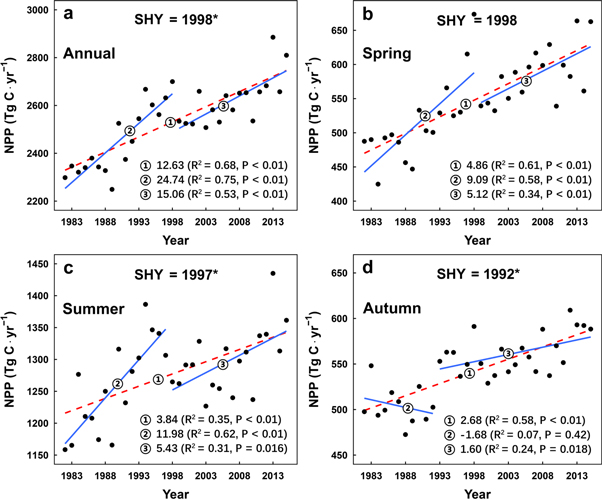
Figure 1. Changes in (a) annual and (b)–(d) seasonal NPPs between 1982 and 2015 in China's terrestrial ecosystems. At the top of each subplot, the label represents for the shifting year (SHY), and * indicates that there was a significant change in the NPP trend (δAIC ≤ −2).
Download figure:
Standard image High-resolution image3.2. Phasic changes in NPP at the national scale
The results of piecewise regression indicated that there was a significant change in the trend of annual NPP ( ). The mean annual increment decreased from 24.74 to 15.06 TgC yr−1 in 1998 (figure 1(a)). At the seasonal scale, significant SHYs were also found in summer and autumn. Before and after 1997, summer NPP increased rapidly by 11.98 TgC yr−1 and then increased slowly by 5.43 TgC yr−1. A sudden change occurred in 1992, when the previous decreasing trend (−1.68 TgC yr−1) of autumn NPP reversed to an increasing trend (1.60 TgC yr−1). Moreover, the shift in spring NPP trend appeared in 1998, but there was a significant difference in trend values before and after the SHY.
3.3. Spatial patterns of phasic changes in NPP
From 1982 to 2015, significant SHYs of annual NPP were identified in 63.3% of the country. SHYs in the Tibetan Plateau appeared early, distributed between 1992 and 1995, while those in the temperate continental region occurred relatively late, mostly after 2000 (figure 2(a)). Furthermore, the changes in the magnitude of NPP trends also varied from different regions. NPP growth was accelerated in over 60% of the total area in both the temperate continental region and the subtropical–tropical region, whereas the proportion was 48.8% in the temperature monsoonal region and 51.0% in the Tibetan Plateau (figure 2(b)).
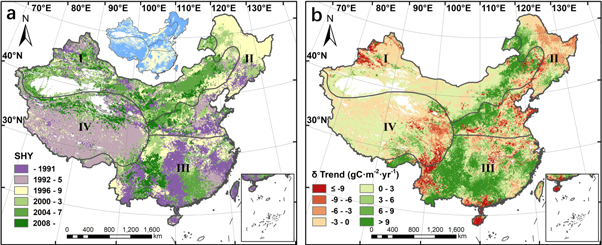
Figure 2. The spatial distribution of (a) the SHY and (b) the difference in NPP trend (δ Trend) before and after the SHY in annual NPP. Roman numerals on the maps represent the temperate continental region (I), the temperate monsoonal region (II), the subtropical–tropical region (III) and the Tibetan Plateau (IV) for different climatic regions. The insert map in figure 2(a) shows whether the change in NPP trend is significant (blue) or not (yellow). All these markers apply to the following figures.
Download figure:
Standard image High-resolution imageAs the largest component of annual NPP, change features of summer NPP were similar to those of the annual value. More precisely, the acceleration of NPP growth was mainly concentrated in the boundary between the temperate continental region and the temperate monsoonal region as well as some parts of southern China. The regions with reduced growth rates after SHYs were centered in northeast and southwest China (figures 2(a), (b), 3(c), (d)). Although SHYs of summer and autumn NPP were different from those of the annual NPP, the spatial distribution of the regions where NPP growth was accelerated was highly consistent with the annual situation. Moreover, it was also noteworthy that the trends of autumn NPP were increased after SHYs in some parts of northeast and southwest China (figures 3(a), (b), (e), (f)). More detailed statistical results of phasic change features in four regions can be found in table S2.
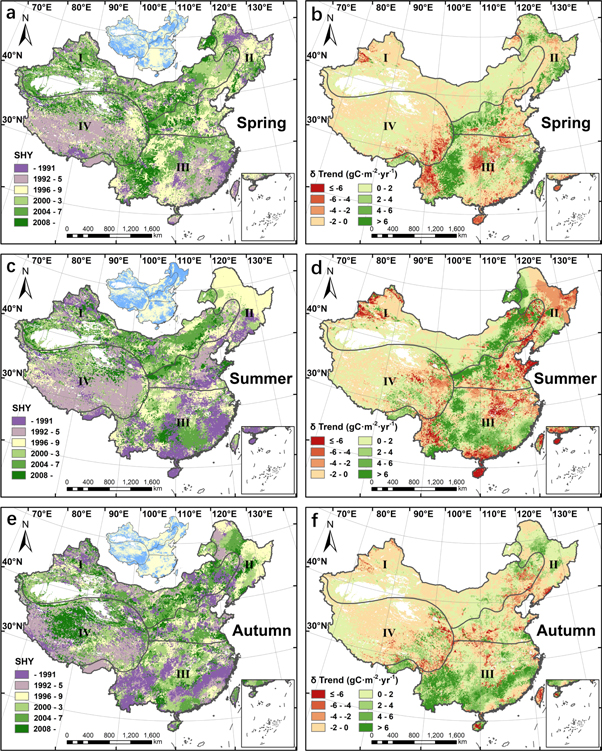
Figure 3. The spatial distribution of (a), (c) and (e) the SHY and (b), (d), and (f) the difference in NPP trend (δ Trend) before and after the SHY in seasonal NPP.
Download figure:
Standard image High-resolution image4. Discussion
4.1. Climate drivers of changes in NPP trends at the national scale
Our results confirmed the negative effect of the warming hiatus on NPP growth (He et al 2019). SHYs of annual, spring and summer NPPs all appeared in 1997 or 1998, which is similar to the time when global average temperature reached the peak (Easterling et al 2000, Karl et al 2000). Furthermore, the growth rate of annual temperature in China declined from 0.056 °C yr−1 before 1998 to 0.009 °C yr−1, and the NPP trend directly attributed to temperature changed from 9.429 to 1.004 TgC yr−1 in the meantime, which accounted for the largest part of the trend change (tables 1, 2).
Table 1. Trends of temperature (TEM), precipitation (PRE) and solar radiation (SOL) before and after SHYs in China.
| Trends before SHY | Trends after SHY | |||||
|---|---|---|---|---|---|---|
| TEM (°C yr−1) | PRE (mm yr−1) | SOL (MJ yr−1) | TEM (°C yr−1) | PRE (mm yr−1) | SOL (MJ yr−1) | |
| Year | 0.056 | 1.445 | 27.572 | 0.009 | 1.667 | 6.322 |
| Spring | 0.062 | 0.025 | 8.778 | 0.019 | 0.432 | 3.050 |
| Summer | 0.033 | 1.946 | 9.969 | 0.008 | −1.355 | 2.757 |
| Autumn | 0.009 | −3.131 | −3.830 | 0.036 | 0.797 | −1.017 |
Table 2. Contributions of temperature (TEM), precipitation (PRE) and solar radiation (SOL) to NPP trend before and after SHYs in China, together with the proportion of the NPP trend change attributed to each of these components (the change in contribution divided by the change of NPP trend).
| Contributions before SHY (TgC yr−1) | Contributions after SHY (TgC yr−1) | Proportion (%) | |||||||
|---|---|---|---|---|---|---|---|---|---|
| TEM | PRE | SOL | TEM | PRE | SOL | TEM | PRE | SOL | |
| Year | 9.429 | 0.435 | 10.639 | 1.004 | 1.871 | 6.277 | 87.0 | −14.8 | 45.0 |
| Spring | 5.250 | 0.016 | 1.995 | 0.603 | 0.260 | 1.797 | 117.1 | −6.1 | 5.0 |
| Summer | 1.732 | 1.925 | 4.968 | 0.082 | −0.371 | 3.739 | 25.2 | 35.1 | 18.1 |
| Autumn | 0.067 | −1.928 | −1.454 | 0.604 | 0.635 | −0.507 | 16.4 | 78.2 | 28.9 |
In contrast to temperature, China's annual, spring and autumn precipitation increased to varying degrees after SHYs, which created conditions for the acceleration of NPP growth. In autumn, especially, the precipitation trend increased from −3.131 mm yr−1 before 1992 to 0.797 mm yr−1, and its contribution increased synchronously from −1.928 to 0.635 TgC yr−1, which was up to 78.2% of NPP trend change. In contrast, precipitation, whose contribution was the largest among three climatic factors, was proven to be the main cause of decelerated summer NPP growth (tables 1, 2).
Some studies have shown that the increase in solar radiation can aggravate the water stress on vegetation growth in arid areas (Han et al 2012). However, once the influence of temperature was removed statistically, vegetation NPP typically had positive correlation with solar radiation (Wang et al 2017). In our case, annual radiation at the national scale increased by 27.252 MJ yr−1 before 1998 and by 6.322 MJ yr−1 afterwards, which made it another important factor, in addition to temperature, slowing down the annual NPP growth. Moreover, radiation also played a prominent role in shifting the trend of autumn NPP, with its contribution accounting for 28.9% of the value, second only to precipitation (tables 1, 2).
4.2. Regional difference of climate-related NPP phasic changes
Summarizing pixel-level results of multiple regression by region, we found marked spatiotemporal differences in the response of NPP trends to climatic factors (figures 4, 5). The warming hiatus was the main cause of the stalled annual NPP trend in all regions except for the Tibetan Plateau, where the proportion and amplitude of the reduction in temperature contribution were both at high levels (figure 4(a)). The trends of annual NPP were more sensitive to precipitation variation in the temperate continental region and the temperate monsoonal region, with the proportions of positive changes in both precipitation trend and its contribution reaching to 34.2% and 67.5%, respectively. In contrast, such response was relatively weak in the subtropical–tropical monsoonal region (figure 4(b)). In addition, our results indicated that solar radiation was the determinant of annual NPP change in the subtropical–tropical monsoonal region and the Tibetan Plateau because the proportions of changes with the same direction in trend and contribution were the highest among all three factors (figure 4(c)).
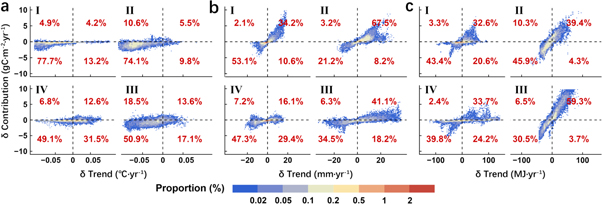
Figure 4. The impacts of (a) temperature, (b) precipitation and (c) solar radiation on the trend changes of annual NPP of China's terrestrial ecosystems. In each subplot, the horizontal axis represents the trend difference of a certain climatic factor before and after the SHY; the vertical axis represents the change in contribution of that climatic factor to the NPP trend; Roman numerals at the top left corner represent the four different climatic regions; the percentage in red is the proportion falling into a certain quadrant.
Download figure:
Standard image High-resolution image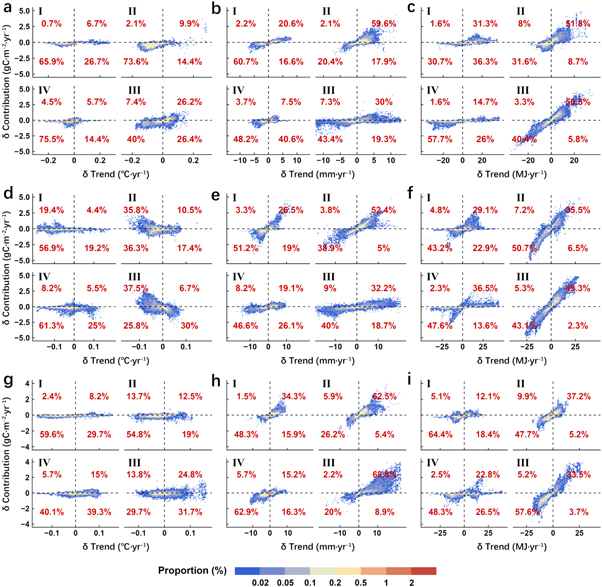
Figure 5. The impacts of (a), (d) and (g) temperature, (b), (e) and (h) precipitation and (c), (f) and (i) solar radiation on the trend changes of (a)–(c) spring, (d)–(f) summer and (g)–(i) autumn NPP in China's terrestrial ecosystems. For the explanations on the figure legends, numbers and symbols, see figure 4.
Download figure:
Standard image High-resolution image
Due to the differences in climatic conditions, NPP trend also had some seasonal characteristics in response to the changes in various factors (figure 5). Warming can advance the onset and delay the end of the growing season in cold areas, increasing NPP (Myneni et al 1997, Richardson et al 2010). For this reason, in the Tibetan Plateau, the region where vegetation growth is chronically restricted by temperature, the proportion of the decreased NPP trend caused by the warming hiatus in spring and summer was highest among all regions (figures 5(a), (d)). The high values of this proportion in the temperate monsoonal region during spring and summer as well as in the subtropical–tropical monsoonal region during summer also implied that the warming hiatus indirectly influenced the change in the NPP trend by regulating the length of the growing season (figures 5(a), (d), (g)). However, warming hiatus was found to facilitate summer NPP growth in two monsoonal regions, for the regions with negative changes in temperature trend and positive changes in contribution accounted for 35.8% and 37.5% of the total areas respectively (figure 5(d)). This suggested that the warming hiatus could partially alleviate the inhibition of vegetation growth caused by summer drought (Zhao and Running 2010). It is noteworthy that in the temperate continental region where vegetation growth is theoretically susceptible to water, the proportion of negative changes in both summer temperature trend and contribution remained considerable (56.9%) (figure 5(d)). The reasons for this are two-fold. First, the elevation of this area is high, and vegetation growth is still mainly limited by temperature. Second, the rising temperature may increase the amount of water available, as glacier melting is a key source of water other than precipitation in this region (Barnett et al 2005, Zhang et al 2016).
The regional scale analysis results showed that the increase in autumn precipitation in recent years was mainly caused by the strengthening of the East Asian monsoon (figure 5(h)), which was consistent with numerous predictions based on climate models (Bao 2012, IPCC 2013). Increased monsoonal precipitation had become the most important factor triggering the acceleration of autumn NPP growth in Eastern China. The proportion of positive changes in both trend and contribution was up to 68.8% in the subtropical–tropical monsoonal region and was 62.5% in the temperate monsoonal region (figure 5(h)). Precipitation is the key factor limiting photosynthesis in the growing season (Poulter et al 2014, Ahlström et al 2015). Moderate increases in precipitation can promote vegetation growth. While excess rainfall, on the one hand, may cause water-logging, resulting in a severe oxygen deficiency in the root zone and the decline in NPP, and on the other hand, it may indirectly affect carbon sequestration of plants by weakening solar radiation (Perata et al 2011, Liu et al 2018). Therefore, in the subtropical–tropical monsoonal region with abundant rainfall, NPP trends in spring and summer were not sensitive to the change in precipitation, and the proportions of opposite changes in trend and contribution were also larger than that in autumn (figures 5(b), (e), (h)). However, although the relationships between precipitation trend and contribution in spring and summer were consistent in this region, their causes were different (figures 5(b), (e)). Under the influence of Indian Ocean monsoon, spring precipitation accounts for a small part of the annual total in southwest China (Yu et al 2018). As a result, vegetation growth there is limited by water in spring and is likely to be inhibited in summer due to excess precipitation. By comparison, the distribution of seasonal precipitation is more balanced in southeast China, where it is controlled by the Pacific monsoon (Yang and Lau 2004). Thus, vegetation growth in this region may experience a water deficit in summer due to extensive evaporation. Multiple regression results based on standardized data fully confirmed the above viewpoint. The responses of NPP to increasing precipitation were exactly opposite in spring and summer (figure S4).
The impacts of solar radiation on vegetation growth were two-sided. A strong positive correlation between the changes in solar radiation and contribution was found in the subtropical–tropical region. Especially in spring and summer, the contributions of solar radiation to the NPP trend were much higher than those of other climatic factors (figures 5(c), (f)). In contrast, the increase in solar radiation inhibited on NPP growth in the western part of China, and the proportions of opposite changes in trend and contribution were higher than those in the eastern part (figures 5(c), (f), (i)). Such spatial differences were probably related to the level of radiation (figure S5). Under low exposure, the increase in solar radiation has more of a promoting effect on vegetation growth than inhibitory effect. However, when the level is high, the opposite is true.
4.3. Human activity and the changes in NPP trends
In recent years, human activity, mainly in the form of afforestation and grass planting, is profoundly affecting the carbon sequestration functioning and patterns of terrestrial ecosystems in China (Fang et al 2014, Lu et al 2018). Accordingly, the spatial distribution of several major ecological projects was collected and used to explore the connection between the implementation of these projects and the phasic change in annual NPP (figures S6, S7). The results showed that the start time of projects was partially consistent with SHYs of annual NPP. The regions where the absolute values of time difference were less than three accounted for 38.2% of the project area (figure S7(a)). In addition, the positive proportion and the median value of NPP trend changes were both higher than those in other regions (figure S7(b)). Further calculation showed that the regions with increased NPP trends after the implementation of projects accounted for 63.8% of the project area, but only 8.9% of these relationships were significant (figures S7(c), (d)), which indicated that these ecological projects played limited roles in promoting NPP growth. Moreover, significant stalled trends of NPP in parts of northwest China also confirmed that unsuitable restoration projects might harm local vegetation (figures S7(c), (d)) (Feng et al 2015).
4.4. Analysis of uncertainty
In order to identify climatic or anthropogenic drivers controlling the changes in the NPP trends, it is necessary to exclude the effect of the potential inconsistency of GIMMS NDVI dataset (Tian et al 2015). The T-test was carried out to compare the 5-year average NDVI at the national scale around the year 2000, because the sensor was changed from AVHRR-2 to AVHRR-3 (figure S8) at around the year. The result indicated that there was no significant difference between the two values (t = 1.030, p > 0.05) and the dataset was continuous in 2000. We also applied piecewise regression to the sequence of NDVI, and found that the SHY appeared in 1990, which was consistent with the previous study by Peng et al (2011) and was different from that of NPP (1998) (figures 1, S8). Therefore, the potential inconsistency of GIMMS NDVI is likely playing a limited role in triggering the shifting of NPP, while climate changes and human activities could be the key factors. Additionally, we blended different NPP products to verify the stability of SHY. Using the combined sequence which consists of CASA NPP (1982–1999) and corrected MODIS NPP (2000–2014), we found that the SHY of annual NPP still appeared in 1998 (figure S9). This result also suggested that spectral data itself didn't significantly influence the SHY of NPP.
5. Conclusions
Using piecewise regression and multiple regression models, we studied the features and causes of phasic changes in China's NPP between 1982 and 2015 at different temporal and spatial scales. Our results indicated that changes in NPP trends were widespread and their causes had apparent spatiotemporal heterogeneity. Our findings can be summarized as the following three points. First, the growth of annual, spring and summer NPP stalled in 1997 and 1998, and the trend of autumn NPP increased in 1992 at the national scale. Second, the changes in NPP trends were more sensitive to the warming hiatus in spring and autumn, as well as in the temperate monsoonal region and the Tibetan Plateau. While the accelerated growth of autumn NPP in eastern China was strongly coupled with increased monsoonal precipitation. Finally, although the starting time of the ecological restoration projects was partially consistent with the SHYs of NPP, these projects played limited roles in promoting NPP growth.
Although we provided sufficient evidence and systematic attribution for the changes in the trend of vegetation NPP in China, the following two limitations still exist in our work: (1) the potential lag responses of NPP to the climate changes and human activities were not considered; and (2) we did not evaluate the impacts of other global change factors, such as CO2 enrichment, nitrogen deposition, and air pollution, on the changes in the NPP trends. More data and advanced methods should be introduced to the future study to improve the above deficiencies.
Acknowledgments
This work was supported by the National Key Research and Development Program of China (2017YFC0503906). We thank Shaopeng Wang and Haojie Su for their helpful suggestions for data analysis. The authors declare no competing interests.
Data availability statement
The data that support the findings of this study are available from the corresponding author upon reasonable request. The data are not publicly available for legal and/or ethical reasons.