
Abstract
One of the keys behind the success of modern semiconductor technology has been the ion implantation of silicon, which allows its electronic properties to be tailored. For similar purposes, heteroatoms have been introduced into carbon nanomaterials both during growth and using post-growth methods. However, due to the nature of the samples, it has been challenging to determine whether the heteroatoms have been incorporated into the lattice as intended. Direct observations have so far been limited to N and B dopants, and incidental Si impurities. Furthermore, ion implantation of these materials is challenging due to the requirement of very low ion energies and atomically clean surfaces. Here, we provide the first atomic-resolution imaging and electron energy loss spectroscopy (EELS) evidence of phosphorus atoms in the graphene lattice, implanted by low-energy ion irradiation. The measured P L2,3-edge shows excellent agreement with an ab initio spectrum simulation, conclusively identifying the P in a buckled substitutional configuration. While advancing the use of EELS for single-atom spectroscopy, our results demonstrate the viability of phosphorus as a lattice dopant in sp2-bonded carbon structures and provide its unmistakable fingerprint for further studies.
Export citation and abstract BibTeX RIS

Original content from this work may be used under the terms of the Creative Commons Attribution 3.0 licence. Any further distribution of this work must maintain attribution to the author(s) and the title of the work, journal citation and DOI.
Introduction
The implantation of crystalline silicon with ions of boron, phosphorus and arsenic forms the foundation of the modern semiconductor industry, and is a key technology behind the proliferation of computing in the modern world. However, the limits of miniaturization with this material are being reached, prompting interest in nanomaterial alternatives such as single-walled carbon nanotubes (SWCNTs) and graphene. Both have superb intrinsic properties, but also challenges: nanotubes are produced as a mixture of semiconducting and metallic species [1], whereas graphene lacks a band gap [2].
Much effort has been directed to controlling the electronic properties of these materials. Over the last decade, significant progress has been made in the purification and separation of nanotube samples [3], and notable successes reached in their incorporation into electronics [4]. In the case of graphene, efforts have been directed into opening a gap and to tuning the carrier concentration, for example by cutting graphene into nanoribbons [5], via strain [6], by building van der Waals stacks [7], and through chemical functionalisation [8]. Doping the structure with heteroatoms, either by introducing a precursor during growth or by post-growth processing such as ion implantation, is a particularly prominent route of the latter kind for both nanotubes and graphene [9, 10]. However, despite the general maturity of ion implantation as a doping technique, only the implantation of N and B into carbon nanomaterials has been verified by direct observation [11–13].
Although phosphorus (P) was proposed as a possible electronic donor already early on [14], the first experimental reports on doping graphitic materials with it were published relatively recently [15–20]. Like nitrogen, phosphorus has five valence electrons, but on the third electron shell, yielding a significantly larger covalent atomic radius (106 pm, compared to 82 pm for B, 77 pm for C, and 75 pm for N). Based on density functional theory (DFT) simulations, it is expected that P will predominantly bond to three C neighbors, but buckle significantly out of the plane [21–23] similar to Si, where the spectroscopic signature of this buckling has been unambiguously identified [24].
A commonly used tool for studying heteroatom doping is x-ray photoelectron spectroscopy (XPS), since the core level binding energies it measures are fingerprints of different chemical species [25]. Unfortunately, the very low amount of dopant atoms corresponding to even relatively high concentrations, along with the synthesis byproducts and contamination inevitably present, make it challenging for macroscopic characterization techniques to conclusively prove the incorporation of dopants into the lattice. Only when using carefully purified materials can there be a high degree of confidence that the spectroscopic signatures originate from heteroatoms in the lattice itself [26]. Even then, it is not straightforward to tease out their exact bonding, which is only indirectly possible by comparison to known references or simulations [27].
Krstič and co-workers have suggested that P substitutions are readily oxidized in ambient, with the P–O bond formation predicted to be exothermic by as much as 3.3 eV [18]. This found recent support from a study of carefully purified P-doped single-walled carbon nanotubes, which found a decrease of the XPS signal assigned to oxidized P upon vacuum annealing [26]. However, even though these samples were a significant advance over previous studies, direct evidence for the incorporation of phosphorus into the lattice remains lacking.
Scanning tunneling microscopy is a powerful tool for local characterization, and even though it lacks direct chemical sensitivity, it has been used to confirm the local bonding of N and B heteroatoms in graphene [13, 28], and N in SWCNTs [29]. Recent advances in aberration-corrected scanning transmission electron microscopy (STEM) [30] have similarly enabled the identification of individual atoms in low-dimensional materials such as graphene [31]. When atomic resolution STEM is used for electron energy loss spectroscopy (EELS) [32, 33], even the precise nature of the atoms' bonding can now be resolved with the help of first principles simulations [32, 34]. Hitherto, this method has been used to confirm lattice doping with both nitrogen and boron [11, 12, 35] as well as the lattice incorporation of the ubiquitous contaminant, silicon [24, 36, 37]. However, direct evidence for the lattice doping of sp2-bonded carbon with any other element has not been reported until now.
Results and discussion
To directly demonstrate the incorporation of phosphorus, we implanted low-energy P ions into commercial monolayer graphene (Quantifoil® R 2/4, Graphenea) in a mass-selected ion beam deposition system [11]. Before inserting the samples into the deposition chamber, they were baked on a hot plate in air at 400 °C for 15 min in an attempt to reduce contamination. The source of phosphorus was a hot filament hollow cathode plasma ion source (Model SO-55, High Voltage Engineering) with an oven containing a small amount of red phosphorus. For the implantation, a 30 keV mass-selected 31P+ ion beam was first deflected to eliminate any neutralized ions and decelerated toward the sample. The deceleration bias voltage was set relative to the ion source anode potential, resulting in a maximum ion energy of 30 eV (with a few eV tail toward lower energies). The samples were irradiated in a  Pa vacuum at room temperature with a fluence of (4 ± 1) × 1014 cm−2.
The ion energy of 30 eV was chosen in an effort to obtain substitutions without causing significant damage. Based on the conservation of momentum and energy, 31P with a kinetic energy of 30 eV can transfer a maximum of 26.22 eV to 12C in a head-on collision. The displacement threshold energy is the minimum energy required to remove an atom from the material, and in graphene it is 21.14 eV [38]. The energy remaining after an impact should not be enough for the P ion itself to escape, especially considering that for most impact parameters the transferred energy is lower than the maximum. Our chosen ion energy should thus be a conservative estimate.
We observed the samples in a Nion UltraSTEM100 microscope operated at 60 keV in near-ultrahigh vacuum. Our beam convergence semiangle was 30 mrad and our medium angle annular dark field (MAADF) detector angular range 60–200 mrad (we found a much improved signal-to-noise ratio using the MAADF detector instead of HAADF typically used in conjunction with EELS). As a general observation, the sample surfaces were heavily covered by contamination (figure 1(a)), with the largest clean areas that we could find only a few nanometers in size (figure 1(b)). This is likely due to contamination introduced during the ion implantation process itself, along with the pinning of atmospheric contamination on chemically reactive dopant and defect sites. Of the areas that could be imaged, most contained no discernible dopants (figure 1(c)). However, we did find several small clean areas with heavier atoms incorporated into the lattice, including a slightly disordered area with several heteroatoms (figure 1(d)) and a clear instance of a single substitution that we will discuss later.
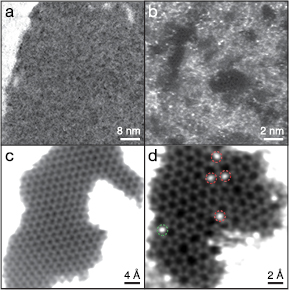
Figure 1. Overview STEM/MAADF images ( px) of the graphene sample implanted with 30 eV 31P+ ions. (a) Throughout the sample, the graphene surfaces were almost completely covered by dirt. (b) Despite extensive searching, the largest clean areas that we found were only a few nm in size. The contamination layers contain many heavier atoms. (c) Of the clean monolayer areas, most did not contain any discernible dopants or defects. (d) In some cases, disordered areas with many heavier atoms incorporated into the lattice could be found. However, most are Si (red dashed circles) instead of P (green dashed circle) (see text). Panels (c) and (d) have been treated for clarity by Gaussian blurs with radii of 8 and 5 px, respectively.
Download figure:
Standard image High-resolution imageAlthough the STEM annular dark field detector signal is sensitive to atomic number in so-called Z-contrast [30], the case of P dopants in graphene is complicated due to the ubiquitous presence of Si contaminants [24, 37] that have almost the same number of protons. While the contrast difference is detectable, it is challenging to discriminate between the two atomic species without spectroscopy. Our EELS acquisition setup consists of a Gatan PEELS 666 spectrometer retrofitted with an Andor iXon 897 electron-multiplying charge-coupled device (EMCCD) camera. A spectrum image can be acquired by sending a synchronization signal from the Nion Swift microscope control software (www.nion.com/swift) to the camera via a custom-installed Rasperry Pi minicomputer. The energy dispersion was 0.73 eV pixel−1 (resulting in an expected instrumental broadening of ∼0.7 eV), the beam current was close to 30 pA, and the EELS collection semiangle was 35 mrad.
It is possible to identify the five heteroatoms of figure 1(d) by comparing their relative intensities to a quantitative STEM image simulation of graphene with separated single Si and P atoms. For this, we used the QSTEM software package [39] with our instrumental parameters (chromatic aberration coefficient 1 mm, energy spread 0.3 eV; spherical aberration coefficient 1 μm; thermal diffuse scattering included via frozen phonon modeling at 300 K; additional instabilities (such as sample vibration) simulated by blurring the resulting image (Gaussian kernel with a sigma of 0.39 Å); and the MAADF detector angle range set to the experimental range of 60–200 mrad).
From the simulation, we find that P is expected to be 1.11 times brighter than Si, corresponding to a contrast of approximately Z1.71 [30]. The four atoms marked by red dashed circles in figure 1 have relative intensities of 1.000 ± 0.023, whereas the one marked with the green dashed circle is brighter than the others with a relative intensity of 1.083 ± 0.018, consistent with being P. EELS measured over the bright atoms are shown as figure 2, also clearly indicating that four of the atoms are Si and only one is P. Even if this P atom was oxidized in the beginning of the experiment, since a 60 keV electron can transfer up to 8.7 eV to an O atom in a head-on collision, we would not expect it to stay bound under the intense electron irradiation (similar to O in graphene oxide [40]). The O K-edge spectra shown in supplementary figure 1 (stacks.iop.org/TDM/4/021013/mmedia) likewise only exhibit an O signal over the contamination layers.
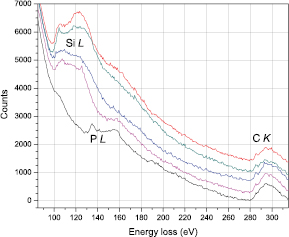
Figure 2. Spot EELS (0.5 s each) measured over five bright atoms incorporated into the graphene lattice (figure 1(d)). The first four show a clear Si L-edge, while the fifth one displays a P L-edge instead. The spectra have been offset for clarity.
Download figure:
Standard image High-resolution imageUnfortunately, the atomic configuration of this disordered patch was not stable enough due to beam-induced bond rotations [37, 41] for us to capture higher quality spectra. The instability of Si and P dopant sites is not surprising, since 60 keV electrons can transfer enough energy to the C atoms neighboring them to cause displacements or bond rotations. For Si, we previously calculated the C neighbor displacement threshold energy to be in the range [16.75,17.00] eV ([37]). Using the same DFT molecular dynamics methodology, we find the same threshold for displacing a C next to a substitutional P. These thresholds are for momentum transfers perpendicular to an otherwise perfect graphene lattice, and are thus very likely overestimates for a disordered area. Both Si and P are too heavy to be directly displaced from the lattice by electrons with this much energy.
We thus searched for a clear example of a P substitution, and found a single heteroatom in an otherwise pristine lattice (figures 3(a) and (b)). Apart from its brightness, a P substitution appears very similar to C in a projected image. However, our DFT simulation (figure 3(c)) indicates it buckles 1.467 Å out of the graphene plane, resulting in P–C bond lengths of 1.759 Å (figure 3(d); similar to [22, 23]). To confirm the identity of this atom and its bonding, we recorded a  pixel EELS spectrum map with a dwell time of 50 ms per pixel for a total acquisition time of 51.2 s (figure 4). Notably, there was hardly any stage drift during the acquisition, nor any increase in intensity that would correspond to contamination added during the scan. To subtract the low-loss background, we fitted a first degree log-polynomial [42] to the spectrum preceding the P edge. The P L2,3-edge starting at ∼130 eV is localized within ∼3 Å of the atomic site [43], whereas the C K-edge appears over the entire mapped area.
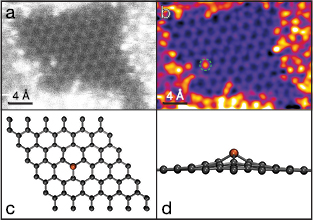
Figure 3. A substitutional P atom in graphene. (a) Cropped unprocessed STEM/MAADF image. (b) The same image colored and filtered with a double Gaussian procedure [30] ( px,
px,  px, weight
  ), with the P atom indicated by the dashed green circle. (c) Relaxed model structure of a P substitution in a
  graphene supercell. (d) Side view of the model structure.
Download figure:
Standard image High-resolution image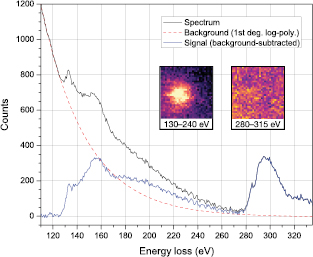
Figure 4. EELS spectrum averaged from  pixels over the substitutional P dopant (figures 3(a) and (b)) shown in the overlaid spectrum map (frame size
  nm2, energy windows from 130–240 eV and 280–315 eV for the P L2,3 and C K-edges, respectively, colored with the ImageJ lookup table 'mpl-magma'). The black line is the original spectrum, red is a background fit using a 1st degree log-polynomial, and blue the resulting signal.
Download figure:
Standard image High-resolution imageFor EELS simulations [44], we used DFT implemented with self-consistently-generated on-the-fly pseudopotentials in the CASTEP package [45]. The structure was relaxed using a TS-corrected [46] Perdew–Burke–Ernzerhof (PBE, [47]) functional with a plane-wave cutoff energy of 600 eV and k-point spacings 
 in a
in a  graphene supercell with a lattice parameter of 2.46668 Å and 20 Å of perpendicular vacuum. The simulation allows us to address the charge state of a phosphorus dopant, which has raised some debate. It has been suggested that P will either act as a net donor [18], or that it will bond in sp3 hybridization creating a nondispersive localized state [22]. Based on Bader analysis [48] of the all-electron density derived from our DFT simulation, the P is found to donate 1.79 electrons, with its three C neighbors receiving 1.68. Thus even at zero Kelvin there is indication of charge transfer to the lattice.
The P L2,3- and C K-edge spectra were calculated by evaluating the perturbation matrix elements of the transitions from the P 2p and C 1s core states to the unoccupied states calculated up to 3204 bands. Notably, we used no explicit core hole [49], as this has been found to result in significantly better agreement with experimental spectra [12, 24]. The resulting densities of state were broadened using the OptaDOS package [50] with a 0.7 eV Gaussian instrumental broadening and additional semi-empirical 1.26 eV Lorentzian lifetime broadening for the P L2,3-edge and 0.17 eV for the C K-edge [51]. The theoretical spectra were then rigidly shifted along the energy axis to achieve the best fit and normalised to the experimental signal.
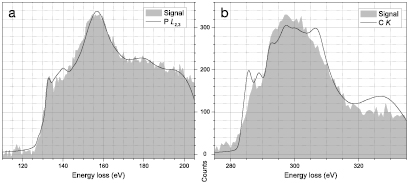
The close agreement between the simulated P L2,3 spectrum and the experimental signal (figure 5(a)) proves that the measured atom is P in the buckled [24] substitutional configuration; the only small disagreement is the absence of the small peak around 140 eV. To conclusively rule out the metastable planar bonding, we also simulated its spectrum (supplementary figure 2) where we can see that the  peak is overestimated and the maximum of the
  response is ∼5 eV too high in energy. The inclusion of the P L1 response (supplementary figure 2), expected to show a weaker intensity due to its lower inelastic cross section and possible suppression by our scattering geometry [43], would seem to overestimate the intensity starting from its edge onset around 176 eV.
Figure 5. The measured background-subtracted EELS signal (filled gray areas) together with simulated responses (black lines). (a) The P L-edge, with simulated P L2,3 spectrum of the DFT-relaxed buckled P substitution. (b) The C K-edge with the simulated C K spectrum (average up to second-nearest C neighbor to P).
Download figure:
Standard image High-resolution image
A simulated C K spectrum of a C neighbor to the P with a Gaussian broadening of 0.7 eV agrees poorly with the experimental signal, showing multiple sharp peaks in the  region (supplementary figure 3(a)). Since the localization of the C K-edge is expected to be ∼3 Å [43], the signal must contain a significant contribution from beyond the nearest C neighbors. Averaging up to the second-nearest neighbors does improve the match (supplementary figure 3(a)), but the spectral features still appear sharper than in the experimental signal. By varying the Gaussian broadening (supplementary figure 3(b)), we find the best overall agreement with 1.8 eV (figure 5(b); this may be due to poor focusing of our electron optical system near the right edge of our camera). The
  response still seems to be 'split' compared to the experimental one, and the last
  peak is missing from the signal (similar to a C neighbor to N [12]). Despite these discrepancies, the overall agreement with the C K-edge signal is satisfactory.
Why were most of the heteroatoms we could observe in the lattice Si and not P? The ion beam itself is strictly mass-selected, and there is no Si in the ion source materials. One possible explanation is that due to their extra valence electron, the implanted P atoms are more chemically reactive than Si and thus more efficient in attracting the obscuring contamination. Another possibility would be that the P ions were mostly causing displacements instead of substitutions, which then get filled by the ubiquitous mobile Si contaminants present in graphene samples [37]. Although no interatomic P–C potential is unfortunately available to estimate the optimal energy for achieving the highest probability of substitutions, for Si this was recently calculated using molecular dynamics simulations [52] to be around 50–70 eV. Differences in the valence electron structure ( ) and atomic mass (
 ) notwithstanding, it would be quite surprising if P ions of only 30 eV would predominantly cause damage.
Conclusions
We have implanted graphene with phosphorus ions, and shown incontrovertible spectral evidence of the expected buckled substitutional configuration. However, working with phosphorus is challenging, since contamination layers introduced during implantation cover most of the graphene surface, and Si atoms contained therein can be easily mistaken for P if they find their way into the lattice. Nonetheless, ion implantation is a feasible route to this novel doped material, and the P L2,3-edge spectrum with an edge onset at ∼128 eV, a  peak at ∼135 eV, and a
  maximum at ∼158 eV will conclusively identify the heteroatom in further chemical synthesis studies.
Acknowledgments
TS acknowledges the Austrian Science Fund (FWF) for funding via project P 28322-N36, and the Vienna Scientific Cluster for computational resources. TPH acknowledges the Engineering and Physical Sciences Research Council (EPSRC) Doctoral Prize Fellowship that funded this research, and the ARC1 and ARC2 high-performance computing facilities at the University of Leeds. AM and JCM acknowledges funding by the FWF project I1283-N20, and JCM and CM by the European Research Council Grant No. 336453-PICOMAT. TJP was supported by the European Union's Horizon 2020 research and innovation programme under the Marie Sklodowska-Curie grant agreement No. 655760-DIGIPHASE, and JK by the Wiener Wissenschafts-, Forschungs- und Technologiefonds (WWTF) via project MA14-009.