
Abstract
Hybrid aluminum matrix composites (HAMCs) are a new class of advanced composite and hybrid materials that can be customized and engineered to achieve specific properties for specific applications in specific environments. HAMCs are popular in the transportation industry due to their reduced cost and fuel consumption as compared to conventional materials. This research article has mainly focused on multi-response optimization through an L16 orthogonal array experimental design employing Taguchi-based Grey Relational Analysis. It was intended to explore the influence of tetra hybrid reinforced HAMCs synthesized using pure Al matrix with fixed wt% of primary reinforcements (5 wt% SiC and 5 wt% Al2O3) and varying wt% of secondary reinforcements such as (0.5, 2.5, 4.5, and 6.5) wt% of Gr and (0.5, 2.5, 4.5, and 6.5) wt% of SCBA on physicomechanical properties of HAMCs when milling time, compaction pressure, and sintering temperature were varied. The Taguchi-Grey's relational analysis gave the optimal combination of the process and reinforcement parameters for both the physical and the mechanical properties such as milling time (5 h.), compaction pressure (55 MPa), sintering temperature (450 °C), Gr content (0.5 wt%), and SCBA content (4.5 wt%). At the optimum parameter settings, the average density, porosity, hardness, compressive strength, and ultimate tensile strength were 2.5118 gm cm−3, 0.8653%, 4228.45 MPa, 343.33 MPa, and 1516.41 MPa, respectively. The utilization of Taguchi and GRA methods have significantly confirmed that the influence of compaction pressure was highest among the all the other four parameters. The newly synthesized tetra hybrid reinforced HAMCs have shown superior physicomechanical properties compared to pure Al, and single as well as double reinforced HAMCs. Therefore, it is anticipated that the newly developed tetra hybrid reinforced AMC material will be utilized in heavy-duty, aerospace, medical, automotive, marine, and other applications.
Export citation and abstract BibTeX RIS

Original content from this work may be used under the terms of the Creative Commons Attribution 4.0 licence. Any further distribution of this work must maintain attribution to the author(s) and the title of the work, journal citation and DOI.
1. Introduction
Lightweight, low-cost materials with excellent mechanical and tribological properties have been the focus of recent engineering applications [1]. Aluminum matrix composites (AMCs) are used extensively in the aerospace, marine, defense, and automotive industries, where high stiffness, high strength, high fatigue resistance, low density, and low wear properties are required [2]. Hybrid-reinforced aluminum matrix composites (HRAMCs) with two or more reinforcements have the potential to fulfill the requirements of industrial applications [3]. Two or more different materials are combined to make composite materials [4]. The basic starting materials have different properties, and their amalgamation gives an entirely new material. It has unique, entirely new, and different properties compared to its constituent components. The aim is to improve the mechanical, structural, tribological, thermal, chemical, wear, and corrosion characteristics of individual materials [5]. The components do not dissolve chemically since two or more phases are clearly distinguished within the composite [6]. By dispersing reinforcement material into a metal matrix, metal matrix composites (MMCs) can be created, and the resulting composite materials possess outstanding properties [4]. Al or its alloys serve as a matrix for AMCs, which are reinforced with hard ceramic materials such as SiC, Al2O3, B4C, Ti2B, TiC, and ZrO2, as well as other industrial waste including bagasse ash [7–10]. Hard ceramic materials dispersed in an Al matrix improve the material's strength, hardness, wear and corrosion resistance, stiffness, and thermal stability [11–14]. Due to their widespread applications in fabricating automotive parts (e.g., brake discs, drums, back-plate, engine block, piston, and gearbox parts) [15–18], aerospace (e.g., fan exit guide vane in a gas turbine engine, rotating blade sleeves in helicopters, and flight control hydraulic manifolds) [19–21], and biomedical devices, other industries, researchers primarily focused on AMCs. Stir casting, one of the traditional AMC fabrication methods, has problems such as voids, wettability, a chemical reaction between matrix and reinforcement, and so on [6, 22–24].
Powder metallurgy has proven to be one of the most effective methods for overcoming these constraints. Another benefit of this method is that the processing temperature is smaller than that of the constituents' lower melting temperatures, and it can produce quality products at an affordable cost [25, 26]. Compared to other traditional manufacturing methods such as casting, machining and forging, powder metallurgy is an energy-saving, green technology process that allows for complex designs [27]. In the large-scale production of automobile components, powder metallurgy is critical. Powder, which can be a pure metal, a blend, or an alloy, is used in the powder metallurgy technique. Milling, compacting, and sintering are the three major processes in powder metallurgy. Homogeneous distribution will be achieved by milling, reinforcement, and matrix powders of various sizes and shapes, and porosity will be reduced [28]. To reduce friction, solid lubricants like Gr are added during the blending process [26, 29]. The powders are compacted into a green body using a punch-and-die setup in the pressing process [30]. Cold isostatic and hot isostatic pressing are by far the most widely accepted compaction methods [31]. Sintering is a solid-phase bonding process that involves heating the green body in a furnace. Sintering processes include solid-state sintering, liquid-phase sintering, activated sintering, microwave sintering, and spark plasma sintering [31, 32]. Furthermore, it has been discovered that the costs and mass of AMCs might well be significantly reduced by the use of hybridized reinforcements without affecting the tribological performance.
Some of the hard filler particles that are applied to the Al matrix to increase its mechanical strength and wear resistance include SiC and Al2O3 [33, 34]. However, the usage of single reinforcing particles in an Al matrix might occasionally compromise physicomechanical property values. Primarily, these reinforcing particles are denser than the Al matrix, increasing the AMCs' density. Secondly, ceramic particles are extremely hard, and their abrasive effect increases the tool wear of the mating counter-faces. As a result, such additions diminish the tribosystem's wear resistance while increasing the wear resistance of the AMCs [35]. Thirdly, the inclusion of hard particles raises the hardness of the composites, making AMC machining harder. As a result, it is critical to develop solutions to maintain the favorable effect of ceramic particles while also addressing these issues [36]. Secondary reinforcement is particularly suited for many applications, and its inclusion may make AMC design more versatile and robust. According to a recent HAMC study, the incorporation of Gr particles can reduce composite wear, whilst agro/industrial waste materials such as sugar cane bagasse ash can be employed to reduce cost and provide lightweight applications [37].
Some recent researchers have investigated the use of various methodologies such as Taguchi, response surface methodology, full factorial, analysis of variance (ANOVA), and design of experiments (DOE) for carrying out the synthesis of MMCs utilizing either monolithic or hybrid reinforcements [34, 38–40]. According to the previous studies, the Taguchi-GRA approach was employed to optimize the physical and mechanical parameters of HAMCs [41]. To evaluate multi-response parameters like porosity and hardness, Wahyudie, I.A., et al [42] used a Taguchi-orthogonal L9(34) array in combination with grey relational analysis. The porosity quality was 'smaller the better,' and the hardness quality was 'bigger the better.' The compaction pressure at 400 MPa, the temperature at 350 °C, the particle size at 80 μm, and the particle content at 12 wt% were the optimal parameter settings in this study. As a result, temperature and particle size may be set to the lowest possible level, while compaction pressure and particle content can be set to the maximum possible level. Furthermore, according to percentage contributions, the compaction pressure had a significant impact on reducing porosity and raising hardness. The majority of prior multi-optimization studies used no more than two to four parameter settings and evaluated single and double-reinforced metal matrix composite materials. Almost no research has been done on the optimization of the physical and mechanical characteristics of pure aluminum with tetra-hybrid reinforcement of SiC, Al2O3, Gr, and sugar cane bagasse ash (SCBA). As a result, the Taguchi and GRA techniques at L16 orthogonal array experimental design were employed in this work to optimize the responses of both physical and mechanical tests performed by adjusting control factors such as powder metallurgical process parameters and wt% of secondary reinforcements.
The aim of this study is to produce HAMC materials that have improved physical and mechanical properties by adding SiC and Al2O3 ceramics as primary reinforcement, Gr, and SCBA as secondary reinforcement to pure Al metal, which has good machinability and extrudability and also has light weight. In this study, four reinforcements were used to synthesize, characterize, and test the physicomechanical behavior of the HAMCs using the powder metallurgy process: SiC and Al2O3 ceramics as primary reinforcement, Gr, and SCBA as secondary reinforcement, and pure Al as the matrix. Studies on density, porosity, microhardness, compressive strength, and tensile strength were conducted on the synthesized tetra hybrid reinforced AMCs using the Taguchi-based Grey Relational Analysis technique [43].
2. Materials and methods
2.1. Particulate reinforcements utilized in the fabrication of HAMCs
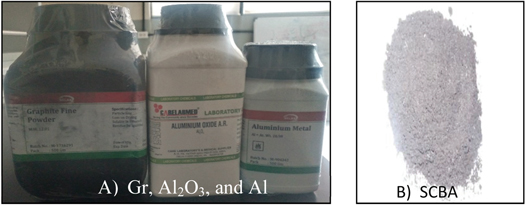
The cost of the particulate-reinforced composites (SiC, Al2O3, and Gr) is less than the fiber-reinforced composites, due to the lower cost of particles [44]. Moreover, the physicomechanical, tribological, and corrosion properties of particulates are generally isotropic. In this research work, four different particulates, namely; SiC, Al2O3, Gr, and SCBA (see figure 1) are used as reinforcement materials. Table 1 provides the raw materials' physicomechanical properties and the rationale for their selection in order to create HAMC materials, which may exhibit superior characteristics to those of the individual components and are anticipated to be a potential candidate material for use in aerospace, automotive, marine, and biomedical applications [26].
Download figure:
Standard image High-resolution imageTable 1. Physicomechanical properties of the raw materials. Reproduced from [26]. CC BY 4.0.
| Materials | Al (pure) | SiC | Al2O3 | Gr | SCBA |
|---|---|---|---|---|---|
| Appearance (form) | White powder | Dark gray powder | White powder | Black powder | Black-gray |
| Density (g cm−3) | 2.7 | 3.2 | 3.96 | 1.8 | 0.8–1.477 |
| M.W. | 26.98 | 40.096 | 101.96 | 12.01 | NA |
| Melting pt. (°C) | 660 | 2730 | 2054 | 3652–3697 | 1350 |
| Particle size (μm) | 45 | 45 | 45 | 45 | 45 |
| Vickers hardness (MPa) | 167 | 20 000–27 000 | 11 000–17 000 | 67 | NA |
| Compressive Strength (MPa) | 110 | 2800 | 2500 | 20–200 | NA |
| Tensile Strength (MPa) | 130–195 | 310 | 221 | 3–33 | NA |
| Young's Modulus (GPa) | 70 | 410 | 379 | 380–470 | NA |
| Purity (%) | 99.5 | 97 | 97 | 98 | NA |
Hybrid reinforcements outperform double reinforcements, which in turn exhibit greater qualities than single reinforcements. Additionally, the two secondary reinforcements, SCBA and Gr, play a part in lowering the cost and weight while enhancing the necessary qualities. While SCBA is the greatest replacement material for cost and weight reduction as well as enhancing other material qualities including strength, hardness, wear, corrosion, and other features, Gr offers the new HAMC materials a self-lubricating capability [26].
2.2. Synthesis and characterization of sugar cane bagasse ash
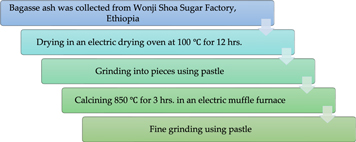
Bagasse is defined as the dry pulpy residue left after the extraction of juice from sugar cane [26]. The sugar extracted from sugarcane left behind sugarcane bagasse, when grid powdered to ash, is called sugarcane bagasse ash (SCBA). SCBA is an agro-industrial waste material constitutes mainly silicon dioxide. SCBA is one of the most inexpensive and low-density reinforcements available in large quantities as an agro-industrial waste by-product during the combustion of waste sugarcane [26]. Equipment used in the preparation of SCBA are Crucible, 45 μm size Sieve, Becker, sample holder, drying oven, and muffle furnace. The synthesis of SCBA is shown in figure 2 below.
Download figure:
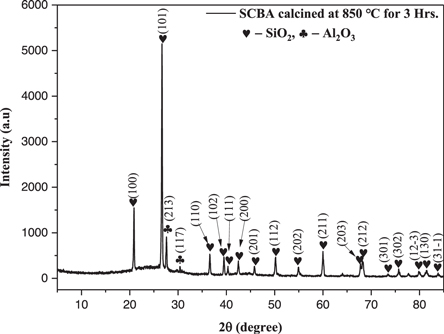
Standard image High-resolution imageThe largest proportion of the primary components (SiO2 + Al2O3 + Fe2O3) in the solid waste SCBA is 86.2% (see table 2), making it a suitable secondary reinforcement for the creation of innovative MMC materials. Furthermore, XRD measurements of SCBA calcined at 850 °C verified the existence of SiO2 and Al2O3, with strong SiO2 peaks and low Al2O3 peaks. Figure 3 depicts the phase identification of SCBA using XRD. As a result, the obtained SCBA fine powder can be used as an effective secondary reinforcing material in the fabrication of novel tetra hybrid reinforced HAMC materials [25].
Table 2. XRF analysis of SCBA. Reproduced from [26]. CC BY 4.0.
| Composition | SiO2 | Al2O3 | Fe2O3 | CaO | MgO | Na2O | K2O | MnO | P2O5 | TiO2 | H2O | LOI |
|---|---|---|---|---|---|---|---|---|---|---|---|---|
| SCBA (%) | 65.50 | 16.52 | 4.08 | 0.01 | 0.01 | 0.01 | 1.5 | 0.1 | 0.5 | 0.24 | 0.66 | 10.87 |
Download figure:
Standard image High-resolution image2.3. Powder metallurgy (PM) processing
The PM process is one of the most cost-effective techniques for producing near-net particle-reinforced MMCs, offering improved flexibility, cheaper manufacturing costs due to shorter machining times, and fewer scrap losses [45, 46]. The PM processing method gives greater uniformity in reinforcing material distribution, which eliminates clustering and enhances mechanical properties. The three critical processes in PM operation are powder mixing, powder compaction, and the sintering process. The phases of the PM fabrication process are explained in detail in our previously published article [26].
2.4. Design of experiment using Taguchi method
The Taguchi approach is one of the most powerful and successful ways for developing high-quality HAMC systems using L16 OAs [47]. L16 (or 4^5) orthogonal arrays indicate that there are five parameters such as milling time, compaction pressure, sintering temperature, wt% of Gr, and wt% of SCBA, and there are four levels for each of the five factors, resulting in 16 experiments (table 3). Taguchi's experimental design focuses on minimizing the number of iterations. It also allows for the best results in a short period of time. This powerful tool analysis was performed using the Minitab Statistical Software (version 20.3) to simulate experimental runs.
Table 3. Process and reinforcement factors and their levels.
| Levels | ||||||
|---|---|---|---|---|---|---|
| Parameters | Symbol | Unit | L1 | L2 | L3 | L4 |
| Milling Time | MT | Hrs. | 2 | 3 | 4 | 5 |
| Compaction Pressure | CP | MPa | 45 | 50 | 55 | 60 |
| Sintering Temperature | ST | °C | 400 | 450 | 500 | 550 |
| Wt% of Gr | Gr | wt% | 0.5 | 2.5 | 4.5 | 6.5 |
| Wt% of SCBA | SCBA | wt% | 0.5 | 2.5 | 4.5 | 6.5 |
The number of comparisons made between process parameters to determine the better level is referred to as the Degree of Freedom (DoF). This is used to determine the smallest number of experiments necessary to investigate the observed factors. Equation (1) gives the DoF value, and table 4 shows the overall DoF of experimental factors in this study.

Table 4. DoF of Experimental factors.
| Experimental factor | DoF (Level—1) | Sub Total |
|---|---|---|
| MT | 4–1 | 3 |
| CP | 4–1 | 3 |
| ST | 4–1 | 3 |
| Gr | 4–1 | 3 |
| SCBA | 4–1 | 3 |
| Total DoF | 15 | |
An L16 Taguchi orthogonal array is used because the orthogonal array's DoF must be equal to or exceed the total DoF of the experimental factors. The DoF of an L16 Taguchi array is 16-1 = 15.
Table 5 depicts an L16(4^5) OA, where L16 represents the maximum number of rows (experiments), 4 represents the number of levels, and 5 represents the number of columns (factors).
Table 5. L16 (4^5) orthogonal array Experimental Design.
| Exp. No. | MT | CP | ST | Gr | SCBA |
|---|---|---|---|---|---|
| 1. | 2 | 45 | 400 | 0.5 | 0.5 |
| 2. | 2 | 50 | 450 | 2.5 | 2.5 |
| 3. | 2 | 55 | 500 | 4.5 | 4.5 |
| 4. | 2 | 60 | 550 | 6.5 | 6.5 |
| 5. | 3 | 45 | 450 | 4.5 | 6.5 |
| 6. | 3 | 50 | 400 | 6.5 | 4.5 |
| 7. | 3 | 55 | 550 | 0.5 | 2.5 |
| 8. | 3 | 60 | 500 | 2.5 | 0.5 |
| 9. | 4 | 45 | 500 | 6.5 | 2.5 |
| 10. | 4 | 50 | 550 | 4.5 | 0.5 |
| 11. | 4 | 55 | 400 | 2.5 | 6.5 |
| 12. | 4 | 60 | 450 | 0.5 | 4.5 |
| 13. | 5 | 45 | 550 | 2.5 | 4.5 |
| 14. | 5 | 50 | 500 | 0.5 | 6.5 |
| 15. | 5 | 55 | 450 | 6.5 | 0.5 |
| 16. | 5 | 60 | 400 | 4.5 | 2.5 |
Signal - to -noise (S/N) ratio is a communication and engineering quality that is defined as the ratio of the signal's power (μ2) to the noise's power (σ2) expressed in decibels (dB) [48]. The S/N ratio has been used as a quality criterion, with smaller values indicating better quality, larger values indicating better quality, and nominal values indicating the best quality. Table 6 displays the signal-to-noise ratio functions and their practical application during multi-response optimization.
Table 6. Types of problems and respective signal-to-ratio function.
| S/N function | S/N formula | Usage when the goal is to... |
|---|---|---|
| Smaller the better |
![${\boldsymbol{S}}/{\boldsymbol{N}}=-10\,\mathrm{log}\left[\displaystyle \frac{1}{3}\displaystyle {\sum }_{{\boldsymbol{i}}=1}^{3}{{\boldsymbol{y}}}_{{\boldsymbol{i}}}^{2}\right]$](https://content.cld.iop.org/journals/2631-8695/4/4/045038/revision2/erxacaa8bieqn1.gif)
| Minimizing the responses: for instance, in this study, minimizing the response of |
| • Exp. density | ||
| • Porosity | ||
| Nominal the better |

| Target the response and want to base the S/N ratio on means and standard deviations |
| Larger the better |
![${\boldsymbol{S}}/{\boldsymbol{N}}\,=-10\,\mathrm{log}\left[\displaystyle \frac{1}{{\boldsymbol{n}}}\displaystyle {\sum }_{{\boldsymbol{i}}=1}^{{\boldsymbol{n}}}\tfrac{1}{{{\boldsymbol{y}}}_{{\boldsymbol{i}}}^{2}}\right]$](https://content.cld.iop.org/journals/2631-8695/4/4/045038/revision2/erxacaa8bieqn3.gif)
| Maximize the response: for instance, in this study, maximizing the response of |
| • Vickers' microhardness, and | ||
| • Compressive strength |
2.5. Grey relation analysis (GRA)
This study attempts to determine and optimize physicomechanical parameters with the following two goals in mind: (1) to minimize density, porosity, and (2) to maximize the micro-Vickers hardness, compressive, and ultimate tensile strength of a new HAMC material fabricated using a powder metallurgical process. As a result, it's an instance of multi-response optimization, as opposed to single-performance characteristic optimization [41]. When one performance feature has a greater S/N ratio, another could have a lower S/N ratio. As a result, for the optimization of numerous performance aspects, an overall evaluation of the S/N ratio is necessary. GRA is a measurement of the absolute value of the data difference between two sequences that can be used to determine the approximate correlation between them. The GRA is a technique for determining the absolute value of a data difference between two sequences, as well as an estimated correlation between them. It's a good way to look at the relationship between sequences with a small amount of data and it can look at a lot of different things. The Taguchi-based Grey Relational Analysis (TGRA) is well-known for tackling issues involving many input parameters and response variables that have inter-functional relationships. The wt% of SCBA and Gr, milling time, compaction pressure, and sintering temperature are all factors to consider. In this work, sixteen separate sets of tests are carried out, which are then improved using GRA. The responses considered during this study are density, porosity, hardness, compressive strength, and ultimate tensile strength. Estimating Grey Relational Grade (GRG) was used to convert these physicomechanical property outputs into a single common dataset. The combination with the greatest GRG value is considered to be the most influential and is ranked accordingly. GRG was calculated for each set of data values, and it was utilized to determine the most significant levels of input parameters which results in better outcomes. The GRG is the average of the grey relational coefficients added together. The main steps in GRA are depicted in figure 4 below.

Download figure:
Standard image High-resolution image3. Results and discussions
3.1. Measured responses data
The Taguchi-based Grey Relational Analysis (TGRA) was employed in the multi-response optimization process [50–52]. To find the ideal values of process variables, the Taguchi technique was utilized for designing and performing the experiment, while grey relational analysis was used to analyze the outcomes of matrix experiments [52]. Because it was a problem-solving tool that improved the performance of the product, process design, and system. The following response data are measured for each of the HAMCs that were tested using the Taguchi method. Table 7 shows the responses of density and porosity, in which the quality characteristic feature must be minimized and the S/N ratio must be smaller to be better, while table 8 shows the responses of Vickers hardness, compressive strength, and ultimate tensile strength, in which the quality characteristic feature must be maximized and, as a result, the S/N ratio of these responses must be larger the better.
Table 7. Measured Responses data with smaller the better-quality features.
| Exp. No. | ED-1 | ED-2 | ED-3 | P-1 | P-2 | P-3 |
|---|---|---|---|---|---|---|
| 1. | 2.5231 | 2.5531 | 2.5191 | 1.1649 | 1.1549 | 1.1745 |
| 2. | 2.4956 | 2.5256 | 2.4916 | 1.3889 | 1.3789 | 1.3985 |
| 3. | 2.3589 | 2.3889 | 2.3549 | 1.2033 | 1.1933 | 1.2129 |
| 4. | 2.3172 | 2.3472 | 2.3132 | 3.0431 | 3.0331 | 3.0527 |
| 5. | 2.2759 | 2.3059 | 2.2719 | 4.9367 | 4.9267 | 4.9463 |
| 6. | 2.2782 | 2.3082 | 2.2742 | 3.8796 | 3.8696 | 3.8892 |
| 7. | 2.4692 | 2.4992 | 2.4652 | 0.8731 | 0.8631 | 0.8827 |
| 8. | 2.3281 | 2.3581 | 2.3241 | 2.0302 | 2.0202 | 2.0398 |
| 9. | 2.2131 | 2.2431 | 2.2091 | 3.9312 | 3.9212 | 3.9408 |
| 10. | 2.2828 | 2.3128 | 2.2788 | 3.4249 | 3.4149 | 3.4345 |
| 11. | 2.2991 | 2.3291 | 2.2951 | 2.0272 | 2.0172 | 2.0368 |
| 12. | 2.3033 | 2.3333 | 2.2993 | 0.9975 | 0.9875 | 1.0071 |
| 13. | 2.3352 | 2.3652 | 2.3312 | 1.5437 | 1.5337 | 1.5533 |
| 14. | 2.0546 | 2.0846 | 2.0506 | 4.2981 | 4.2881 | 4.3077 |
| 15. | 2.0674 | 2.0974 | 2.0634 | 4.5079 | 4.4979 | 4.5175 |
| 16. | 2.1996 | 2.2296 | 2.1956 | 2.2466 | 2.2366 | 2.2562 |
ED-1,2,3 Experimental density for three trials, P-1,2,3 porosity for three trials.
Table 8. Measured Responses data with Larger is the better-quality characteristic feature.
| Vickers Hardness (HV) (MPa) | Compressive Strength (CS) (MPa) | Ultimate Tensile Strength (UTS) (MPa) | |||||||
|---|---|---|---|---|---|---|---|---|---|
| Exp.No. | HV-1 | HV-2 | HV-3 | CS-1 | CS-2 | CS-3 | UTS-1 | UTS-2 | UTS-3 |
| 1. | 1528.9113 | 1449.4746 | 1532.8341 | 311.0304 | 293.6851 | 301.2101 | 548.2992 | 519.8116 | 549.7060 |
| 2. | 2175.6830 | 2216.8724 | 2260.0232 | 312.3364 | 294.9911 | 302.5161 | 780.2449 | 795.0163 | 810.4911 |
| 3. | 2950.9263 | 3164.2286 | 3035.7569 | 262.3771 | 245.0318 | 252.5568 | 1058.2632 | 1134.7578 | 1088.6852 |
| 4. | 1364.6441 | 1459.2816 | 1376.9028 | 272.9962 | 255.6509 | 263.1759 | 489.3896 | 523.3286 | 493.7858 |
| 5. | 1838.3222 | 1872.1563 | 1967.7746 | 225.9245 | 208.5792 | 216.1042 | 659.2604 | 671.3940 | 705.6847 |
| 6. | 1720.6382 | 1758.8855 | 1819.1985 | 345.5287 | 328.1834 | 335.7084 | 617.0564 | 630.7727 | 652.4022 |
| 7. | 1995.7245 | 1841.7546 | 1850.0906 | 331.8357 | 314.4904 | 322.0154 | 715.7081 | 660.4913 | 663.4807 |
| 8. | 1301.8793 | 1338.6555 | 1626.9813 | 324.1664 | 306.8211 | 314.3461 | 466.8808 | 480.0696 | 583.4692 |
| 9. | 1709.8505 | 1726.5224 | 1827.0441 | 181.7716 | 164.4263 | 171.9513 | 613.1877 | 619.1666 | 655.2158 |
| 10. | 1980.0333 | 2037.8946 | 1928.0562 | 225.2415 | 207.8962 | 215.4212 | 710.0809 | 730.8312 | 691.4408 |
| 11. | 2732.7206 | 2820.0029 | 2818.0415 | 349.7826 | 332.4373 | 339.9623 | 980.0101 | 1011.3114 | 1010.6080 |
| 12. | 2841.0879 | 2886.2001 | 2867.5668 | 311.1254 | 293.7801 | 301.3051 | 1018.8729 | 1035.0511 | 1028.3688 |
| 13. | 1523.5175 | 1660.8155 | 1593.1472 | 327.2714 | 309.9261 | 317.4511 | 546.3649 | 595.6028 | 571.3355 |
| 14. | 1804.4880 | 1863.8204 | 1818.2178 | 334.4439 | 317.0986 | 324.6236 | 647.1267 | 668.4045 | 652.0505 |
| 15. | 2786.6591 | 2747.4311 | 2777.8328 | 327.3257 | 309.9804 | 317.5054 | 999.3536 | 985.2856 | 996.1883 |
| 16. | 2395.8501 | 2369.8616 | 2308.0775 | 321.0304 | 303.6851 | 311.2101 | 859.2014 | 849.8814 | 827.7243 |
HV-1,2,3 Vickers hardness (MPa) for three trials, CS-1,2,3 compressive strength (MPa) for three trials, UTS-1,2,3 ultimate tensile strength (MPa) for three trials.
To use the Vickers micro-hardness results from this study to predict tensile properties, previously-published correlations were used [53–55]. The ultimate tensile strength of HAMCs upon a hardness measurement was calculated using the following equation.
Vickers hardness is strongly related to tensile and yield strength. However, using these relationships as a predictive tool for processes where strain-hardening behavior is poorly understood may be impractical [56]. The measured hardness values were higher than predicted for a given yield or tensile strength, with the strain hardening exponent ranging from 0 to 1, with 0 implying a perfectly plastic solid and 1 implying a perfectly elastic solid. Many of the most of these metals have n-values ranging between 0.10 and 0.50. Since, the strain hardening exponent of aluminum and its alloys is in the range of 0.2–0.3 [56], let us assume n = 0.25 for aluminum in all of the calculations using above equation.
The ultimate tensile strength of HAMCs could be estimated as follows; First, change the measured Vickers hardness number (HVN) into MPa using the following conversions [55, 57].
- ⇒In order to convert HV to MPa, multiply it by 9.807.
- ⇒In order to convert HV to GPa, multiply it by 0.009807.
For instance; for S1 of first trial (HV-1);
HV-1 = 155.900 HVN =155.900*9.807 = 1528.9113 MPa.
3.2. Multi-response optimization of steps in GRA
Taguchi's technique is sufficient for determining the best process parameter settings for a single response characteristic. Multi-response optimization utilizing GRA is the recommended strategy when there are two or more replies with different quality attributes [58]. Grey relational grade is used to reduce a multi-objective problem to a single objective [52]. The scope of this study was to identify the optimal combination of process parameters that concurrently minimize the density and porosity and maximize the Vickers microhardness, compressive strength, and ultimate tensile strength. For resolving interrelationships among multiple responses, grey relational analysis is performed. A grey relational grade is generated in this method for analyzing the relationship degree of multiple responses [59]. Multiple performance criteria can be optimized into a single grey relational grade in this research [48]. For grey relational analysis, the following steps are examined.
Step 1. Using the relevant equations for the kind of quality characteristic feature, convert the original response data into S/N ratio (η). For each response, there are three replications. The data must now be translated into a S/N ratio. Because Vickers hardness (HV), compressive strength (CS), and Ultimate tensile strength (UTS) must all be maximized, the type of quality characteristic utilized is larger—the better. As a result, the S/N ratio for the larger—the better-quality characteristic feature is calculated using equation (2) given below:

Where; n is the number of repetitions of the experiment, yi is the observed response value
The second performance measure (response) is smaller—the better type utilized for experimental density (ED) and porosity (P) and its S/N ratio is computed using equation (3), as follows:

Similarly, the following S/N ratio for observed responses is calculated using the appropriate equations (2) and (3) shown in table 9.
Step 2. To prevent the effect of using various units and to reduce variability, normalize ηij
as Zij
(0  Zij
Zij
 1) using equations (4) and (5). Normalization is a transformation that is applied to a single input to uniformly distribute and scale the data so that it may be analyzed further. Taguchi's approach yields S/N ratios that are normalized between 0 and 1, a process is known as grey relational generation [28, 60]. The calculation technique 'higher the better' was used because maximizing the Vickers microhardness, compressive strength, and ultimate tensile strength of the HAMCs were intended, while for density and porosity 'lower the better' were used because minimization of the density and porosity of the HAMCs was intended [61].
Table 9. The S/N ratio (η) for the measured responses.
| S/N ratio (η) for each response values | |||||
|---|---|---|---|---|---|
| The smaller is the better | The larger is the better | ||||
| Exp. No. | ED | AP | HV | CS | UTS |
| 1. | −8.0687 | −1.3248 | 63.5347 | 49.5923 | 54.6275 |
| 2. | −7.9738 | −2.8530 | 66.9142 | 49.6298 | 58.0069 |
| 3. | −7.4862 | −1.6067 | 69.6762 | 48.0633 | 60.7689 |
| 4. | −7.3320 | −9.6660 | 62.9128 | 48.4208 | 54.0055 |
| 5. | −7.1763 | −13.8685 | 65.5311 | 46.7101 | 56.6239 |
| 6. | −7.1849 | −11.7755 | 64.9342 | 50.5332 | 56.0269 |
| 7. | −7.8817 | 1.1794 | 65.5386 | 50.1719 | 56.6313 |
| 8. | −7.3726 | −6.1504 | 62.9362 | 49.9627 | 54.0289 |
| 9. | −6.9343 | −11.8903 | 64.8719 | 44.7248 | 55.9646 |
| 10. | −7.2026 | −10.6927 | 65.9354 | 46.6826 | 57.0281 |
| 11. | −7.2641 | −6.1374 | 68.9101 | 50.6425 | 60.0028 |
| 12. | −7.2800 | 0.0223 | 69.1418 | 49.5950 | 60.2345 |
| 13. | −7.3988 | −3.7707 | 64.0254 | 50.0480 | 55.1181 |
| 14. | −6.2913 | −12.6653 | 65.2410 | 50.2419 | 56.3338 |
| 15. | −6.3449 | −13.0793 | 68.8511 | 50.0495 | 59.9438 |
| 16. | −6.8814 | −7.0300 | 67.4474 | 49.8757 | 58.5401 |
| Min | −8.0687 | −13.8685 | 62.9128 | 44.7248 | 54.0055 |
| Max | −6.2913 | 1.1794 | 69.6762 | 50.6425 | 60.7689 |
For the S/N ratio with Larger the better manner, normalization of the S/N ratio is performed using equation (4)

While for S/N ratio with smaller the better manner, normalization is performed using equation (5) given below.

where, Zij
= Normalized value for ith experiment for jth dependent variable/response,  is the S/N ratio value to be normalized, and max (ηij) and min(ηij) are the maximum and minimum values of ηij, respectively. Larger normalized results correspond to better performance, according to Deng, and the best normalized result should equal one [62]. The grey relational coefficients are then computed to represent the link between the ideal (best) and actual experimental findings.
Table 10 displays the normalized S/N ratio values obtained from the S/N ratio in table 9 using the above-mentioned equations (4) and (5).
Step 3. Calculation of the deviation sequences (Δij) in both quality features is similar, and the equation is as follows;  = absolute difference between
  and
and  which is a deviation from the target value and can be treated as a quality loss. The Deviation sequence for the respective of the normalized S/N ratios (η) has been shown in table 11.

Where, Δij is the deviation sequence, and  is usually equal to one (
 ).
).
Step 4. Calculation of the Grey relational coefficients (GRCs): Calculation of the grey relational co-efficient for the normalized S/N ratio values is based on the following equation

λ is the distinguishing coefficient, which is defined in the range 0 ≤λ ≤1 (the value may be changed depending on the system's actual needs). λ is also called as the coefficient of identification, ranging between 0 and 1. According to [47, 63, 64], λ = 0.5 is commonly chosen for λ since using 0 or 1 has no effect on the ranking order of the parameters. Table 12 displays the GRC values obtained using equation (7).
Step 5. Compute the grey relational grade (GRGi): after calculating the GRCij, the GRGi can be obtained as follows;

where m is the number of responses (or the number of performance characteristics), and is equal to 5 since there are five responses, (namely; ED, P, HV, CS, and UTS). The grey grade values are generated in the same way for all of the trials and are listed in table 12.
Step 6. Determine the most appropriate factor and its level combinations. The larger the grey relational grade, the superior the quality of products; hence, the factor influence may be evaluated and the best level for each controllable component can be found using the grey relational grade [48]. This can be done using two ways; (1) using Minitab software, it is possible to find out the optimal parameter settings, or (2) it can be computed by averaging the GRG values manually. The following is the process for determining the average grey relational grade [28]:
- 1.Grouping of the grey relational grades by factor level for each column in the orthogonal array.
- 2.Taking the average of grey relational grades.
- 3.Calculation of grade values for each experiment of the L16 orthogonal arrays.
Table 10. Normalized S/N ratios (η) of the measured responses.
| Normalized S/N ratios (η) for smaller is the better | Normalized S/N ratios (η) for larger is the better | ||||
|---|---|---|---|---|---|
| Exp. No. | ED | AP | HV | CS | UTS |
| 1. | 1.0000 | 0.1664 | 0.0920 | 0.8225 | 0.0920 |
| 2. | 0.9466 | 0.2680 | 0.5916 | 0.8289 | 0.5916 |
| 3. | 0.6723 | 0.1851 | 1.0000 | 0.5641 | 1.0000 |
| 4. | 0.5855 | 0.7207 | 0.0000 | 0.6246 | 0.0000 |
| 5. | 0.4979 | 1.0000 | 0.3871 | 0.3355 | 0.3871 |
| 6. | 0.5027 | 0.8609 | 0.2989 | 0.9815 | 0.2989 |
| 7. | 0.8948 | 0.0000 | 0.3882 | 0.9205 | 0.3882 |
| 8. | 0.6084 | 0.4871 | 0.0035 | 0.8851 | 0.0035 |
| 9. | 0.3618 | 0.8685 | 0.2897 | 0.0000 | 0.2897 |
| 10. | 0.5127 | 0.7890 | 0.4469 | 0.3308 | 0.4469 |
| 11. | 0.5473 | 0.4862 | 0.8867 | 1.0000 | 0.8867 |
| 12. | 0.5562 | 0.0769 | 0.9210 | 0.8230 | 0.9210 |
| 13. | 0.6231 | 0.3290 | 0.1645 | 0.8995 | 0.1645 |
| 14. | 0.0000 | 0.9200 | 0.3442 | 0.9323 | 0.3442 |
| 15. | 0.0302 | 0.9476 | 0.8780 | 0.8998 | 0.8780 |
| 16. | 0.3320 | 0.5456 | 0.6705 | 0.8704 | 0.6705 |
| Min | 0.0000 | 0.0000 | 0.0000 | 0.0000 | 0.0000 |
| Max | 1.0000 | 1.0000 | 1.0000 | 1.0000 | 1.0000 |
Table 11. Deviation sequence for the respective of the normalized S/N ratios (η).
| Deviation Sequence (Δij has the same formula for all) | |||||
|---|---|---|---|---|---|
| Exp. No. | ED | AP | HV | CS | UTS |
| 1. | 0.0000 | 0.8336 | 0.9080 | 0.1775 | 0.9080 |
| 2. | 0.0534 | 0.7320 | 0.4084 | 0.1711 | 0.4084 |
| 3. | 0.3277 | 0.8149 | 0.0000 | 0.4359 | 0.0000 |
| 4. | 0.4145 | 0.2793 | 1.0000 | 0.3754 | 1.0000 |
| 5. | 0.5021 | 0.0000 | 0.6129 | 0.6645 | 0.6129 |
| 6. | 0.4973 | 0.1391 | 0.7011 | 0.0185 | 0.7011 |
| 7. | 0.1052 | 1.0000 | 0.6118 | 0.0795 | 0.6118 |
| 8. | 0.3916 | 0.5129 | 0.9965 | 0.1149 | 0.9965 |
| 9. | 0.6382 | 0.1315 | 0.7103 | 1.0000 | 0.7103 |
| 10. | 0.4873 | 0.2110 | 0.5531 | 0.6692 | 0.5531 |
| 11. | 0.4527 | 0.5138 | 0.1133 | 0.0000 | 0.1133 |
| 12. | 0.4438 | 0.9231 | 0.0790 | 0.1770 | 0.0790 |
| 13. | 0.3769 | 0.6710 | 0.8355 | 0.1005 | 0.8355 |
| 14. | 1.0000 | 0.0800 | 0.6558 | 0.0677 | 0.6558 |
| 15. | 0.9698 | 0.0524 | 0.1220 | 0.1002 | 0.1220 |
| 16. | 0.6680 | 0.4544 | 0.3295 | 0.1296 | 0.3295 |

| 0.0000 | 0.0000 | 0.0000 | 0.0000 | 0.0000 |

| 1.0000 | 1.0000 | 1.0000 | 1.0000 | 1.0000 |
Table 12. Grey relational coefficients (GRCs) and grey relational grades (GRGs).
| Grey Relational Coefficients (GRCs) | |||||||
|---|---|---|---|---|---|---|---|
| Exp. No. | ED | AP | HV | CS | UTS | Grey Relational Grades (GRGs) | Rank |
| 1. | 1.0000 | 0.3749 | 0.3551 | 0.7380 | 0.3551 | 0.5646 | 11 |
| 2. | 0.9035 | 0.4058 | 0.5504 | 0.7450 | 0.5504 | 0.6310 | 5 |
| 3. | 0.6041 | 0.3803 | 1.0000 | 0.5343 | 1.0000 | 0.7037 | 3 |
| 4. | 0.5468 | 0.6416 | 0.3333 | 0.5711 | 0.3333 | 0.4852 | 15 |
| 5. | 0.4990 | 1.0000 | 0.4493 | 0.4294 | 0.4493 | 0.5654 | 10 |
| 6. | 0.5014 | 0.7824 | 0.4163 | 0.9644 | 0.4163 | 0.6161 | 6 |
| 7. | 0.8262 | 0.3333 | 0.4497 | 0.8628 | 0.4497 | 0.5843 | 9 |
| 8. | 0.5608 | 0.4936 | 0.3341 | 0.8132 | 0.3341 | 0.5072 | 14 |
| 9. | 0.4393 | 0.7918 | 0.4131 | 0.3333 | 0.4131 | 0.4781 | 16 |
| 10. | 0.5064 | 0.7032 | 0.4748 | 0.4277 | 0.4748 | 0.5174 | 12 |
| 11. | 0.5248 | 0.4932 | 0.8153 | 1.0000 | 0.8153 | 0.7297 | 2 |
| 12. | 0.5298 | 0.3513 | 0.8635 | 0.7385 | 0.8635 | 0.6694 | 4 |
| 13. | 0.5702 | 0.4270 | 0.3744 | 0.8327 | 0.3744 | 0.5157 | 13 |
| 14. | 0.3333 | 0.8621 | 0.4326 | 0.8807 | 0.4326 | 0.5883 | 8 |
| 15. | 0.3402 | 0.9051 | 0.8039 | 0.8330 | 0.8039 | 0.7372 | 1 |
| 16. | 0.4281 | 0.5239 | 0.6027 | 0.7942 | 0.6027 | 0.5903 | 7 |
To determine the effect of factor I, for example, the average of grade values (AGV) for each level j has been calculated, represented as AGVij, and then the effect, Ei, is defined as:

If the factor i is controllable, the best level j*, is determined by

Where, MT is Milling time (hrs.), CP is compaction pressure (MPa), ST is sintering temperature (°C), Gr is graphite content (wt%), and SCBA is sugar cane bagasse ash content (wt%), and bolded results show optimal parameters setting values.
Figure 5 depicts the primary effects of the various experimental conditions on the HAMCs' physical and mechanical characteristics. If the line for a given parameter in the main effect plot is near horizontal, the parameter has no meaningful influence. A parameter for which the line has the greatest inclination, on the other hand, has the most impact. The main effect plot revealed that the parameter CP (compaction pressure) was the most important, whereas the parameters ST, SCBA, MT, and MT had a lesser impact. This finding is also in line with the previous research by Wahyudie, I.A., et al [42] and Hlail, H.H. et al [65]. They conclude that based on the percentage contributions, the compaction pressure exhibited a strong effect in reducing porosity and increasing hardness. The increase in the compaction pressure caused less porosity and resulted in an improved material behavior, which in turn led to the improved tribological and corrosion performance of the HAMC materials [65, 66]. Table 13 shows the optimal parameter setting combination: optimal milling time, level 4; optimal compacting pressure, level 3; optimal sintering temperature, level 2; optimal wt% of Gr, level 1; optimal wt% of SCBA, level 3; and the optimal parameter setting combination, MT4 CP3 ST2 Gr1 SCBA3. Milling time (5 h.), compaction pressure (55 MPa), sintering temperature (450 °C), Gr content (0.5 wt%), and SCBA content (4.5 wt%) are the values of the optimal parameters setting, as shown in table 14. Table 13 also shows the gap between the grey relational grade's maximum and minimum values (Max–Min). The highest Max–Min ratio suggests that it is the most powerful element influencing multi-performance features [28, 65, 67]. In table 13, the maximum Max–Min value is 0.1578, and the related control factor, i.e., compacting pressure, has the greatest impact on various performance aspects. As shown in the rank given in table 13, the order of importance of the controllable factors to the multi-performance characteristics in the overall HAMC fabrication process, in sequence, can be listed as: factor CP > ST > SCBA > MT > Gr, i.e., 0.1578 > 0.1251 > 0.0553 > 0.0396 > 0.0225. The most controllable parameters in the development of powder metallurgical HAMC for multi-performance characteristics are compaction pressure and sintering temperature, which are significantly associated with prior investigations [31, 42, 65].
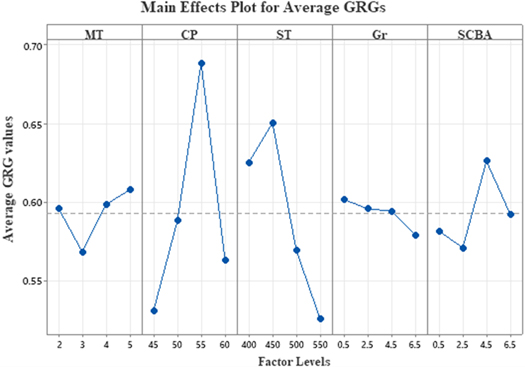
Figure 5. Response graphs for GRG showing the influence of processing parameters and reinforcement wt% on physicomechanical characteristics of HAMCs.
Download figure:
Standard image High-resolution imageTable 13. Response table of the average grey relational grade.
| Average grey relational grade by factor levels | ||||||
|---|---|---|---|---|---|---|
| Control Factors | 1 | 2 | 3 | 4 | Max-Min ( ) ) | Rank |
| MT | 0.5962 | 0.5683 | 0.5986 | 0.6079 | 0.0396 | 4 |
| CP | 0.5310 | 0.5882 | 0.6887 | 0.5630 | 0.1578 | 1 |
| ST | 0.6252 | 0.6507 | 0.5693 | 0.5257 | 0.1251 | 2 |
| Gr | 0.6017 | 0.5959 | 0.5942 | 0.5792 | 0.0225 | 5 |
| SCBA | 0.5816 | 0.5710 | 0.6262 | 0.5922 | 0.0553 | 3 |
Table 14. Optimal parameter setting of HAMCs development.
| MT | CP | ST | Gr | SCBA |
|---|---|---|---|---|
| 5 h. | 55 MPa | 450 °C | 0.5 wt% | 4.5 wt% |
Table 14 indicates the optimum parameters which has obtained from table 13 for confirmation test.
Step 7. Confirmation experiments
The confirmation test was carried out using the optimal parameter settings to check experimental density, porosity, in which the quality feature needed to be lower is the better, and Vickers hardness, compressive strength, and ultimate tensile strength, in which their quality features needed to be higher is the better. Figure 6 depicts an optical micrograph of the Vicker hardness of the OS HAMC sample.
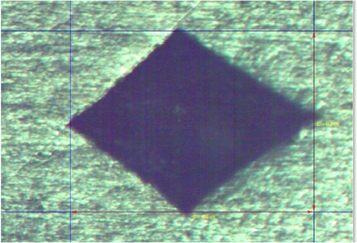
Figure 6. Vickers hardness result of OS HAMC sample produced using the optimal parameters given in table 14.
Download figure:
Standard image High-resolution imageBased on their respective quality features, the following results have been recorded;
Where;
- ⇒Avg. ED is the average experimental density for three trials,
- ⇒Avg. P is average porosity (%) for three trials,
- ⇒Avg. HV Average Vickers hardness (MPa) for three trials,
- ⇒Avg. CS is Average compressive strength of three trials, and
- ⇒Avg. UTS is average ultimate tensile strength of three HV trials.
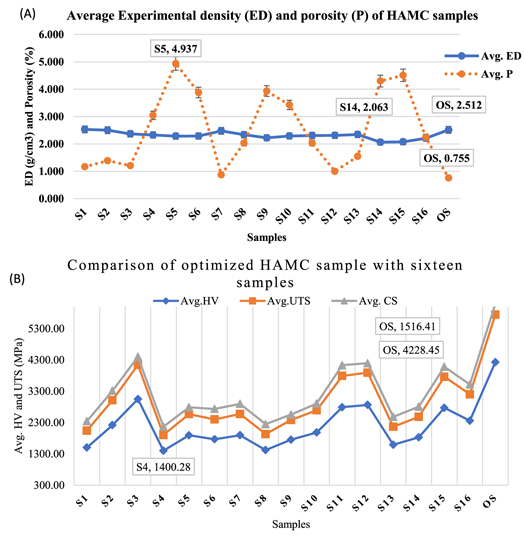
As shown in table 15 and figure 7, the OS HAMC sample produced at optimum parameters outperforms the 16 HAMC samples in terms of property outcomes. According to the confirmation results, TGRA is a very helpful method for performing multi-output optimization in order to predict physicomechanical properties for a variety of applications in biomedical devices, automotive, and aerospace components [28, 60].
Table 15. Confirmation testing results.
| Sample | Avg. ED (g cm−3) | Avg. P (%) | Avg. HV(MPa) | Avg. CS (MPa) | Avg. UTS (MPa) |
|---|---|---|---|---|---|
| OS | 2.5118 | 0.8653 | 4228.45 | 343.33 | 1516.41 |
Figure 7. Comparison of OS and the L16 HAMC samples (A) for lower is better and (B) for higher is better quality feature in the multi-response optimization via GRA.
Download figure:
Standard image High-resolution image
4. Conclusion
The goal of this research was to find the best process parameters to simultaneously reduce density and porosity while increasing Vickers microhardness, compressive strength, and ultimate tensile strength. The following are the concluding remarks of this manuscript:
- 1.The CP (compaction pressure) was the most important parameter than ST, SCBA, MT, and MT which had a lesser impact. The increased compaction pressure resulted in decreased porosity and enhanced material behavior.
- 2.The Milling time (5 h), compaction pressure (55 MPa), sintering temperature (450 °C), Gr content (0.5 wt %), and SCBA content (4.5 wt%) are the values for the best parameters setup.
- 3.The average density, porosity, hardness, compressive strength and Ultimate tensile strength of 2.5118 gm cm−3, 0.8653%, 4228.45 MPa, 343.33 MPa, and 1516.41 MPa respectively has been obtained at optimal parameter settings. The study concludes that the best outcomes are achieved by HAMC material created at the determined optimum parameter values.
- 4.Further research studies using nano-sized solid waste reinforcements and advanced processing parameters such as microwave sintering, spark plasma sintering, and others are recommended for superior quality performance. In addition to their superior characteristics, hybrid reinforcements with more than three materials with different properties such as lubrication, cost reduction, machinability, and others should be prioritized.
Data availability statement
All data that support the findings of this study are included within the article (and any supplementary files).
Conflict of interest
All co-authors have seen and agree with the contents of the manuscript and there is no financial interest to report.
Funding statement
The authors have not received any funds from anyone.