Abstract
The MOSCAB equipment, a geyser-concept bubble-chamber originally thought for the search of dark matter in the form of WIMPs, is employed for the detection of fast neutrons. Once the background-free operating conditions are determined such that the detector is sensitive only to neutrons, which occurs when the neutron energy threshold required for nucleation is higher than approximately 2.5 MeV, the detector response to fast neutrons is investigated using a \({^{241}}\)AmBe neutron source. Sets of detection efficiency functions are then produced via Monte Carlo simulations and post-processing, their validation being performed experimentally and discussed. Finally, the use of the detector to measure the fast neutron activity of very weak n-sources in low neutron background environments, as well as to monitor the cosmic ray variations through the neutron component of the Extensive Air Showers, is considered.
1 Introduction
The MOSCAB bubble-chamber detector relies on the geyser technique, a variant of the superheated liquid technique of extreme simplicity originally introduced by Hahn and Reist to detect fission fragments [1]. It was thought, designed, built and developed by Antonino Pullia and his team, to search for dark matter in the form of WIMPs through a possible spin-dependent interaction occurring with fluorine nuclei, as illustrated and discussed by Bertoni et al. [2] and Antonicci et al. [3]. On the other hand, the same equipment, or a simplified version of the same device, can be effectively operated to detect fast neutrons, which is the topic of the present paper.
The MOSCAB detector has been firstly tested above ground at Milano-Bicocca University using, as a target liquid, 0.7 L of octafluoropropane (\(\text {C}_3\text {F}_8\)) kept at different metastability conditions. Later, the apparatus was moved underground to the INFN Gran Sasso National Laboratories (LNGS), repeating both background and neutron sensitivity measurements, which were performed for two different configurations of the detector, equipped with either a 2 L vessel filled with 1.2 L of \(\text {C}_3\text {F}_8\) or a 18 L vessel filled with 13 L of \(\text {C}_3\text {F}_8\).
The operation principles of the MOSCAB detector, exactly as for any traditional bubble chamber, are based on the theoretical model originally proposed by Seitz [4], according to which pressure and temperature of the metastable liquid determine the minimum recoil energy required for bubble nucleation, also called the critical energy. On the other hand, since the critical energy must be released within a sufficiently small volume of the sensitive liquid, bubble nucleation depends also on the stopping power of the ionizing particle, which makes the detector entirely unaffected by the backgrounds due to recoiling electrons and minimum ionizing radiation, provided that the critical energy is not too low.
This means that, besides neutrons, the only other particle-induced background is represented by \(\alpha \)-decay events, yet, as it will be shown, such a source of background can be completely suppressed by operating the detector above specific recoil energy thresholds. In this general framework, thanks to the extremely low neutron flux typical of the environmental background of LNGS underground laboratories, as well described by Wulandari et al. [5], we could easily conduct measurements of the residual internal background of the detector. Subsequently, the bubble nucleation model describing the behaviour of the detector operated in different configurations and exposed to a neutron source is presented, and the related detection efficiency functions for fast neutrons with energies up to 20 MeV are employed to compare the experimental data with the numerical results of Monte Carlo simulations and post-processing. Finally, the detector sensitivity and its possible applications in measuring and monitoring low fluxes of fast neutrons in the absence of background are also discussed.
2 Basic outlines of the detector
The MOSCAB detector basically consists of a closed quartz vessel filled with a target liquid, i.e., \(\text {C}_3\text {F}_8\), and its saturated vapour. The bottom of the vessel contains the sensitive liquid kept at a constant temperature \( T_{L} \) by an external thermal bath, whereas the saturated vapour located on top of it is maintained at a lower constant temperature \( T_{V} \). Considering that the pressure exerted inside the vessel is the saturation pressure \({ p_s(T_{V}) }\) imposed by the vapour, which is lower than the equilibrium saturation pressure \( p_s(T_{L}) \), the target liquid is in underpressure, and then in a superheated state, whose degree of metastability can be identified using the reduced superheat parameter \( SH \) introduced by d’Errico [6]
where \( T_{c} \) is the critical temperature of the target liquid, i.e., \( T_{c} \) \(= 71.87~^{{\circ }}\hbox {C}\).
The degree of metastability is continuously monitored by measuring both the liquid temperature \( T_{L} \) and the saturated vapour pressure \( p_s(T_{V}) \) with a sampling time interval of 6 seconds, then calculating the vapour temperature \( T_{V} \) using the fluid properties at saturation extracted from the NIST Chemistry Web Book [7].
A schematic view of the MOSCAB bubble chamber is displayed in Fig. 1, in which the two different configurations of the detector discussed in the present work, one equipped with a 2 L vessel and the other with a 18 L vessel, are shown superimposed.
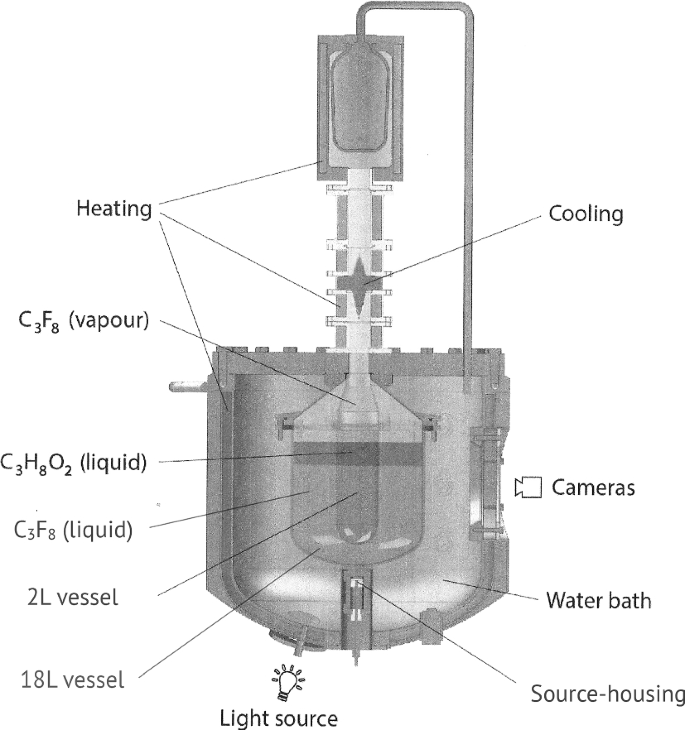
The MOSCAB bubble chamber. Both the 2 and 18 L vessels are reported
The apparatus is provided with two cameras to photograph the chamber as well as seven temperature detectors and two pressure transducers to monitor the thermodynamic parameters. Conversely, no sensor is used to record acoustic signals. The cameras are black-and-white Basler avA1600-50gm GigE digital cameras, delivering 48 frames per second at a resolution of \(1600\times 1200\) pixels, each equipped with either a 8.25 mm or a 4.5 mm high resolution optic, according as the 2 L vessel or the 18 L vessel is used, setting a fixed exposure time of 10 ms.
The trigger of the data acquisition takes origin by a thorough observation of a dedicated region monitored by one of the two cameras, taking one picture every 20.8 ms. When a trigger occurs due to changes appearing between two consecutive pictures, the related set of frames from both cameras, with the addition of pre- and post-trigger frames, are saved for off-line processing of the event.
The temperature detectors are Tersid PT100-4 thermo-resistances with a measurement accuracy of \(0.05~^{\circ }\text {C}\), five of them being located in the water tank to measure the bath temperature at different places, the remaining two outside the detector to measure the room temperature.
The pressure transducers are Micro Sensor MPM4760 piezoelectric pressure transmitters with a full scale accuracy of \(\pm 0.1\%\) (f.s. = 1600 kPa), one being located in the water tank, the other inside the neck of the detector, just above the cooling section. The independent data acquisition of these nine sensors, supplied by National Instruments, is synchronised with the general DAQ, the values of both temperature and pressure being recorded every 6 s. More details can be found in the study performed by Antonicci et al. [3].
As far as the response to ionizing particles is concerned, bubble nucleation requires that the locally deposited energy of a traversing particle exceeds a defined critical energy necessitated to create a vapour bubble of critical radius \( R_{c} \), i.e., \({ E_{dep}\ge E_c }\), and that the stopping power of the particle is large enough to release this energy as heat over a critical deposition length \({ L_{c} }\) such to be effective to produce a stable vapour bubble of radius \( R_{c} \), the subsequent growth of the newborn bubble being ensured by the energy supplied by the surrounding liquid, as described by Archambault et al. [8], which means
where \(S(E)= -dE/dx\) is the stopping power of the ionizing particle of energy E, whose values can be calculated using the SRIM package [9].
The critical energy \( E_{c} \) is given by the sum of the energy required to vaporize the mass of liquid involved in the phase change and the energy required to form the vapour bubble surface
where \( \rho _{V} \) is the mass density of the saturated vapour and \( \lambda \) is the latent heat of vaporization, both evaluated at the vapour temperature \( T_{V} \), while \( \sigma \) is the surface tension of the liquid calculated at the liquid temperature \( T_{L} \).
The critical radius \( R_{c} \), consistent with the condition of mechanical equilibrium between the surface tension and the pressure difference at the bubble surface, can be calculated as the radius of the vapour bubble corresponding to the maximum of the free enthalpy variation associated with the phase change
In the present investigation, the detector has been operated at a stable nominal liquid temperature \( T_L =25~^{\circ }\text {C}\) with a maximum liquid-vapour temperature difference around \(5~^{\circ }\text {C}\), which corresponds to an operating pressure around 800 kPa and a maximum liquid underpressure of about 100 kPa. Accordingly, the superheat parameter SH ranges approximately between 0.05 and 0.1, while the related critical radius \(R_c\) and critical energy \(E_c\) span from 80 nm to 140 nm, and from about 100 keV to nearly 500 keV, respectively. In these operating conditions, spurious bubble nucleations due to ruts of the vessel walls are basically absent, therefore it was neither necessary to apply any quality cut, nor define a fiducial volume.
Notice that the operation at pressures of the order of 750–850 kPa explains the cited absence of sensors to record nucleation-induced acoustic signals, whose detectability decreases drastically when pressure is increased, as widely discussed by Ardid et al. [10].
Indeed, as thoroughly discussed in a recent study performed by Bruno et al. [11], a number of equations are available in the literature for the calculation of \( R_{c} \) and \( E_{c} \), see e.g. Bugg [12] and Tenner [13], to name a few. However, in the critical energy range of interest for the current study the use of Eqs. (3) and (4) or alternative equations proposed by other authors is essentially equivalent, leading to values of \( E_{c} \) well in agreement within 5 percent. Additionally, it seems worth pointing out that, due to the relatively small temperature differences imposed between the target liquid and its vapour, the critical radius \( R_{c} \) can be reasonably assumed to be proportional to 1/SH – see Eqs. (1) and (4) – which implies that, since the volume term in the critical energy equation is largely dominant with respect to the surface term, the critical energy \( E_{c} \) can be regarded to be proportional to \(R_c^3\), and then to 1/\(SH^{3}\).
On the other hand, since \( R_{c} \) is the natural length scale of the process, the critical deposition length \({ L_{c} }\) can be expressed in units of the critical diameter of the vapour bubble
where \({ k_{D} }\) represents the so-called nucleation parameter, whose value, as well as its possible dependence on \({ SH }\) or \({ E_{c} }\), are not known a priori, but have to be estimated by comparing the experimental count rate at several operating conditions with the corresponding predictions of Monte Carlo simulations combined with the application of the nucleation model.
Actually, different possible values of the nucleation parameter are reported in the literature ranging from 1 to 10 or more, yet, a value of the order of 3, regardless of the nature of the sensitive liquid, seems to find possible theoretical justifications, as e.g. discussed by Norman and Spiegel [14], and Bell et al. [15]. Moreover, according to Archambault et al. [8], the value of \({ k_{D} }\) should be expected to increase as the critical energy is increased.

Stopping power in \(\hbox {C}_3\hbox {F}_8\) at \(25~^{\circ }\text {C}\) for carbon, fluorine and alpha particles (from SRIM package). The region of the parameter space in which nucleation is permitted is highlighted
3 Background measurements and detector response to \(\alpha \)-decay events
The main strength of bubble-chamber detectors using superheated liquids is that they can be operated in such thermodynamic conditions to make them insensitive to electron recoils and minimum ionizing particles, which is the case of the aforementioned operating conditions of the MOSCAB detector. This means that the only remaining sources available for bubble nucleation are neutrons and \(\alpha \)-decays occurring inside the liquid. However, it must be pointed out that \(\alpha \)-particles have a stopping power always lower than that of fluorine and carbon ions, as recently discussed by Ardid et al. [10]. This implies that it is possible to find a region in the parameter space (E, dE/dx) where the detector maintains its sensitivity to nuclear recoils of fluorine and carbon ions, becoming at the same time insensitive to \(\alpha \)-particles, whose stopping power, even at the Bragg peak, is lower than that required for bubble nucleation, as displayed in Fig. 2, in which the stopping powers in \(\text {C}_3\text {F}_8\) at \(25~^{\circ }\text {C}\) for fluorine and carbon ions are compared with the stopping power typical for an \(\alpha \)-particle.
Additionally, it must be considered that, although the daughter nuclei emitted in the \(\alpha \)-decay process, namely \(^{218}\text {Po}\), \(^{214}\text {Pb}\) and \(^{210}\text {Pb}\) in the case of the \(^{222}\text {Rn}\) decay chain, have a remarkable stopping power, much higher than \(^{12}\text {C}\) and \(^{19}\text {F}\), their kinetic energy is rather limited. In fact, the highest energy of a naturally emitted \(\alpha \)-particle is 8.79 MeV, from the decay of \(^{212}\text {Po}\) in the Thorium decay chain, which implies a kinetic energy of the corresponding recoiling nucleus lower than 170 keV. Considering that the energy released by the recoiling nucleus and some amount of the energy deposited by the \(\alpha \)-particle along its track can add up, it is expected that at a critical energy around 200 keV the detector becomes insensitive to \(\alpha \)-decay processes.

Background count rates of the MOSCAB detector equipped with the 18 L vessel filled with 13 L of \(\hbox {C}_3\hbox {F}_8\) plotted versus both the critical energy \( E_{c} \) and the superheat parameter \( SH \)
A detailed study of this behaviour has been conducted with the MOSCAB detector located in Hall C of LNGS underground laboratories. The detector was equipped with both the 2 L and the 18 L vessels, filled with 1.2 L and 13 L of \(\text {C}_3\text {F}_8\), respectively, and, as said earlier, operated in thermodynamic conditions tuned to obtain a superheat parameter \( SH \) ranging roughly between 0.05 and 0.1, which corresponds to an approximate critical energy range between 100 keV and 500 keV. In particular, a campaign of measurements more than 2400 hours long has been performed from February 2020 to July 2021 to characterize the background of the detector equipped with the 18 L vessel, whose results are shown in Fig. 3, confirming the data previously obtained using the 2 L vessel.
It is apparent that the background count rate dramatically decreases as \(E_c\) increases from 100 keV to 200 keV, i.e., as SH decreases from 0.09 to about 0.07, reaching values consistent with the expectation based on the neutron flux existing inside the Gran Sasso underground laboratories, which confirms that the main intrinsic background source of the detector is represented by \(\alpha \)-decays (mostly due to the \(^{222}\text {Rn}\) chain) and that when the detector is operated at \(SH \le 0.07\) its internal background rate becomes lower than or at least of the same order of magnitude of the rate due to the extremely low environmental neutron flux (see Sect. 6).
4 Detector response to fast neutrons
4.1 Data taking
To measure the detector sensitivity, the bottom of the MOSCAB bubble chamber includes a vertical sleeve allowing to locate a calibration source just below the quartz vessel to minimize the amount of water between the source and the target liquid. Therefore, the response to neutrons of the detector operated in the same thermodynamic conditions as those indicated before was measured using a \({^{241}}\)AmBe neutron source consisting of a 40 kBq \({^{241}}\)Am alpha source coupled with a 0.25 mm-thick beryllium foil encapsulated inside a stainless steel cylinder.
The integral strength of the source has been measured by comparison with a reference \({^{241}}\)AmBe source [16] when dipped into a \(1.5~\text {m}^3\) Gd-loaded liquid scintillator counter. The measure, largely independent of the differences existing between the energy spectra and the flux anisotropies of the two sources, resulted in an integral source strength of \((0.94 \pm 0.04_{stat})\) n/s.
The \({^{241}}\)AmBe source has been used with the detector equipped with either the 2 L vessel or the 18 L vessel. The results related to the behaviour of the detector equipped with the 18 L vessel filled with 13 L of \(\text {C}_3\text {F}_8\), obtained from December 2019 to April 2021 during more than 2000 hours of measurement, are reported in Fig. 4, where the distribution of the recorded event rates is plotted versus the critical energy \(E_c\) and the superheat parameter SH. In the same figure, the background count rates already shown in Fig. 3 are also displayed for comparison purposes. The horizontal error bars represent the standard deviations of \( E_{c} \) or \( SH \), which is mainly due to the instrumental uncertainties and hence constant with respect to \( SH \), whereas the vertical error bars represent the uncertainty of the mean count rate.

Event rates of the MOSCAB detector equipped with the 18 L vessel, plotted versus both \( E_{c} \) and \( SH \). Full down triangles (black) represent the background count rate, while the red dots represent the event rate recorded using the \(^{241}\)AmBe n-source
It is apparent that, even for superheat conditions such that the background count rate is negligible, i.e., lower than one event per 10 days, the detector maintains its sensitivity to neutron induced ion recoils.
4.2 Detector response simulation
The modelling of the detector response is based on the bubble nucleation process described earlier and summarized by Eq. (5), which defines the nucleation parameter \(k_{D}\), whose values have been determined by the comparison between each experimental bubble rate detected using the mentioned \(^{241}\)AmBe neutron source located beneath the 2 L vessel or the 18 L vessel and the results of simulations carried out in the same thermodynamic conditions.
The input \({^{241}}\)AmBe spectrum used for simulations is the ISO 8529-1 standard spectrum [17], whereas the source is supposed to be point-like and the neutron flux is assumed to be isotropic. In order to account for the effects consequent to the use of the ISO 8529-1 standard spectrum, the \({^{241}}\)AmBe source has been simulated and the differences between the recoil spectra of carbon and fluorine ions in \(\text {C}_3\text {F}_8\) have been evaluated, resulting sub-dominant with respect to the uncertainties related to the source isotropy.
In this regard, a first approach estimation of the isotropy of the neutron flux emitted by the source has been obtained by measuring with the source cylinder placed upside down inside the source-housing of the detector. In particular, dividing the total emitted neutron flux into the North and South hemispheres, with the zenith axis normal to the beryllium foil, the difference between the fluxes emitted across the two hemispheres resulted to be less than 15% of the total source strength. A similar result was obtained also by Paaren and Lee [18] who simulated a neutron source [Patent No: 62/529, 583.] having a geometry very similar to that of our source. Therefore the flux anisotropy of the source is accounted for through a systematic uncertainty of the source strength, that we conservatively estimated to be equal to 15%.
The effects of the neutron transport and elastic and inelastic interactions with the fluorine and carbon nuclei of the sensitive liquid are evaluated by the way of the MCNP 6.2 code [19] and the SPECTRA-PKA code [20]. The energy distributions of the recoiled ions, in conjunction with the stopping power data for \(^{19}\text {F}\) and \(^{12}\text {C}\) in \(\text {C}_3\text {F}_8\) at temperature \(T_L\) calculated by the way of the SRIM code, are then used to determine the critical deposition length \(L_c\) along which, in the continuous slowing-down approximation, a recoiled ion deposits an average energy \(E_{dep}\) at least equal to the critical energy \(E_c\), such that the simulated and experimental count rates are the same.
Accordingly, denoting as \((d \dot{N}_r/dE)_C\) and \((d \dot{N}_r/dE)_F\) the rate of carbon and fluorine recoiled ions per unit energy, respectively, a pair of threshold recoil energies \(E_{th}^C\) and \(E_{th}^F\) can be determined for each value of \( E_c \) such that the nucleation rate \(\dot{N}_{ev}(E_c,k_D)\) is
Thus, once the numerical count rate is imposed to be the same as the experimental one and the critical deposition length \(L_c\) is assumed to be the same for any ionizing particle, the value of \(k_D\) can be calculated by integrating the reciprocal of the stopping power for either \(^{12}\)C or \(^{19}\)F (see Appendix A)

The nucleation parameter \(k_D\) as a function of the critical energy \(E_c\) and the superheat parameter SH. The red dots and blue triangles are obtained by the measurements with the 18 L and the 2 L vessel respectively, only statistical errors being considered. The best fit curve is shown with the 1\(\sigma \) region shaded in grey
The distribution of the values obtained for the nucleation parameter \(k_D\) is displayed in Fig. 5 versus the critical energy \(E_c\) and the superheat parameter SH, showing that the critical deposition length is practically independent of the volume of the sensitive liquid, which means that \(k_D\) can be considered to be a characteristic of the target liquid and its degree of metastability. As far as the interpolation curve is concerned, it must be noticed that within the investigated energy range the electronic stopping power for both fluorine and carbon ions is largely dominant with respect to the nuclear counterpart and, since its value is directly proportional to the ion speed, as described by Lindhard [21], the solution of each integral in Eq. (7) can be assumed to be proportional to \(E_c^{1/2}\). Therefore, taking into account the afore-mentioned proportionality relation \(R_c \propto E_c^{1/3}\), the nucleation parameter \(k_D\) is expected to be proportional to \(E_c^{1/6}\), which can be expressed using the general form:
Actually, a satisfactory best fit of the data is obtained when the values of the two empirical constants a and b are assumed to be 0.42 and 1.70, as shown in Fig. 5 where the 1-\(\sigma \) region is shaded in grey. It seems worth pointing out that the uncertainties related to the source strength, which produce an overall uncertainty of the order of 15%, affects the values of the nucleation parameter by less than 5%, its distribution against the critical energy \(E_c\) remaining substantially unchanged.
The procedure described above allows to determine a direct relationship between the metastability degree at which the equipment is operated, identified by the reduced superheat parameter SH, and the neutron energy threshold \(E_{th}^n\). In fact, the recoil energy thresholds \(E_{th}^C\) and \(E_{th}^F\) establish the minimum amount of kinetic energy needed to the recoiled ion to produce a bubble nucleation and then, taking into account the kinematic factor, the corresponding neutron energy threshold \(E_{th}^n\). Indeed, in the entire investigated energy range such a neutron energy threshold is determined by carbon, as displayed in Fig. 6, where the distributions of \(E_{th}^n\), due to recoiling \(\mathrm {^{12}C}\) and \(\mathrm {^{19}F}\) nuclei, are plotted versus both \(E_c\) and the \( SH \). According to the data, the relationships existing between the neutron threshold \(E_{th}^n\) and both the critical energy and the superheat parameter are well approximated by the following equations

The neutron energy threshold as a function of \( E_{c} \) and SH. The red dots and blue triangles are obtained by the measurements with the 18 L vessel and the 2 L vessel respectively. Small for F nuclei and large for C nuclei
5 Efficiency curves
The bubble nucleation model based on Eqs. (2)–(5) and (8) exhaustively describes the behaviour of the MOSCAB detector, at least in the critical energy range \(100~\text {keV}\le E_{c} \) \( E_{c} \le 500~\text {keV}\), thus allowing to generate, via MCNP simulations and subsequent data processing, sets of response functions using mono-energetic neutron sources.
The detection efficiency curves computed for a point-like source located just below the bottom of the 18 L vessel filled with 13 L of \(\text {C}_3\text {F}_8\) are displayed in Fig. 7, where the distributions of the expected number of nucleation events per emitted neutron are plotted against the neutron energy, using the critical energy \( E_{c} \) as a parameter. The counterintuitive decreasing behaviour that can be observed for the 300 keV curve between 3 MeV and 4.5 MeV is a direct consequence of the decrease of the neutron-carbon elastic scattering cross-section, carbon being the sole active ion in the considered energy interval, as can be inferred from Fig. 6. On the other hand, when the energy of the incident neutrons is higher than 5 MeV, fluorine starts giving its contribution, which results in the subsequent efficiency increase. Similar response functions have also been obtained using the 2 L vessel filled with 1.2 L of \(\text {C}_3\text {F}_8\). Notice that, due to the location of the source and its isotropic emission, the maximum reachable detection efficiency is of about 35% for the 18 L vessel, and about 20% for the 2 L vessel due to the different geometry of the two vessels.

Efficiency functions of the MOSCAB detector versus the neutron energy. The efficiencies curves are calculated for a point-like source located at the bottom of the 18 L vessel filled with 13 L of \(\hbox {C}_3 \hbox {F}_8\) and different values of the critical energy \( E_{c} \)
The obtained efficiency curves have then been employed to determine the rates of nucleation events consequent to the emission by the \(^{241}\)AmBe neutron source used in the experimental campaign. The comparison between the simulated count rates and the experimental data is reported in Fig. 8 for the 2 L and the 18 L vessels. The excellent agreement proves the reliability of the developed nucleation model, which shows to be effective regardless of the amount of the target liquid and the geometry of the vessel.
Thus, using this bubble-chamber detector, placed in a very low neutron background environment, i.e., an underground laboratories, it is possible to characterize a neutron source and, if the energy spectrum is known, determine its activity with very high sensitivity in a reasonable time. In fact, if the rate of neutrons emitted by the source per unit energy is written as
where A is the source activity and \(g_n(E)\) is the normalized spectrum of the neutron source, then the nucleation rate detected when the critical energy is set to \( E_{c} \) can be expressed as
in which \(G(E_c,E) \) is the efficiency function describing the response of the detector to neutrons emitted by a point-like source located in the source-housing of the equipment. Accordingly, the minimum detectable source activity can be evaluated as:
in which \(\dot{N}_{s}\) represents the 99% CL upper limit of the background count rate, or the lower discernible count rate due to a neutron source.

Event rate response of the MOSCAB detector to the \(^{241}\)AmBe neutron source equipped with the 18 L and the 2 L vessels filled with \(\hbox {C}_3\hbox {F}_8\), plotted versus both \( E_{c} \) and \( SH \). The red dots and blue triangles represent the count rate detected inside the 18 L and the 2 L vessels respectively. The black dots represent the corresponding results from the Monte Carlo simulations
If the external background conditions are the same as those of the LNGS underground laboratory, the results achieved for an isotropic point-like neutron source located inside the detector source-housing, for example a \(^{252}\)Cf source, are listed in Table 1 for different values of the critical energy \( E_{c} \). Thus, a \(^{252}\)Cf source with an activity of \(1\times 10^{-3}\) neutrons per second could be disentangled from the background at 99% CL by a measurement having a duration of the order of ten days. Of course, should both the activity and the energy spectrum of the source be unknown, the coupling of the procedure discussed above with an unfolding technique can effectively be used to fully characterize the neutron source emission.

Event rates of the MOSCAB detector equipped with the 18L vessels, plotted versus both \( E_{c} \) and \( SH \). The red dots represent the detector count rate when the \(^{241}\)AmBe source is located inside the source-housing, while the blue stars represent the count rate when the same source is placed in contact with the outer surface of the detector. The black dots reports the corresponding results from the simulations. The background count rate, represented using black down triangles, is also reported and compared with the count rate expected from the environmental fast neutron flux as calculated by Wulandari et al. [5] for the Hall C of the Gran Sasso Laboratories (gray line)
The validation of the simulation of the detector behaviour, which the efficiency curves are derived from, has been carried out by changing the experimental conditions, i.e., by moving the \(^{241}\)AmBe source from the source-housing at the bottom of the quartz vessel to the outside of the detector, in direct contact with its external surface, again using the 18 L vessel filled with 13 L of \(\text {C}_3\text {F}_8\). The new count rates plotted versus both \( E_{c} \) and \( SH \) are displayed in Fig. 9, where the data previously obtained with the same neutron source located inside the source-housing of the detector are also reported for comparison, revealing that the presence of the water thermal bath surrounding the quartz vessel containing the target liquid, as well as the stainless-steel boundary wall of the detector, give rise to an attenuation of the neutron flux emitted by the \(^{241}\)AmBe source of the order of \(10^2\). In the same figure, the expected rates obtained by the Monte Carlo simulations and subsequent post-processing are also represented using black dots, whose satisfactory degree of agreement with the experimental data makes us confident enough in the reliability of both the nucleation model and the detector simulation procedure.

Efficiency functions of the MOSCAB detector versus the neutron energy, calculated for a spherical (3 m diameter) isotropic neutron source surrounding the detector equipped with the 18 L vessel filled with 13 L of \(\hbox {C}_3 \hbox {F}_8\) and different values of the critical energy \( E_{c} \)
6 Monte Carlo based sensitivity determination
The efficiency functions \(G'(E_c,E)\) of the MOSCAB detector affected by a diffuse flux of neutrons, obtained by simulating a neutron emission by a spherical surface having a diameter of 3m inside which the detector is enclosed, are reported in Fig. 10, the change in slope occurring around E =10 MeV being due to the rise of the n-capture cross sections of the oxygen contained into the water of the thermal bath. Following the same procedure employed for a neutron source located inside the source-housing, the minimum detectable diffuse neutron flux at 99% CL can be calculated as:
where S is the surface area of the sphere surrounding the detector, from which the incoming simulated neutrons take origin.
As an example of application of Eq. (14) the contribution of the environmental background of LNGS to the background count rate of the detector has been calculated. A detailed discussion on the low energy component of the neutron flux inside LNGS underground laboratories can be found in the study executed on this topic by Wulandari et al. [5], according to which the flux is dominated by neutrons produced in the concrete layer, thus implying that the neutron flux is practically independent of the specific location considered. Fission and (\(\alpha , \hbox {n}\)) reactions contribute to the total production rates but, while the spontaneous fission of \({^{238}\text {U}}\) mainly produces neutrons having energies below 4 MeV, the (\(\alpha , \hbox {n}\)) reactions are substantially responsible for the production of neutrons with higher energies. Of course, an increase in the water content of the rock or the concrete layer can determine a neutron flux decrease due to the higher hydrogen content and a consequently higher moderation efficiency. Thus, based on the neutron spectrum calculated by Wulandary and co-workers for the Hall C of LNGS, the efficiency curves displayed in Fig. 10 are used to determine the nucleation event rate \(\dot{\mathrm {N}}_{\mathrm {W}}\) expected inside the detector equipped with the 18 L vessel filled with 13 L of \(\text {C}_3\text {F}_8\), as listed in Table 2, in which the measured background rate \(\dot{\mathrm {N}}_{\mathrm {bk}}\) is also reported for comparison.
It is worth noticing that for \( E_{c} \le \) 100 keV the event rate of the detector due to internal \(\alpha \)-decay events exceeds the environmental background, while for \( E_{c} \ge \) 300 keV both the calculated and measured event rates, become lower than one event per ten days. In the energy region between these two values, the experimental count rate can be ascribed to be due to the environmental background, as shown in Fig. 9 and reported in Table 2.
The general agreement between the detector count rate and the expectations due to the neutron background at LNGS corroborates the use of this detector to measure low fluxes of fast neutrons in what we could define intrinsic background-free conditions. Further works will be addressed to the study of an optimal layout of the detector to execute measurements of neutron fluxes even at energies above 20 MeV.
7 Conclusions
The MOSCAB bubble-chamber, originally designed for the direct observation of WIMPs in the spin-dependent channel, has been employed for the detection of fast neutrons using different configurations of the equipment and different amounts of sensitive liquid.
First of all, it has been shown that the detector can be operated at metastability degrees such that the target liquid is sensitive only to neutrons. Actually, this occurs when the reduced superheat parameter \( SH \) is kept lower than 0.07, or the critical energy \( E_{c} \) is kept higher than nearly 200 keV, which approximately corresponds to a 2.5 MeV neutron energy threshold required for nucleation. In these conditions the residual internal background rate of the detector is lower than 10 events \((y \cdot \hbox {kg})^{-1}\) which corresponds to less than one event every 2 days when the detector is equipped with the 18 L vessel, the steadiness of operation of the detector for long times of observation being extremely high, as we demonstrated by running the MOSCAB bubble-chamber during more than 4000 hours in the LNGS underground laboratories.
Subsequently, the detector response to fast neutrons, described through a bubble nucleation model assuming the existence of a critical deposition length of the energy released by the recoiled ions, has been investigated using a weak \(^{241}\)AmBe neutron source, which has allowed us to generate detection efficiency functions via Monte Carlo simulation and post-processing, whose validation has been performed experimentally.
Finally, thanks to the demonstrated reliability of the simulation procedure of the apparatus, we have shown that the MOSCAB bubble-chamber can be effectively used to measure the fast neutron activity of very weak n-sources, provided that the external neutron background is almost negligible, like in the LNGS underground laboratories. On the other hand, placed above ground without any additional shield, the same equipment could be exploited to monitor the cosmic ray flux variations through the neutron component of the Extensive Air Showers, as well as to detect the presence of any signal on top of the cosmic ray background. In particular, to study variations of the cosmic ray neutron flux whose energy spectrum extends to high energies, high neutron energy thresholds have to be set, which means that any other neutron source but cosmic rays will be practically absent, the information brought by the cosmic radiation being uncontaminated. Further investigations on this topic are scheduled to be conducted in the very next future.
Data availability
This manuscript has no associated data or the data will not be deposited. [Authors’ comment: The data used to support the findings of this study are included within the article].
References
B. Hahn, H.W. Reist, in Proceedings of the Fifth International Conference on High Energy Physics and Nuclear Structure, Uppsala, 18–22 June, 1973, ed. by G. Tibell (Uppsala University, Sweden, 1973), p. 191
R. Bertoni et al., Nucl. Instrum. Methods A 744, 61–68 (2014)
The MOSCAB Collaboration: A. Antonicci et al., Eur. Phys. J. C 77, 752 (2017)
F. Seitz, On the theory of the bubble chamber. Phys. Fluids 1, 2 (1958)
H. Wulandari et al., Astropart. Phys. 22, 313–322 (2004). arXiv:hep-ex/0312050v2
F. d’Errico (INVITED), Fundamental properties of superheated drop (Bubble) detectors, radiation protection dosimetry, 84(1-4), 55–62 (1999). https://doi.org/10.1093/oxfordjournals.rpd.a032796
P. Linstrom, W. Mallard, The NIST Chemistry WebBook (2001). https://doi.org/10.18434/T4D303
S. Archambault et al., New J. Phys. 13, 043006 (2011)
J.F. Ziegler, J.P. Biersack, M.D. Ziegler, SRIM-The Stopping and Range of Ions in Matter (SRIM Co., Chester, 2015). ISBN-1::1:978-0-9654207-1-6
M. Ardid et al., Eur. Phys. J. C 79, 961 (2019)
G. Bruno et al., Eur. Phys. J. C 79, 183 (2019)
D.V. Bugg, Progr. Nucl. Phys. 7, 2–52 (1959)
A.G. Tenner, Nucl. Instrum. Methods 22, 1–42 (1963)
A. Norman, P. Spiegler, Nucl. Sci. Eng. 16, 213–217 (1963)
C.R. Bell et al., Nucl. Sci. Eng. 53, 458–465 (1974)
E. Aprile et al., Phys. Rev. D 88, 012006 (2013). arXiv:1304.1427v2
ISO DIS 8529-1:2001 Reference Neutron Radiations—Part 1: Characteristics and Methods of Production. February 1, 2001
K.M. Paaren, H.K. Lee, Appl. Radiat. Isot. 146, 104–114 (2019). https://doi.org/10.1016/j.apradiso.2019.01.011
MCNP USER’S MANUAL Code Version 6.2 , Los Alamos National Laboratory report LA-UR-17-29981
M.R. Gilbert, J. Marian, J.-Ch. Sublet, J. Nucl. Mater. 467, 121–134 (2015)
J. Lindhard, M. Scharff, H.E. Schiøtt, Mat. Fys. Medd. Dan. Vid. Selsk. 33(14), 1–42 (1963)
Acknowledgements
The authors wish to thank all the staff of the Gran Sasso National Laboratories for their constant support and cooperation during these years. Some of the scientists who imagined and realized the MOSCAB detector, Pietro Negri and Antonino Pullia, are not with us anymore. We are left with their memory and their teachings.
Author information
Authors and Affiliations
Corresponding authors
Appendix A
Appendix A
A ion, with a certain energy is able to nucleate a bubble if the two conditions on its energy and energy deposition are verified
Denoting the recoil energy distribution of the i-th ion as \(\left( \frac{dr}{dE_r} \right) _i\), the bubble nucleation rate can be expressed as
in which \(H[\cdot ]\) is the Heaviside step function.
Hence
where \(S_i(E)=- \left( \frac{dE}{dl} \right) _i\) is the stopping power of the i-th ion of initial energy \(E_o\).
The presence of the Heaviside step function implies the existence of a pair of threshold recoil energies \(E_{th}^C\) and \(E_{th}^F\) for each value of \(E_c\), defined by the following two identities
thus implying
and
which means that the nucleation parameter \(k_D\), whose value has to be determined experimentally by comparing the calculated and measured nucleation rates, is a function of the critical energy \(E_c\), as well as a characteristic of the target liquid through the stopping power exerted upon the fluorine and carbon recoiled nuclei.
Rights and permissions
Open Access This article is licensed under a Creative Commons Attribution 4.0 International License, which permits use, sharing, adaptation, distribution and reproduction in any medium or format, as long as you give appropriate credit to the original author(s) and the source, provide a link to the Creative Commons licence, and indicate if changes were made. The images or other third party material in this article are included in the article’s Creative Commons licence, unless indicated otherwise in a credit line to the material. If material is not included in the article’s Creative Commons licence and your intended use is not permitted by statutory regulation or exceeds the permitted use, you will need to obtain permission directly from the copyright holder. To view a copy of this licence, visit http://creativecommons.org/licenses/by/4.0/.
Funded by SCOAP3
About this article

Cite this article
Bertoni, R., Bruno, G., Burgio, N. et al. Effective exploitation of a geyser bubble-chamber equipment as a background-free fast neutron detector. Eur. Phys. J. C 81, 1028 (2021). https://doi.org/10.1140/epjc/s10052-021-09800-7
Received:
Accepted:
Published:
DOI: https://doi.org/10.1140/epjc/s10052-021-09800-7