


Abstract
We present new catalogs of likely globular clusters (GCs) in 17 nearby spiral galaxies studied as part of the PHANGS Hubble Space Telescope (HST) Treasury Survey. The galaxies were imaged in five broadband filters from the near-ultraviolet through the I band. PHANGS-HST has produced catalogs of stellar clusters of all ages by selecting extended sources (from multiple concentration index measurements) followed by morphological classification (centrally concentrated and symmetric or asymmetric, multiple peaks, and contaminants) by visually examining the V-band images and separately by a machine-learning algorithm which classified larger samples to reach fainter limits. From both cluster catalogs, we select an initial list of candidate GCs which have B − V ≥ 0.5 and V − I ≥ 0.73 mag, then remove likely contaminants (including reddened young clusters, background galaxies misclassified by the neural network, and chance superpositions/blends of stars) after a careful visual inspection. We find that ≈86% of the color-selected candidates classified as spherically symmetric and 68% of those classified as centrally concentrated but asymmetric are likely to be GCs. The luminosity functions of the GC candidates in two of our 17 galaxies, NGC 628 and NGC 3627, are atypical, and continue to rise at least 1 mag fainter than the expected turnover near MV ∼ −7.4. These faint candidate GCs have more extended spatial distributions than their bright counterparts, and may reside in the disk rather than the bulge/halo, similar to faint GCs previously discovered in M101. These faint clusters may be somewhat younger since the age–metallicity degeneracy makes it difficult to determine precise cluster ages from integrated colors once they reach ≈1 Gyr.
Export citation and abstract BibTeX RIS

Original content from this work may be used under the terms of the Creative Commons Attribution 4.0 licence. Any further distribution of this work must maintain attribution to the author(s) and the title of the work, journal citation and DOI.
1. Introduction
Globular clusters (GCs) are ancient, gravitationally bound stellar systems that are among the oldest luminous objects in the Universe. They provide important insight to a broad range of fields in astrophysics, including stellar and chemical evolution (van Loon 2010), clues to the star formation and assembly histories of galaxies (Forbes et al. 2018), constraints on the epoch of reionization (Corbett Moran et al. 2014; Salvador-Solé et al. 2017; Ma et al. 2021), the role of dark matter in structure formation (Kruijssen et al. 2019; Reina-Campos et al. 2023), and the distribution of dark matter in present-day galaxies (Hughes et al. 2021).
The Hubble Space Telescope (HST) has revolutionized our understanding of GC systems in elliptical galaxies because early-type galaxies generally have simple, relatively dust-free morphologies and their cluster populations are predominantly old (though limited star formation can occur; Sedgwick et al. 2021). The GC systems in nearly all ellipticals have a lognormal distribution with a peak near MV ≈ −7.4 (Jordán et al. 2007; Villegas et al. 2010). The dispersion or width of the globular cluster luminosity function (GCLF) in ellipticals depends on the total magnitude of the host galaxy, with fainter galaxies having narrower smaller widths (Jordán et al. 2006, 2007).
Our understanding of GC systems in spiral galaxies remains far behind that in elliptical galaxies, since ongoing, higher-intensity star formation creates complex structures that limit our ability to separate ancient clusters from the many younger clusters that also form in these galaxies, even with HST imaging. The best-studied GC system in a spiral galaxy is that in the Milky Way. The GCLF in the Milky can be described by a lognormal distribution with a peak at MV = −7.29 ± 0.13 and a dispersion parameter of σ = 1.1 ± 0.1 mag (Secker 1992). This shape is similar to that found in ellliptical galaxies, but different from the luminosity and mass functions of open clusters in the Milky Way and massive young clusters in other spiral galaxies, which are well described by a power-law (e.g., M83: Bastian et al. 2012; Chandar et al. 2014; M51: Chandar et al. 2016; Antennae: Whitmore et al. 1999). The difference between the luminosity/mass functions of young and ancient clusters is believed to arise from the preferential destruction of lower-mass clusters over time, likely due to evaporation driven by two-body interactions within clusters, and also bulge–disk shocking as the cluster orbits the host galaxy (e.g., Fall & Zhang 2001).
Characterizing the GC systems in spiral galaxies beyond the Local Group requires multiband imaging with HST. The shape of the luminosity functions in the few spiral galaxies with well-studied GC systems are similar to those of early-type galaxies, with a peak MV ≈ −7.4 mag (Lomelí-Núñez et al. 2022). M101 is the single known exception, where the luminosity function of GC candidates continues to rise in a power-law fashion well below the expected peak (Barmby et al. 2006; Simanton et al. 2015). Currently, little is known about the faint end of the GCLF in spiral galaxies in general, since identifying even bright GCs and separating them from contaminants such as reddened young clusters and background galaxies can be challenging in these actively star-forming systems.
The PHANGS-HST survey (Lee et al. 2022) recently imaged 38 spiral galaxies in five broadband filters and has complementary CO 2-1 maps from Atacama Large Millimeter/submillimeter Array (ALMA; Leroy et al. 2021; Emsellem et al. 2022), and 2–21 μm imaging for half the sample from JWST (Lee et al. 2023) The collaboration has invested enormous effort to produce state-of-the art catalogs of ∼40,000 compact clusters of all ages (Wei et al. 2020; Whitmore et al. 2021; Deger et al. 2022; Lee et al. 2022; Thilker et al. 2022; Hannon et al. 2023; D. Maschmann et al. 2024, in preparation). These catalogs provide an ideal starting point to identify and study ancient GC populations in spiral galaxies. In this work, we begin by investigating the GC populations of 17 PHANGS-HST galaxies.
The rest of this paper is organized as follows. In Section 2, we summarize the data, photometry, and the pipeline that was used to produce the initial compact cluster catalogs. In Section 3 we select an initial list of GC candidates based on their colors, and describe the subsequent visual inspection of each candidate to assess if it is likely to be a GC or a contaminant. In Section 4, we present our new catalogs of ancient GCs in 17 PHANGS-HST spiral galaxies and assess the contamination rates from the initial cluster selection. In Section 5 we present the luminosity functions of our GCs, identify excess, faint populations in two of the 17 galaxies and investigate what they might be, and in Section 6 we state our conclusions and future studies using our new catalogs.
2. Observations, Detection, and Photometry
2.1. Galaxy Sample
Our sample includes 17 spiral galaxies from the PHANGS-HST sample (Lee et al. 2022), which cover a large range of morphological classifications (Sa through Sd, barred and unbarred), spiral arm type (flocculent and grand design), total star formation rate (SFR; 0.2–7.60 M⊙ yr−1), and mass (≈1010 –1011 M⊙), representative of the present-day spiral population. All target galaxies are ≲20 Mpc and fairly face on, as indicated in the three-color HST images in Figure 1. Our sample includes nearly half of the entire PHANGS-HST sample of 38 galaxies.
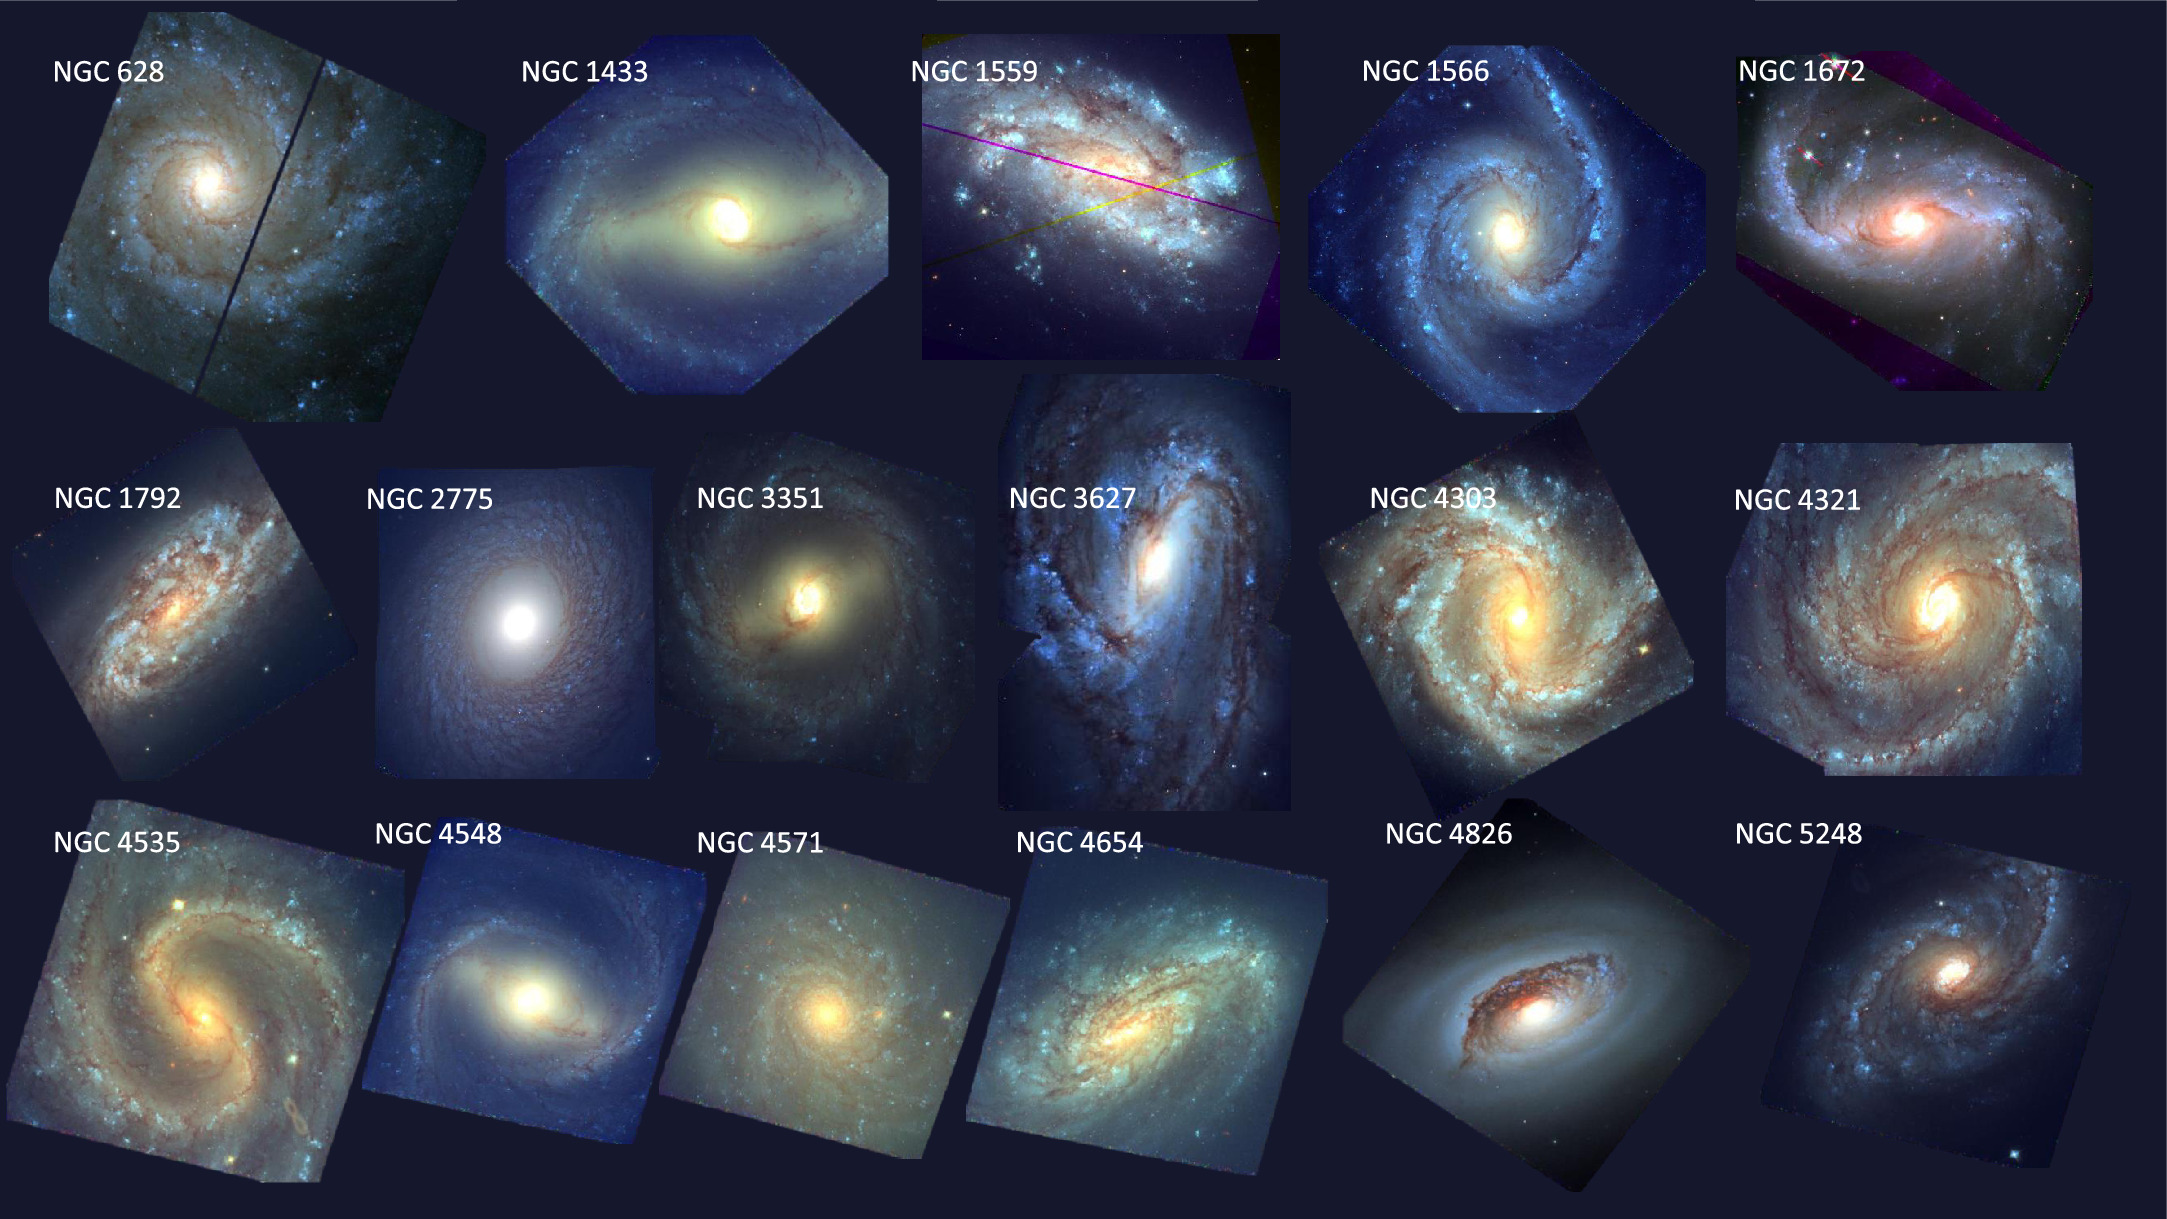
Figure 1. Color BVI images of the 17 PHANGS-HST galaxies studied in this work. The sample includes nearby face-on, massive spiral galaxies that cover a broad range of morphology, dust content, and spiral arm type.
Download figure:
Standard image High-resolution imageWe summarize the basic properties, including distance, total stellar mass (M*), star formation rate (SFR), and morphological type in Table 1. Distance determinations are from the compilation in Anand et al. (2021), and are based on a variety of methods. Anand et al. (2021) determined new distances to four of the galaxies based on the tip of the red giant branch (TRGB). For the rest, they carefully assessed distance estimates in the literature, which can vary in quality. They gave the highest preference to measurements based on the TRGB method and Cepheid variables. The next preference was for standard candle methods, such as the planetary nebula luminosity function (PNLF) and surface brightness fluctations. When no distance estimates based on stellar populations were available, modeling methods were used to infer distance, either from numerical modeling of their orbits within a group or from the Numerical Action Method of Shaya et al. (2017), which is a nonlinear model that attempts to reconstruct the 3D orbits of galaxies.
Table 1. Properties of the Sample Galaxies
| Galaxy Name | Distance | Method | Reference | logM* | SFRtotal | Morphology |
|---|---|---|---|---|---|---|
| (Mpc) | (M⊙) | (M⊙ yr−1) | ||||
| NGC 628 | 9.84 ± 0.63 | TRGB | 1 | 10.2 | 1.75 | SAc |
| NGC 1433 | 15.17 ± 1.52 | PNLF | 5 | 10.4 | 1.13 | SBab |
| NGC 1559 | 19.44 ± 0.44 | Mira | 6 | 10.2 | 3.76 | SBcd |
| NGC 1566 | 17.69 ± 2.00 | Group | 4 | 10.7 | 4.54 | SABb |
| NGC 1672 | 19.40 ± 2.91 | NAM | 2 + 3 | 10.6 | 7.60 | Sb |
| NGC 1792 | 16.20 ± 2.43 | NAM | 2 + 3 | 10.5 | 3.70 | SAbc |
| NGC 2775 | 23.15 ± 3.47 | NAM | 2 + 3 | 11.1 | 0.87 | SAc |
| NGC 3351 | 9.96 ± 0.33 | TRGB | 1 | 10.3 | 1.32 | Sb |
| NGC 3627 | 11.32 ± 0.48 | TRGB | 1 | 10.7 | 3.84 | SABb |
| NGC 4303 | 16.99 ± 3.04 | Group | 4 | 10.6 | 5.33 | Sc |
| NGC 4321 | 15.21 ± 0.49 | Cepheid | 7 | 10.7 | 3.56 | SABbc |
| NGC 4535 | 15.77 ± 0.37 | Cepheid | 7 | 10.5 | 2.16 | SABc |
| NGC 4548 | 16.22 ± 0.38 | Cepheid | 7 | 10.7 | 0.52 | SBb |
| NGC 4571 | 14.90 ± 1.20 | Cepheid | 8 | 10.0 | 0.29 | SAd |
| NGC 4654 | 21.98 ± 1.16 | Group | 7 | 10.5 | 3.79 | SABcd |
| NGC 4826 | 4.41 ± 0.19 | TRGB | 9 | 10.2 | 0.20 | SABa |
| NGC 5248 | 14.87 ± 1.34 | Group | 4 | 10.3 | 2.29 | SABbc |
Note. Distance, stellar mass (M*), and SFR are taken from the compilation in Lee et al. (2022). Distance measurements were originally compiled in Anand et al. (2021). Methods used to derive distances are shown in column 3, and include TRGB, PNLF, Cepheid variables (Cepheid), Mira variables (Mira), the Numerical Action Method (NAM), and galaxy group velocity (Group). Citations: (1) Jacobs et al. (2009), (2) Shaya et al. (2017), (3) Kourkchi et al. (2020), (4) Kourkchi & Tully (2017), (5) Scheuermann et al. (2022), (6) Huang et al. (2020), (7) Freedman et al. (2001), (8) Pierce et al. (1994), and (9) Anand et al. (2021).
Download table as: ASCIITypeset image
The SFRs are based on the total far-ultraviolet luminosities from the Galaxy Evolution Explorer and infrared luminosities from the Wide-field Infrared Survey Explorer (WISE) for each galaxy. The SFRs were derived using the prescriptions laid out in Leroy et al. (2019). The estimates of stellar mass are derived from Spitzer IRAC 3.6 μm or WISE1 3.4 μm fluxes (when Spitzer is unavailable), using the prescription in Leroy et al. (2021).
2.2. Observations, Source Detection, and Photometry
We start from an internal release version of the candidate cluster catalogs produced by the PHANGS-HST project (PI: J.C. Lee, GO-15654). For the full public cluster catalog release, see D. Maschmann et al. (2024, in preparation; 10.17909/jray-9798). PHANGS-HST is a Cycle 26 Treasury program, which obtained multiband imaging of 38 nearby spiral galaxies from 2019–2021, in the near-ultraviolet (NUV) F275W/(NUV) filter as well as the F336W/(U), F438W/(B), F555W/(V), and F814W/(I) filters, taken primarily with the WFC3 camera, which has an ≈160'' × 160'' field of view. Archival observations using the Advanced Camera for Surveys/WFC camera were used when available. Here, we present results for 17 of these galaxies.
Data reduction, source detection, and photometry are described in detail in Lee et al. (2022), Thilker et al. (2022), and Deger et al. (2022). The processed images in each filter are in units of electrons s−1 and aligned to a common grid with a scale of 0 04 pixel−1 , with north up and east to the left. The absolute astrometry of each image is determined from Gaia DR2 sources (Gaia Collaboration et al. 2018; Lindegren et al. 2018). The pixel scale of 004 pixel−1 corresponds to a spatial sampling of 0.86 pc pixel−1 in the nearest galaxy (4.41 Mpc) to 4.5 pc pixel−1 in the furthest galaxy (23.15 Mpc). The HST/WFC3 resolution varies with wavelength across the NUV–optical range, and with detector position, but is best (∼007–008 FWHM postpixelation) in V band, degrading by about 10% in NUV and I.
Sources were detected using a combination of DOLPHOT (Dolphin 2016) and DAOStarFinder (Thilker et al. 2022). To ensure all clusters (even the most extended) were recovered as sources, a secondary detection pass using photutils/DAOStarFinder with a slightly broaden kernel was conducted and the source lists were combined. These sources include individual stars and stellar clusters, compact associations, background galaxies, and foreground stars. The "all source" catalogs contain up to a few hundred thousand objects per galaxy. Aperture photometry was performed for each source using a 4 pixel radius aperture, which contains ≈50% of the flux of a typical cluster at a distance of 12 Mpc, the median PHANGS-HST galaxy distance. The background level was determined in a 7–8 pixel annulus. An empirical aperture correction is applied as described in detail by Deger et al. (2022) and summarized by Thilker et al. (2022). Our photometry is in the VEGAMAG system. In the rest of this paper, we refer to the F275W filter as NUV, F336W as U band, F435W or F438W as B band, F555W as V, and F814 as I, for simplicity.
2.3. Initial Selection of Cluster Candidates from PHANGS-HST
Initial cluster candidates were selected from the "all source" catalogs largely based on their structural parameters and a magnitude cut, specifically a combination of concentration indices (CI), where CI is the difference in magnitude measured in two different apertures. Extended sources have larger values of CI than point sources. A total of eight apertures were used to calculate two "multiple" concentration indices (MCI). The inner and outer MCI values are renormalized averages of the CI measured across different apertures: MCIinner uses four apertures between 1 and 2.5 pixels in radius, and MCIouter uses four apertures between 2.5 and 5 pixel radii. These CI were measured on synthetic clusters, which are generated from IMFIT (Erwin 2015), with an assumed Moffat profile with parameters chosen to represent the full range of cluster sizes and luminosities.
A model cluster region in MCI space was defined by the synthetic clusters (see Thilker et al. 2022 for details), and applied to all detected sources to select an initial morphologically guided yet maximally inclusive catalog of potential clusters. Because the synthetic clusters were computed specifically for the distance of each galaxy, the model cluster region varied with distance.
2.4. Cluster Classification by Visual Inspection
Each candidate cluster was carefully scrutinized in the V band by coauthor B. Whitmore, and classified into one of the following morphological types:
- 1.Class 1: single-peaked, symmetric source with a radial profile more extended than a point source.
- 2.Class 2: single-peaked, asymmetric source with a radial profile more extended than a point source.
- 3.Class 3: compact stellar association, defined as having multiple peaks within a fixed radius.
- 4.Class ≥ 4: various contaminants (e.g., blends, background galaxies, pairs, triplets, foreground stars, etc.).
One key strength of this approach is the ability to identify and eliminate most background galaxies and chance superpositions/blends of two or three stars. The main limitation is that a human can classify only a limited number of sources. Only the brightest ≈1000 cluster candidates in each galaxy enter the "human-classified" cluster catalogs, resulting in a faint magnitude limit which varies from galaxy to galaxy. The final sample of Class 1 + 2 human-classified sources includes 7867 total cluster candidates of all ages across our 17 galaxies (see also Table 1; D. Maschmann et al. 2024, in preparation).
2.5. Machine-learning Cluster Classification
The PHANGS-HST collaboration has also produced catalogs of cluster candidates that have been classified by machine-learning (ML) algorithms (Wei et al. 2020; Whitmore et al. 2021; Hannon et al. 2023). This approach has the advantage that more sources can be classified which reach fainter magnitudes. In this paper, we use the PHANGS ML candidate catalogs that were generated using the Visual Geometry Group (VGG) neural network.
The VGG19-BN neural network classifies sources using the same morphological class system as the human-based catalogs. A key advantage of the ML algorithm is the ability to classify sources based on all available (NUV, U, B, V, and I) filters rather than just the V-band image. Note that a single MCI polygon was applied to all galaxies to select the initial list of cluster candidates to be classified by the ML algorithm, whereas this polygon was tuned to each galaxy (and therefore more restrictive) for the initial candidate list for human classification.
The neural network was trained on a set of objects, previously classified by coauthor B. Whitmore, in 24 galaxies (Hannon et al. 2023) observed as part of the PHANGS-HST program, using five-band imaging of the identified clusters. Objects classified using the VGG-BN ML architecture matched the human classifications in PHANGS catalogs with ≈80% accuracy in Class 1 and ≈50% accuracy in Class 2 when tested over five PHANGS-HST galaxies (Whitmore et al. 2021).
Overall, the ML selection adds 11,326 unique Class 1 + 2 candidate clusters to the human catalogs. The vast majority of these sources are fainter than the magnitude limits of the human-classified catalogs. A comparison of the human- and ML-classified GC candidates above these brightness limits show that the source lists contain the same objects at the ≈80%–90% level in nearly all galaxies, with the ML-classified catalogs including a handful of sources. NGC 1566 and NGC 1792 are exceptions, with the final ML catalogs including 105 and 104 more GC candidates, respectively, than the final human-classified catalogs discussed in Section 3. The additional clusters in the ML catalogs are nearly all faint and close the magnitude limit of the human catalog.
After combining our human- and ML-classified catalogs at all magnitudes, we have a total of 19,193 candidate clusters of all ages across all 17 PHANGS-HST spiral galaxies. The full human- and ML-classified catalogs will be released in D. Maschmann et al. (2024, in preparation).
3. Production of GC Catalogs
One of the main goals of this work is to produce catalogs of ancient GCs with as few contaminants as possible that are complete down to a known magnitude limit. While the PHANGS-HST pipeline initially estimates the ages of clusters using standard spectral energy distribution (SED) fitting techniques (Adamo et al. 2017; Turner et al. 2021), it has been shown that more than 70% of ancient GCs can be incorrectly age dated due to the age–reddening–metallicity degeneracy for some galaxies (Whitmore et al. 2020; Turner et al. 2021; Hannon et al. 2022; Whitmore et al. 2023). While work is in progress to improve the SED fitting procedure to address this issue (e.g., Thilker et al. 2023), here we select candidate GCs independently of the SED-fit ages. Our catalogs can be used as a check on the results of improved SED fitting efforts. We return to this point in Section 3.5. Our strategy here is to apply a color-based initial selection to the human and ML catalogs described above to separate ancient GC candidates from the many younger clusters in our spiral galaxy sample, and then to perform a visual inspection of all sources which pass the color selection to identify and reject remaining contaminants. It is important to note that broadband colors of candidate GCs are subject to the age–metallicity degeneracy, which makes it quite challenging to distinguish clusters with ages ≈1 Gyr from those with ages ≈10 Gyr based on photometry alone. For this reason, we do not attempt to estimate the ages of our candidate GCs beyond identifying those which are ≈1 Gyr and older. For our purposes, candidate GCs have all of the morphological and integrated photometric properties expected of GCs in the Milky Way, meaning they are centrally concentrated, round, and extended (broader than the point-spread function (PSF)), have uniform red colors, and are not associated with the interstellar medium (ISM; dust, warm ionized gas, or molecular gas).
3.1. Initial Color Cuts
In Figure 2 we show two color–color diagrams of all Class 1 + 2 sources from the human-selected PHANGS-HST catalogs. With such large samples, a color–color diagram provides a key reference for stellar, cluster, and galaxy evolution studies (J. C. Lee et al. 2024, in preparation). The left panel shows U − B versus V − I colors, while the right panel shows B − V versus V − I. The diagrams include predictions from the solar metallicity (red) and the 1/50 solar (blue) evolutionary models of Bruzual & Charlot (2003; henceforth BC03). The models predict the intrinsic colors of extremely young (1 Myr) clusters to start at the top left of each diagram and to become redder as they age and move toward the bottom right (≈10 Gyr). The models do not include line or continuum nebular emission, and do not allow for binaries or rotation. The different metallicity models begin to diverge after a few 100 Myr, with the 1/50 solar model having bluer colors than the solar metallicity model at the same age due to the well-known age–metallicity degeneracy.
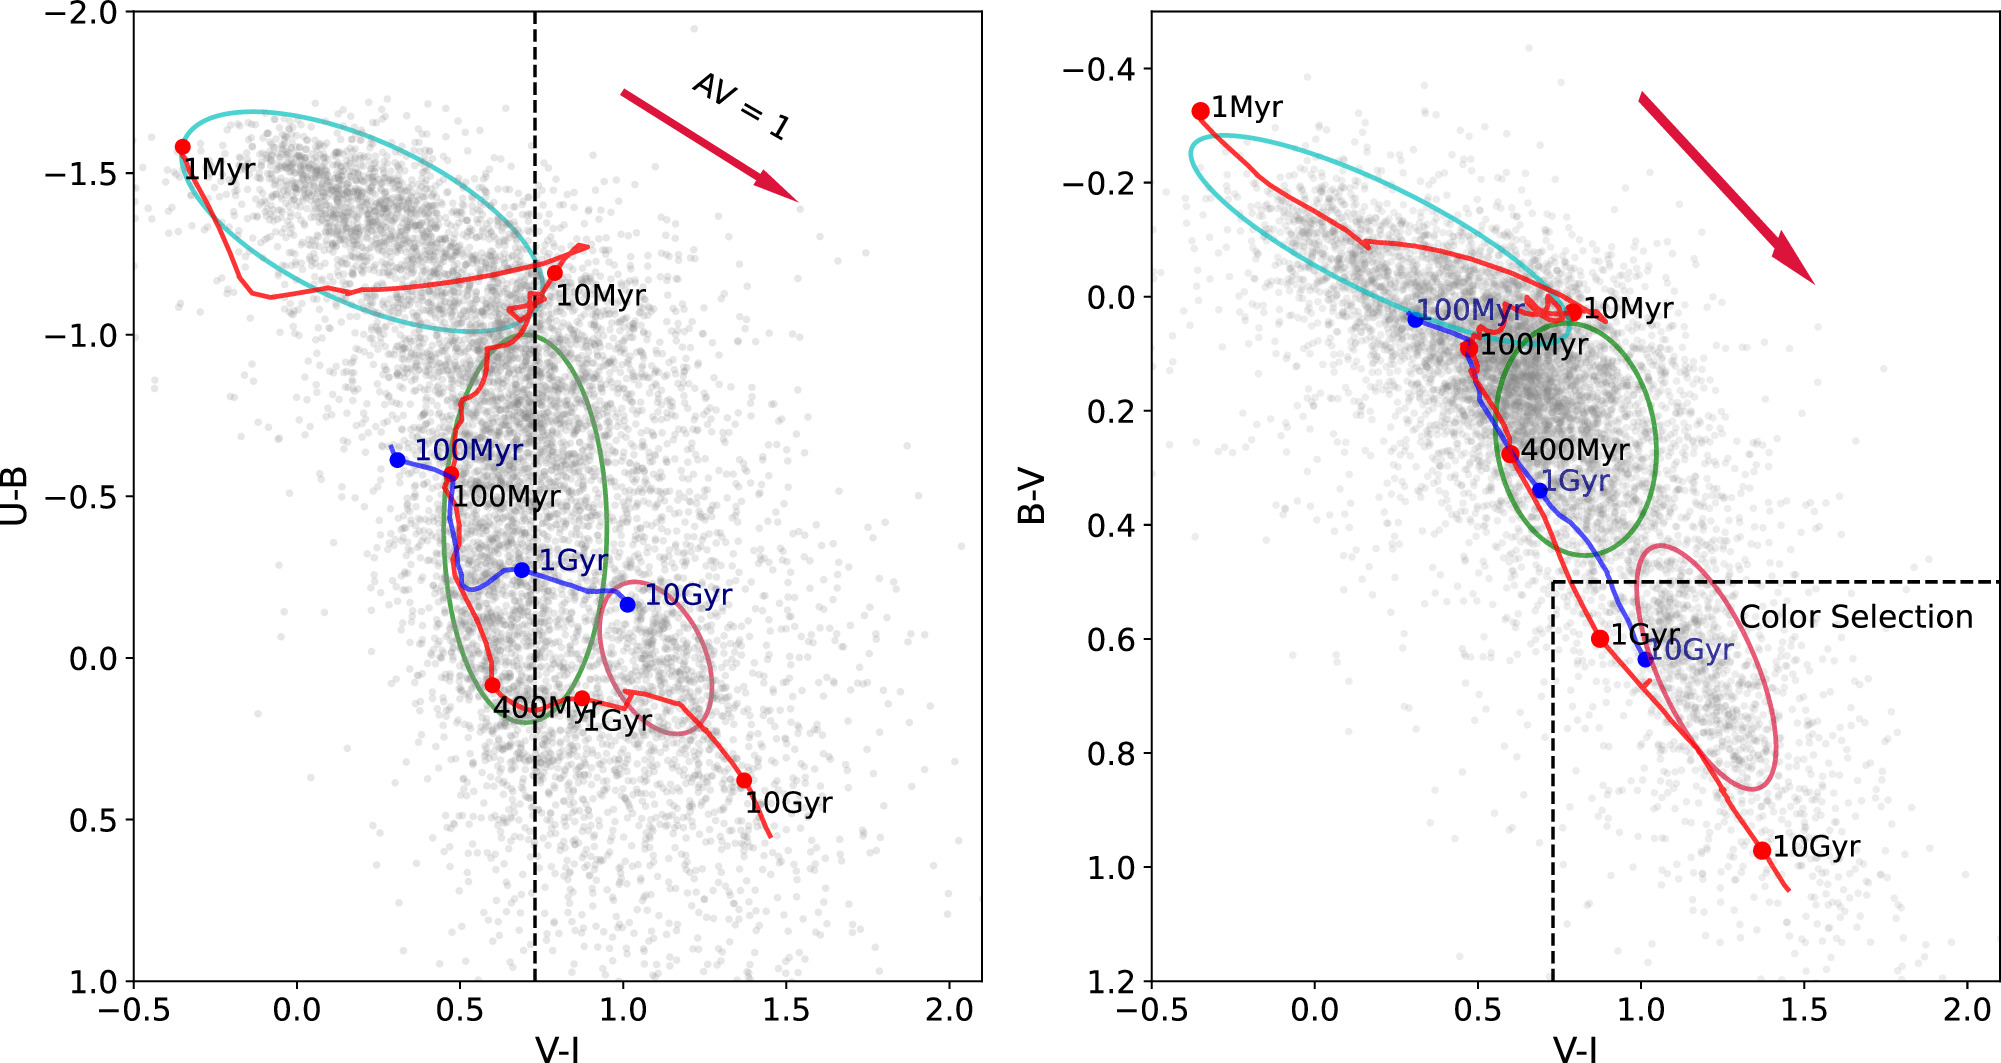
Figure 2. Color–color diagrams are shown for all human-selected Class 1 + 2 cluster candidates. U − B vs. V − I is shown on the left and B − V vs. V − I on the right. The predicted color evolution from the BC03 stellar population models are shown for solar metallicity (red) and 1/50 × solar metallicity (blue). The light blue oval at the upper left shows the "young cluster locus," the green oval shows the "middle-aged plume," and the red oval shows the "old GC clump." Dashed lines indicate the color cuts we use to select our initial list of GC candidates, B – V ≥ 0.5 and V – I ≥ 0.73. Only those candidates with significant U-band measurements are plotted in the left panel. The arrows represent the direction and amount of reddening for AV = 1.
Download figure:
Standard image High-resolution imageAs discussed in J. C. Lee et al. (2024, in preparation) and D. Maschmann et al. (2024, in preparation) there are three distinct features in the color–color diagram: the "young cluster locus," the "middle-aged plume," and the "old GC clump." Starting in the upper left, in line with the youngest ages predicted by the BC03 evolutionary model tracks, we see the young cluster locus (<10 Myr, blue contour). These very young clusters experience a range of reddening, from very little up to a few magnitudes in the V band. They follow the slope of the reddening vector shown as the red arrow in each panel. The middle-aged plume highlights intermediate-age clusters (≃30–400 Myr, green contour), which hug the curved portion of the solar metallicity evolutionary model. These tend to have little reddening. Finally, we see a distinct overdensity of clusters near the 10 Gyr mark of the 1/50 solar metallicity BC03 model, distinct from the intermediate-age sources, with V − I ≈ 1.0–1.4 and U − B between −0.2 and 0.5 mag. Many of these are the ancient GCs we are interested in for this work. The bluest portion of this population falls quite close to 12 Gyr clusters predicted by the 1/50 solar metallicity model. An important point is this old GC clump (red contour) separates from intermediate-age clusters in both color–color diagrams, although not as clearly in B − V versus V − I (D. Maschmann et al. 2024, in preparation)
To identify an initial list of candidate GCs, we select all Class 1 + 2 sources from the human- and ML-selected catalogs that have B − V ≥ 0.5 mag and V − I ≥ 0.73 mag. This selection is indicated by the dashed lines in Figure 2. We do not the NUV or U bands in our color selection because GCs are fainter at bluer wavelengths and hence have larger photometric uncertainties in these bands. Our color cuts are consistent with the intrinsic colors of Galactic GCs (Harris 1996, 2010). Our color selection yields 1262 (2305) GC candidates from the human-classified (ML-classified) catalogs. These 3567 sources form our initial list of GC candidates.
3.2. Visual Inspection of Globular Cluster Candidates
For each GC candidate, we perform a visual inspection using several diagnostic plots and three-color images to assess:
- 1.
- 2.Colors relative to model colors. We use both the U − B versus V − I and B − V versus V − I color–color diagrams and predictions from the BC03 evolutionary models as a way to check that the colors of each cluster are reasonable.
- 3.Presence or absence of ISM. We make use of archival HST Hα images of NGC 628, NGC 1433, NGC 1672, and NGC 3351 and ALMA CO maps for all galaxies to assess whether a candidate is associated with nearby ISM. The presence of ISM near a cluster indicates that it is likely to be young and reddened, rather than old with little reddening (see also Thilker et al. 2023).
- 4.Local environment. Is the cluster isolated, or in a crowded star-forming region? Is it in the spiral arms, between them, or in the outskirts? Candidates in crowded star-forming regions are more likely to be reddened, young clusters than ancient GCs.
Each of these properties offers its own set of challenges and limitations. For the cluster catalogs described in Section 2.4, which are based on visual classification, our independent classification process provides an important check which minimizes bias and unconscious shifting of selection criteria. Next, we show three representative examples from our initial GC candidate list.
3.2.1. Example 1: A Good GC
In Figure 3 we present an example of a likely GC that passed our visual inspection. The left (right) panel shows postage stamp images in B − V − I (B − V − CO). The B − V − I image shows the object is circular and centrally concentrated, it has a "soft" appearance because it is broader than the PSF, and it has a uniform color. The B − V − CO panel on the right shows there is no CO emission associated with the cluster, a strong indication that it is not reddened. The colors of the cluster are quite similar to those predicted for a metal-poor, ancient stellar system.
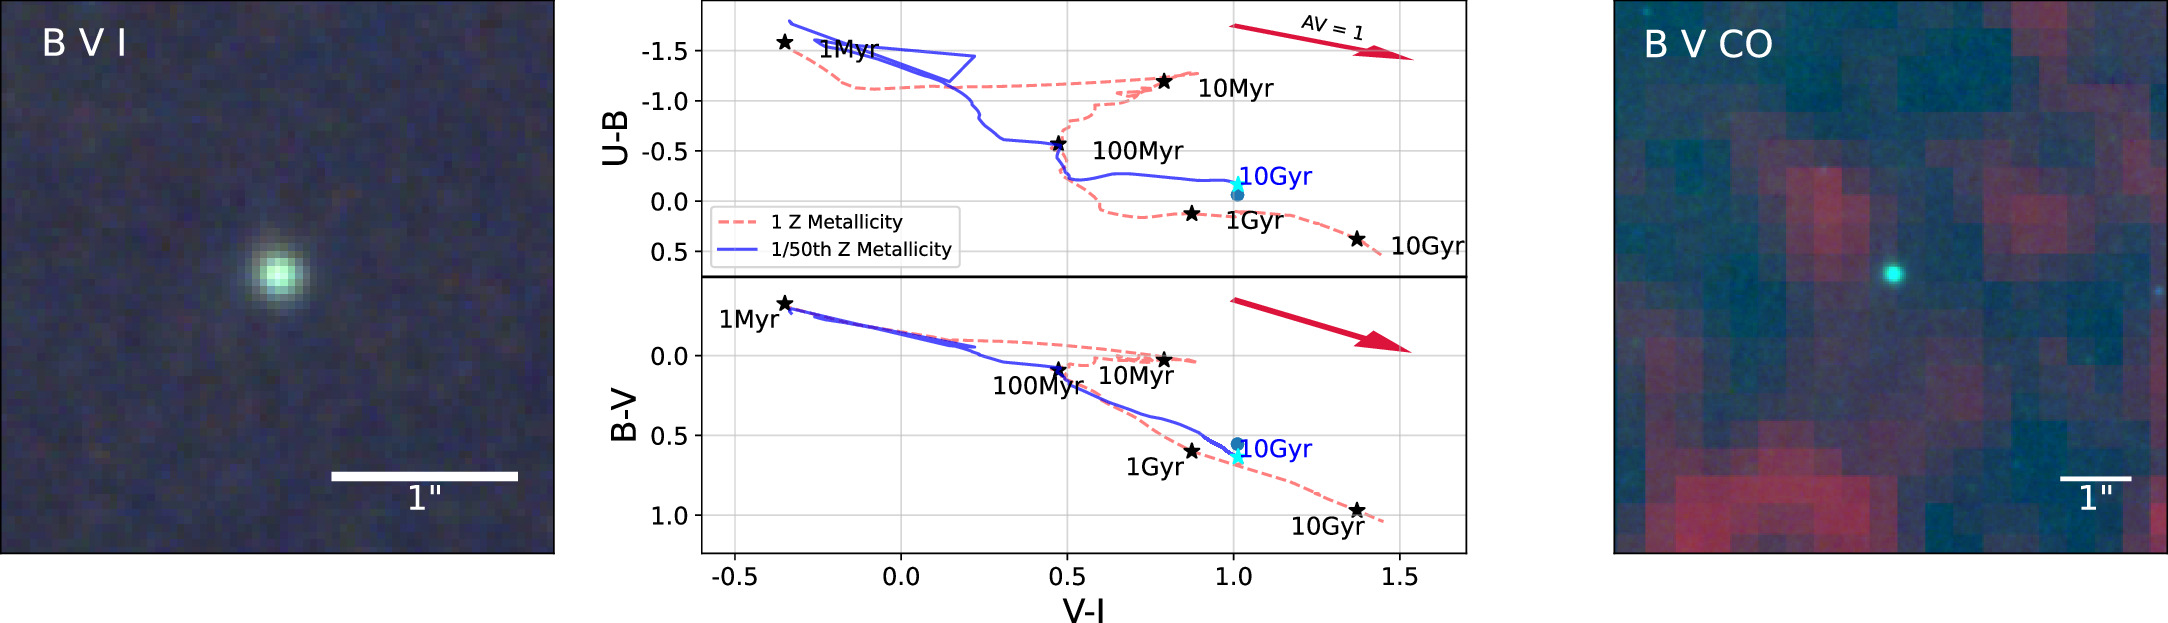
Figure 3. Diagnostic plots for an ancient GC. The source appears symmetric, round, and has a uniform color in a BVI image (left). The right panel, a B − V – CO image, shows there is no CO emission associated with the cluster. In the color–color diagrams shown in the center panel, the cluster (blue circle) lies close to predictions from the 1/50 × solar metallicity single stellar population (SSP) model. Black star symbols mark ages of 1 Myr, 10 Myr, 100 Myr, 1 Gyr, and 10 Gyr on the solar metallicity track. A cyan star marks the predicted position for 10 Gyr in the 1/50 solar model.
Download figure:
Standard image High-resolution imageIn general, since GCs are old and have red broadband colors, they can be quite faint in the bluer filters. Therefore, we expect them to have higher photometric uncertainties in the NUV and U bands than in B, V, and I. While we use the U band as a check in cases where the candidate is sufficiently bright, we do not eliminate clusters based on their U − B color alone. The key takeaways from our inspection of this object are its soft, spherical appearance and that it is not associated with any ISM. These clues lead us to conclude with high confidence that this is a bona fide ancient GC.
3.2.2. Example 2: A Reddened Young Cluster
In Figure 4 we present diagnostic plots for a reddened young cluster, the type of source expected to be the largest source of contamination in our candidate GC catalogs. Whereas their broadband colors can be similar to GCs, they tend to be in crowded star-forming regions and have associated Hα and/or CO emission. The left panel (BVI three-color image) shows the source has a nonuniform color, and is not completely symmetric. In the right panel we see that it is surrounded by a bubble of Hα emission, a clear indication it is a very young object. While this object's colors are similar to those of a GC in B − V and V − I, its U − B color is somewhat bluer than predicted for ancient clusters. A reddening vector equivalent to AV = 1 mag in each color–color plot shows that the cluster could potentially intersect the evolutionary models at different ages, depending on the amount of reddening. The Hα emission associated with this particular candidate leads us to conclude, with high confidence, that this is a reddened young cluster and not a GC. Even without Hα emission, one can see the source is experiencing differential reddening (left panel), since the bottom edge is visibly less red than the majority of the source.
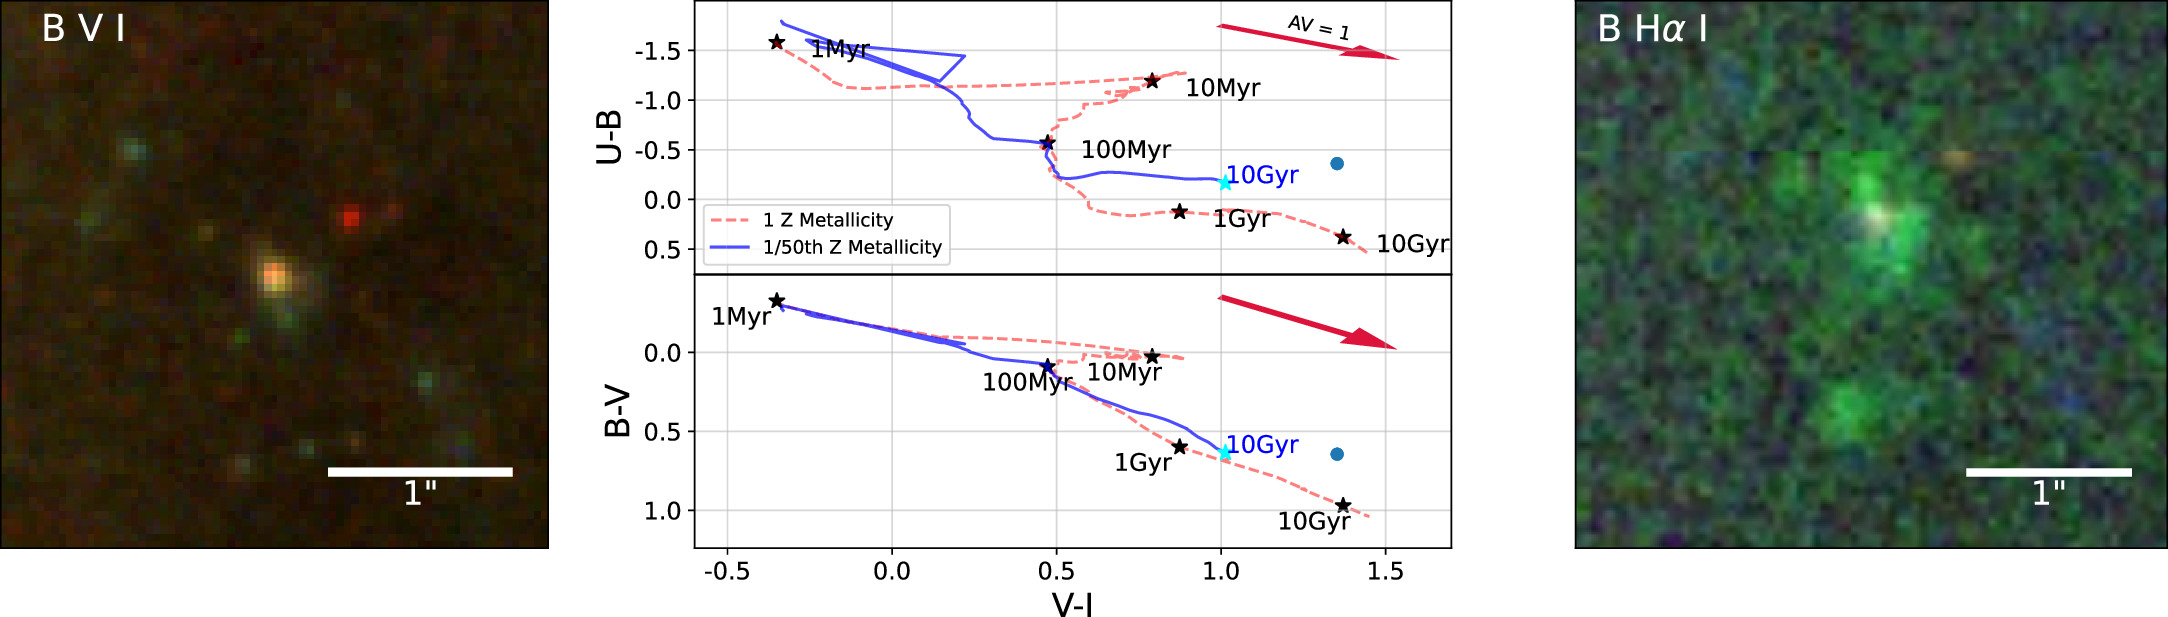
Figure 4. Diagnostic plots for a reddened young cluster. In the middle panels the source occupies a similar region in color–color space as a GC, but it is in a somewhat crowded region, appears lumpy, and has a nonuniform color in the BVI image (left). In the right panel (B − Hα − I) there is a partial bubble of Hα emission encircling the cluster. These are strong indications that the source is young and reddened rather than ancient. The color–color diagrams are in the same format as Figure 3.
Download figure:
Standard image High-resolution image3.2.3. Example 3: Background Galaxies and Foreground Stars
Background galaxies make up a small percentage of the contaminants in the initial selection of 3567 GC candidates, and are almost exclusively found in the ML-based catalogs. While GCs and background galaxies both have extended profiles, galaxies often have faint additional features such as spiral arms, disks, or extended halos, which are fairly easy to identify for humans but can be challenging for the ML algorithm. The left and center panel of Figure 5 shows three examples of background galaxies which made it into the ML-selected catalogs. The galaxy in the left panel shows clear spiral structure while the two in the center panel are identifiable by their ellipticity and extremely red colors, V − I ≥ 2.1. These and other similar objects are all removed from our GC final sample.
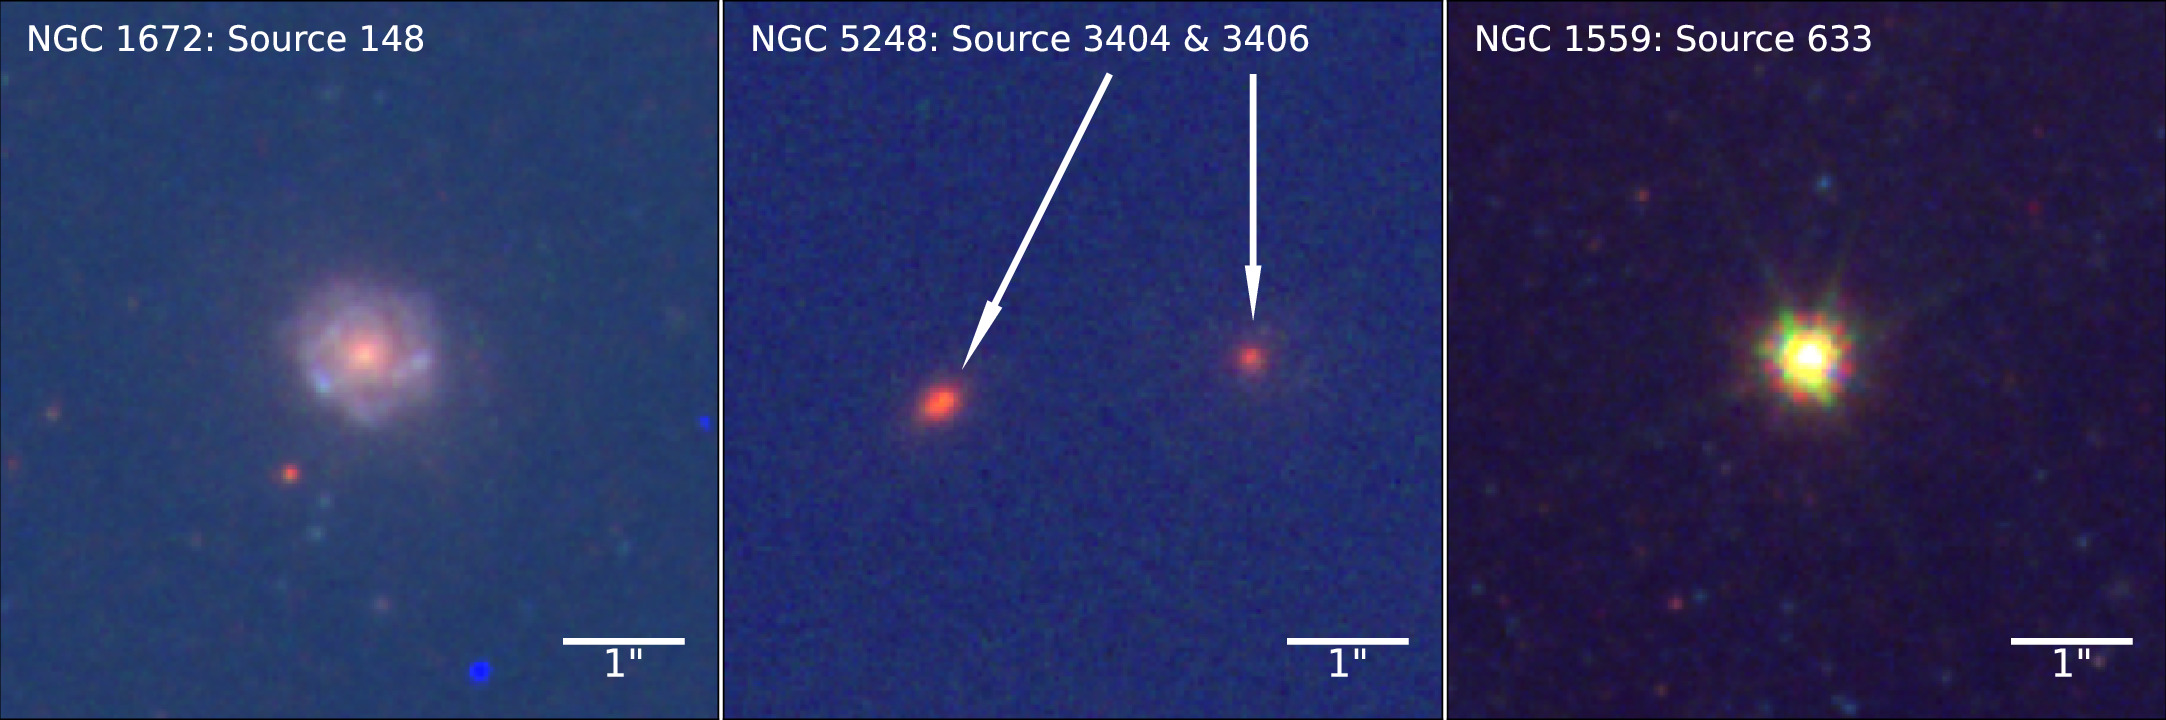
Figure 5. Color BVI images showing examples of contaminants from our initial color selection of GC candidates. The left image shows a background galaxy that was included in the ML catalogs. The center panel shows two background galaxies also from the ML-selected catalogs, while the right panel shows a saturated foreground star from the human-classified catalog. All contaminants are removed from the final GC catalogs.
Download figure:
Standard image High-resolution imageForeground stars are rare in our initial candidate GC list since most were eliminated by the MCI cuts. The right panel of Figure 5 shows an example of a foreground star with (weak) diffraction spikes which made it through the human classification. This can happen occasionally since bright foreground stars are not necessarily saturated in every filter and can therefore slip through the initial candidate selection. These objects are also removed from our final GC catalogs.
4. Final GC Catalogs
4.1. Human-classified Catalogs
The results of our visual inspection of the initial color-selected GC candidate lists are compiled in Table 2, and shown visually in Figure 6. We include the initial number of color-selected GC candidates (column 2), how many are visually verified as likely GCs (column 3), and the percentage verified (columns 4). The magnitude limit of the human-classified catalogs are listed in column 9 for each galaxy. The initial color selection yielded between 20 and 120 candidate GCs per galaxy, with most having 50 or more. The percentage of these that are confirmed by our rigorous visual inspection to be likely GCs ranges from ∼60% to 96%. Out of 1262 GC candidates, we visually confirmed that 988 appear to be likely GCs (78%).
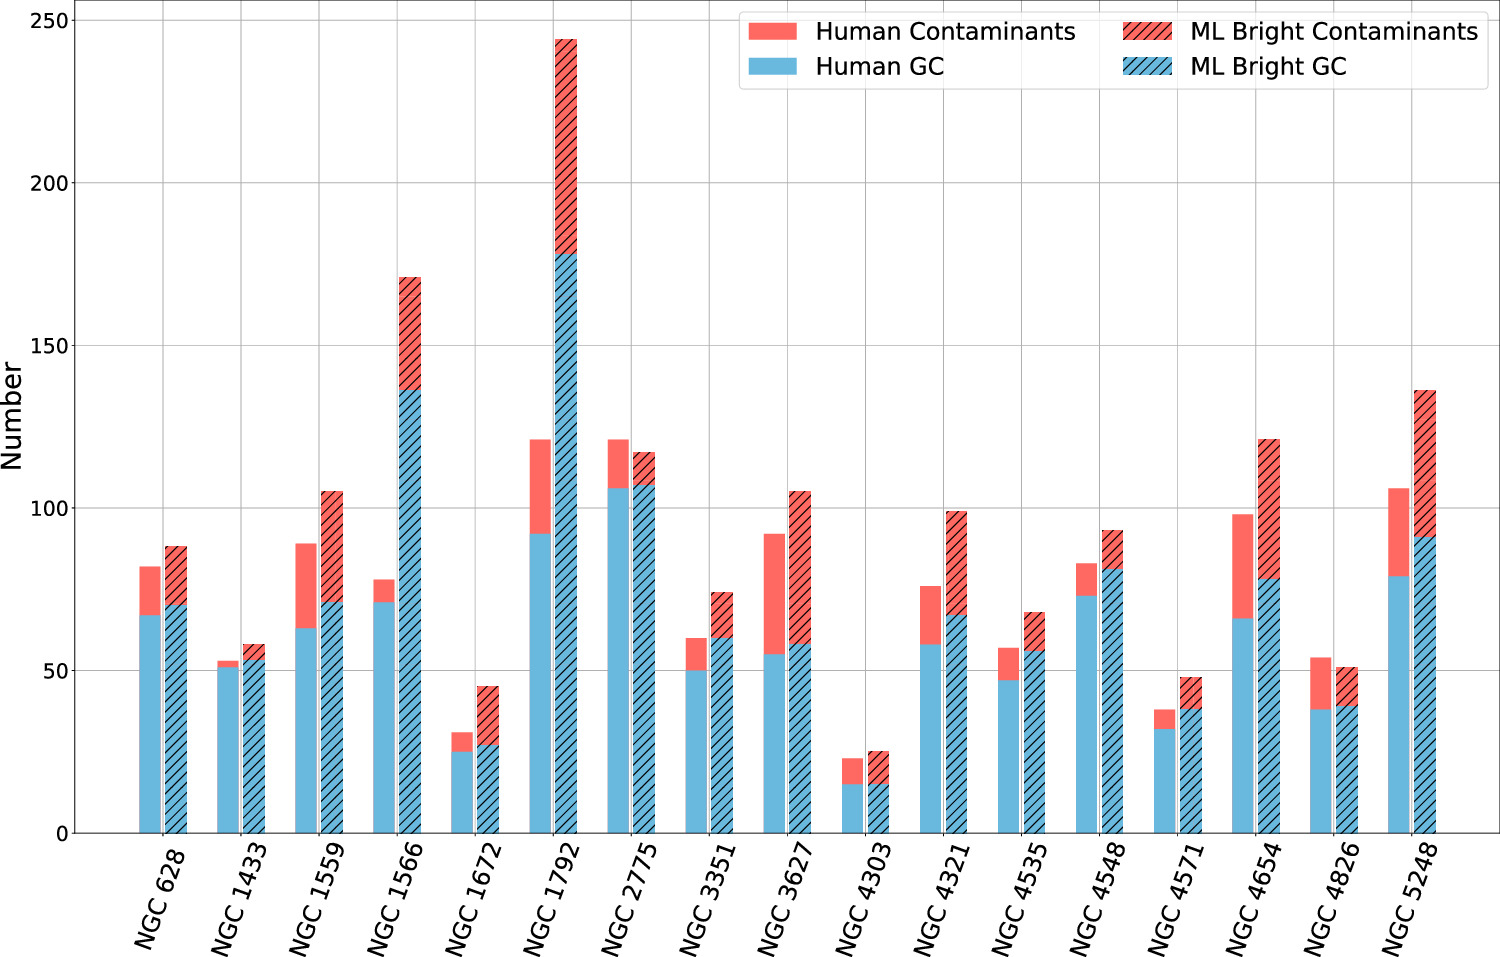
Figure 6. Total number of color-selected GC candidates from the human-classified catalogs (left bar) and the "bright" (same magnitude range) ML-classified catalogs (right bar). Each bar is broken into likely GCs (blue) and contaminants (red).
Download figure:
Standard image High-resolution imageTable 2. Statistics of the Bright Globular Cluster Candidates
| Galaxy | Cand. | Conf. | % Conf. | Cand. | Conf. | % Conf. | Total | Mag. Lim. |
|---|---|---|---|---|---|---|---|---|
| H GCs | H GCs | ML GCs | ML GCs | GCs | mV | |||
| (1) | (2) | (3) | (4) | (5) | (6) | (7) | (8) | (9) |
| NGC 628 | 82 | 67 | 81.7% | 88 | 70 | 83.8% | 70 | 23.0 |
| NGC 1433 | 53 | 51 | 96.2% | 58 | 53 | 96.3% | 54 | 24.1 |
| NGC 1559 | 89 | 63 | 70.8% | 105 | 71 | 74.2% | 73 | 23.5 |
| NGC 1566 | 78 | 71 | 91.0% | 171 | 136 | 80.8% | 139 | 24.3 |
| NGC 1672 | 31 | 25 | 80.7% | 45 | 27 | 71.4% | 27 | 23.0 |
| NGC 1792 | 121 | 92 | 76.0% | 244 | 178 | 75.6% | 181 | 24.0 |
| NGC 2775 | 121 | 106 | 87.6% | 117 | 107 | 91.6% | 115 | 24.5 |
| NGC 3351 | 60 | 50 | 83.3% | 74 | 60 | 86.9% | 62 | 24.0 |
| NGC 3627 | 92 | 55 | 59.8% | 105 | 58 | 59.4% | 61 | 22.5 |
| NGC 4303 | 23 | 15 | 65.2% | 25 | 15 | 71.4% | 15 | 22.5 |
| NGC 4321 | 76 | 58 | 76.3% | 99 | 67 | 71.9% | 66 | 23.5 |
| NGC 4535 | 57 | 47 | 82.5% | 68 | 56 | 83.3% | 56 | 24.0 |
| NGC 4548 | 83 | 73 | 88.0% | 93 | 81 | 87.5% | 85 | 24.5 |
| NGC 4571 | 38 | 32 | 84.2% | 48 | 38 | 83.3% | 41 | 24.5 |
| NGC 4654 | 98 | 66 | 67.4% | 121 | 78 | 66.9% | 80 | 24.0 |
| NGC 4826 | 54 | 38 | 70.4% | 51 | 38 | 80.0% | 42 | 23.5 |
| NGC 5248 | 106 | 79 | 74.5% | 136 | 91 | 68.6% | 94 | 24.0 |
| Total/Mean % | 1262 | 988 | 78.3% | 1648 | 1225 | 74.3% | 1261 | |
Note. Column 2 shows the number of color-selected GC candidates from the human (H) catalogs. Columns 3 and 4 give the number and percentage of these that are visually verified or confirmed to be likely GCs. Columns 5, 6, and 7 give the analogous information for the ML-based catalogs. Column 9 shows the limiting magnitude for each galaxy.
Download table as: ASCIITypeset image
Figure 7 shows a representative sample of GCs from our final catalogs: the top two rows show examples of blue (presumably metal poor) GCs and the bottom two show red (presumably metal rich) GCs. We have included examples from grand design and from flocculent spirals. They all have a similar appearance: round, singly peaked, and fairly isolated with very little nearby ISM.

Figure 7. This figure shows BVI 2'' × 2'' postage stamp images for 16 representative GCs from the human catalog. The clusters are all spherical and centrally concentrated, but show a range of colors. Most are isolated with the exception of cluster 3529 in NGC 3351, which is found in the bulge.
Download figure:
Standard image High-resolution imageOverall, we find that a simple color selection successfully identifies likely GCs at the ≈75%–80% level from the full PHANGS-HST human-classified cluster catalogs, with no additional selection criteria.
4.2. Machine-learning–classified Catalogs
We assess two subsets of ML-classified GC candidates: brighter and fainter than the limiting magnitude listed in column 9 of Table 2. The number of GC candidates initially selected per galaxy was ∼50–240, with ∼60%–96% confirmed. The subset of "bright" cluster candidates consists of 1648 sources. We confirm 1225 of these from visual inspection, an overall success rate of 74.3%. The statistics of the color-selected "bright" sources and the subset of likely GC candidates as well as the percentage of confirmed GCs in each galaxy are compiled in columns 5–7 of Table 2, and shown in Figure 6.
The number of confirmed GCs from our simple color selection from the human and ML samples are within ≈10% of one another for the individual galaxies, with nearly all the same GC candidates found in the human- and ML-based samples. The only notable outliers are NGC 1566 and NGC 1792, where the ML-based catalogs provide roughly double the number of likely GC candidates than the human-based ones. The bright subsample of the ML-classified catalogs only yields a 4% difference in the average confirmed GCs when compared with the human-selected catalogs down to the same magnitude limit.
In Table 3 we compile the results of our visual classification of "faint" GC candidates from the ML catalogs. These have the magnitude range given in column 5. The "faint" subsample has a total of 1810 color-selected candidates, of which 1444 are confirmed as likely GCs. This gives an overall success rate of 79.8%, very similar to that for the brighter human- and ML-selected GC candidates.
Table 3. Statistics of the Faint Globular Cluster Candidates from the ML Catalogs
| Galaxy | # Candidate | # GCs | % GCs | Mag. Range |
|---|---|---|---|---|
| GCs | mV (mag) | |||
| (1) | (2) | (3) | (4) | (5) |
| NGC 628 | 225 | 166 | 70.5% | 23.0–24.9 |
| NGC 1433 | 46 | 40 | 85.4% | 24.1–25.0 |
| NGC 1559 | 120 | 100 | 80.0% | 23.5–25.1 |
| NGC 1566 | 42 | 37 | 82.0% | 24.3–24.9 |
| NGC 1672 | 339 | 266 | 75.4% | 23.0–25.8 |
| NGC 1792 | 15 | 15 | 95.8% | 24.0–24.3 |
| NGC 2775 | ⋯ | ⋯ | ⋯ | ⋯ |
| NGC 3351 | 50 | 43 | 81.5% | 24.0–25.3 |
| NGC 3627 | 564 | 460 | 78.3% | 22.5–24.7 |
| NGC 4303 | 131 | 79 | 60.0% | 22.5–24.4 |
| NGC 4321 | 201 | 172 | 77.7% | 23.5–24.8 |
| NGC 4535 | 17 | 16 | 91.7% | 24.0–24.3 |
| NGC 4548 | 1 | 1 | 100% | ⋯ |
| NGC 4571 | ⋯ | ⋯ | ⋯ | ⋯ |
| NGC 4654 | 12 | 11 | 90.0% | 24.0–24.3 |
| NGC 4826 | ⋯ | ⋯ | ⋯ | ⋯ |
| NGC 5248 | 47 | 38 | 78.3% | 24.0–24.7 |
| Total/Mean % | 1810 | 1444 | 79.8% | |
Note. From the ML catalogs, we compile the total number of color-selected GCs (column 2), and the number and percentage confirmed through our visual inspection (columns 3 and 4) in the magnitude range given in column 5.
Download table as: ASCIITypeset image
The final GC catalogs created in this work can be found at 10.17909/jray-9798.
4.3. Overall Statistics
We started with 3567 color-selected GC candidates, with 1262 from the human-selected catalogs and 2305 from the ML-selected ones. From our careful visual inspection, we confirm that 2705 out of 3567 are quite likely to be GCs, with 988/1262 (78%) from the human-based catalogs and 1717/2305 (75%) from the ML-based catalogs. Table 4 lists the final numbers of initial candidates and confirmed GCs in each galaxy. Results for individual galaxies are displayed in Figure 8.
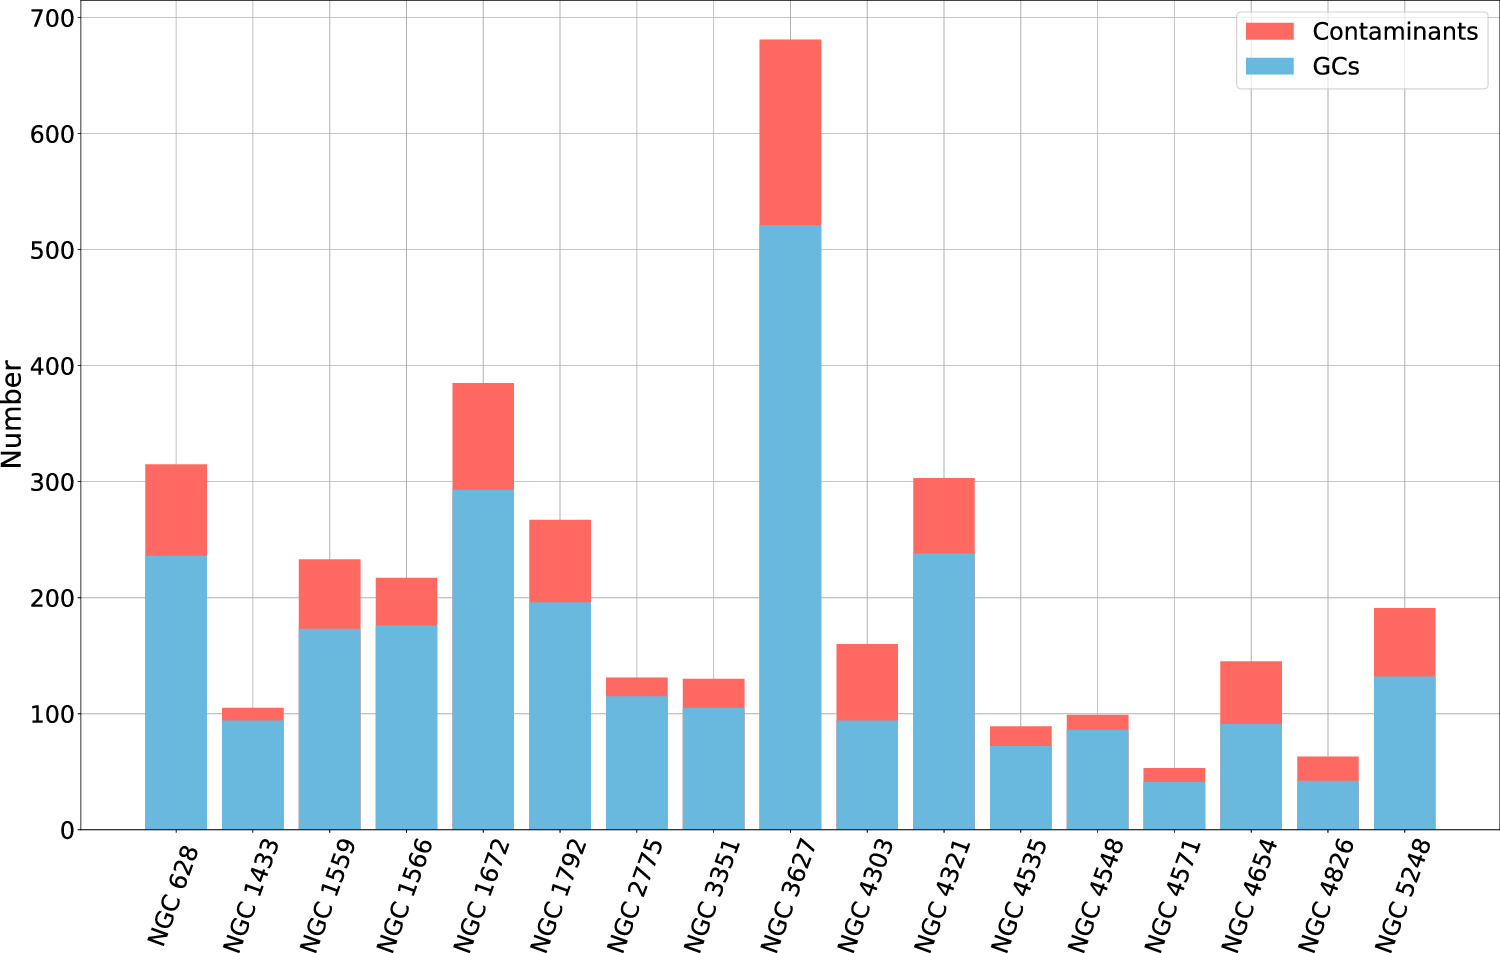
Figure 8. The total number of color-selected candidate GCs are shown for each galaxy in the sample. The contaminants are shown in red and likely GCs in blue. NGC 3627 is an outlier due to the large number of faint candidates selected by the ML algorithm.
Download figure:
Standard image High-resolution imageTable 4. Total Number of Globular Clusters
| Galaxy | GC Candidates (Bright + Faint) | Final GCs | Mag. Limit (mV ) |
|---|---|---|---|
| (1) | (2) | (3) | (4) |
| NGC 628 | 315(90 + 225) | 236 (70 + 166) | 24.9 |
| NGC 1433 | 105(59 + 46) | 94 (54 + 40) | 25.0 |
| NGC 1559 | 233(113 + 120) | 173 (73 + 100) | 25.1 |
| NGC 1566 | 217(175 + 42) | 176 (139 + 37) | 24.9 |
| NGC 1672 | 385(46 + 339) | 293 (27 + 266) | 25.8 |
| NGC 1792 | 267(252 + 15) | 196 (181 + 15) | 24.3 |
| NGC 2775 | 131(131 + 0) | 115 (115 + 0) | 24.5 |
| NGC 3351 | 130(80 + 50) | 105 (62 + 43) | 25.3 |
| NGC 3627 | 681(117 + 564) | 521 (61 + 460) | 24.7 |
| NGC 4303 | 160(29 + 131) | 94 (15 + 79) | 24.4 |
| NGC 4321 | 303(102 + 201) | 238 (66 + 172) | 24.8 |
| NGC 4535 | 89(72 + 17) | 72 (56 + 16) | 24.3 |
| NGC 4548 | 99(98 + 1) | 86 (85 + 1) | 24.5 |
| NGC 4571 | 53(53 + 0) | 41 (41 + 0) | 24.5 |
| NGC 4654 | 145(133 + 12) | 91 (80 + 11) | 24.3 |
| NGC 4826 | 63(63 + 0) | 42 (42 + 0) | 23.5 |
| NGC 5248 | 191(144 + 47) | 132 (94 + 38) | 24.7 |
| Total | 3567 | 2705 | |
Download table as: ASCIITypeset image
The differences between objects classified as Class 1 versus Class 2 is notable here. GCs are dynamically relaxed systems, and therefore expected to be spherically symmetric, i.e., Class 1. We find that for Class 1, 1332 out of 1547 initial candidates are classified as likely GCs (a success rate of 86%), whereas for Class 2, we find 1373 out of 2020 initial candidates are likely GCs (a 68% success rate). The human-classified Class 2 catalogs have a lower success rate (56%) for likely GCs when compared with the ML catalogs (71%). While the success rate of finding likely GCs based on a simple color selection is quite high for Class 1 objects, Class 2 sources contribute a significant fraction of likely GCs as well, and our catalogs would be significantly less complete without them. We conclude that for constructing GC catalogs, it is best to include both Class 1 and 2 sources.
4.4. Checks and Limitations
Of the 3567 initial, color-selected GC candidates, we found above that 2705 are retained in our final GC catalogs. This means that 862 sources were eliminated through our visual inspection. Of these, we believe that 589 (212 human/377 ML) are good clusters but are just younger and reddened (with ages ≈ 1–400 Myr), while the remaining 273 (62 human/211 ML) are background galaxies or other artifacts. In the rest of this section, we estimate the level of contamination that may still be present in our final GC catalogs from reddened young clusters, background galaxies, foreground stars, and partially reddened intermediate-age sources.
We find that reddened young clusters are the dominant source of contamination in our color-selected GC candidate catalogs. Of the 862 contaminants that we have identified, 589 are younger clusters. Of these, 295 appear to be heavily reddened (median E(B − V) ≈ 0.7, up to 1.5 mag) young clusters (τ < 10 Myr), and 257 to be moderately reddened (median E(B − V) ≈ 0.5 mag), intermediate-age clusters (10 < τ < 400 Myr). The remaining 37 appear to be lower-mass clusters which have red colors due to stochastic sampling of the stellar IMF; we expect these clusters to be young with ages ≈10–20 Myr. Overall, reddened clusters account for ≈60% (589/862) of all sources removed during visual inspection, with the remaining 273 sources being noncluster contaminants.
Very young, reddened τ ≤ 6 Myr clusters can be identified by the presence of Hα emission associated with the cluster (see also D. A. Thilker et al. 2024, in preparation). Four galaxies in our sample (NGC 628, NGC 1433, NGC 1672, and NGC 3351) have archival HST Hα images available. We use these to estimate the number of reddened young clusters which may have been missed and remain in the final GC catalog for the other 13 galaxies.
To test this, we visually inspect the 216 human-selected GC candidates in the four galaxies which have HST Hα imaging, once making use of the Hα, and once without. Of the inspected candidates, we find four sources which appear to be reddened, young clusters that were incorrectly classified as a GC when the Hα images were not used. This gives an expected misclassification rate of ≈1.8% or ≈60 out of the 3351 remaining candidate GCs not included in this test.
Another type of contaminant we consider is partially reddened young or intermediate-age clusters. We identify 45 faint sources that appear to be only partially reddened by dust, where the cluster shows distinct red and blue colors. Because it is possible that this partial reddening has led clusters that are only ≃100 Myr to be misclassified as ancient GCs, we compared the U − B and V − I colors of the bluest 5 pixels of the candidates to the BC03 models. We identified and eliminated just one source that appears to be a partially reddened, intermediate-age cluster rather than an ancient GC.
We identify noncluster contaminants based on morphology and colors, particularly background galaxies. We find 129 background galaxies, which comprise 47.3% of all noncluster contaminants. We expect any remaining contamination from background galaxies to be negligible in the final catalogs, since these objects are visually distinct from clusters. As shown in Figure 5, background galaxies are redder than GCs in most cases, and often have visible structure. The exception to this is E0 galaxies, which can have a similar morphology to GCs but with an extended faint red halo.
Foreground stars are usually removed from the cluster catalogs based on their CI, but a few made it through the initial selection criteria because they are (barely) saturated and therefore appear broader than the PSF. Nearly all such cases have been eliminated from the human-classified catalogs, but a few made it through the ML-classified catalogs.
Besides misclassification, it is probable that we have missed some ancient GCs because they are in regions of high background (bulge or spiral arms), crowding, or dust obscuration. In particular, we expect our samples to become increasingly incomplete at fainter magnitudes and closer to the galactic center (we will discuss where we think incompleteness may impact the shape of the cluster luminosity function in Section 5.2).
After carefully examining thousands of candidate GCs selected from an initial color cut of B − V ≥ 0.5 and V − I ≥ 0.73 mag, we conclude that a number of remaining background galaxies can be eliminated by applying a cut at the red end. We found a number of background galaxies with V − I > 2.1 mag, but essentially no GCs with such colors, at least in the galaxies studied in this work. We check the impact of applying a color cut with the following criteria: (i) V – I ≤ 2.1 and (ii) B – V ≤ −0.217 × (V − I) + 1.85. These cuts removed 100 sources, of which 90 are background galaxies and 10 appear to be good GC candidates. If we had included these cuts in our initial selection, the confirmed percentages of GCs would only change by 1%–2% for most galaxies, but a number of contaminants could have been eliminated before visual inspection.
4.5. Comparison with the PHANGS-HST Pipeline Results
In Figure 9 we plot the age versus reddening (E(B − V)) from the PHANGS-HST pipeline for all color-selected GC candidates. The top panel contains the human-classified candidates, with sources we believe are likely to be GCs after our visual inspection shown in blue and contaminants in red. In the figure, good (old) GCs can be found at almost any PHANGS-HST pipeline age, due to challenges in breaking the age–reddening–metallicity degeneracy when only broadband colors are used in SED fitting (Whitmore et al. 2023), and not because they are actually young. If we assume that ages of 1 Gyr and older are reasonable for GCs when solar metallicity is assumed, only ∼25% of our likely GCs have a reasonable age. The default fitting procedure assumes solar metallicity and allows for reddening up to E(B − V) = 1.5 mag (Turner et al. 2021). Because many GCs in spirals are blue and metal poor, they have bluer colors than predicted by the solar metallicity models, and end up being best fit by a young (intermediate) age with high (moderate) reddening.
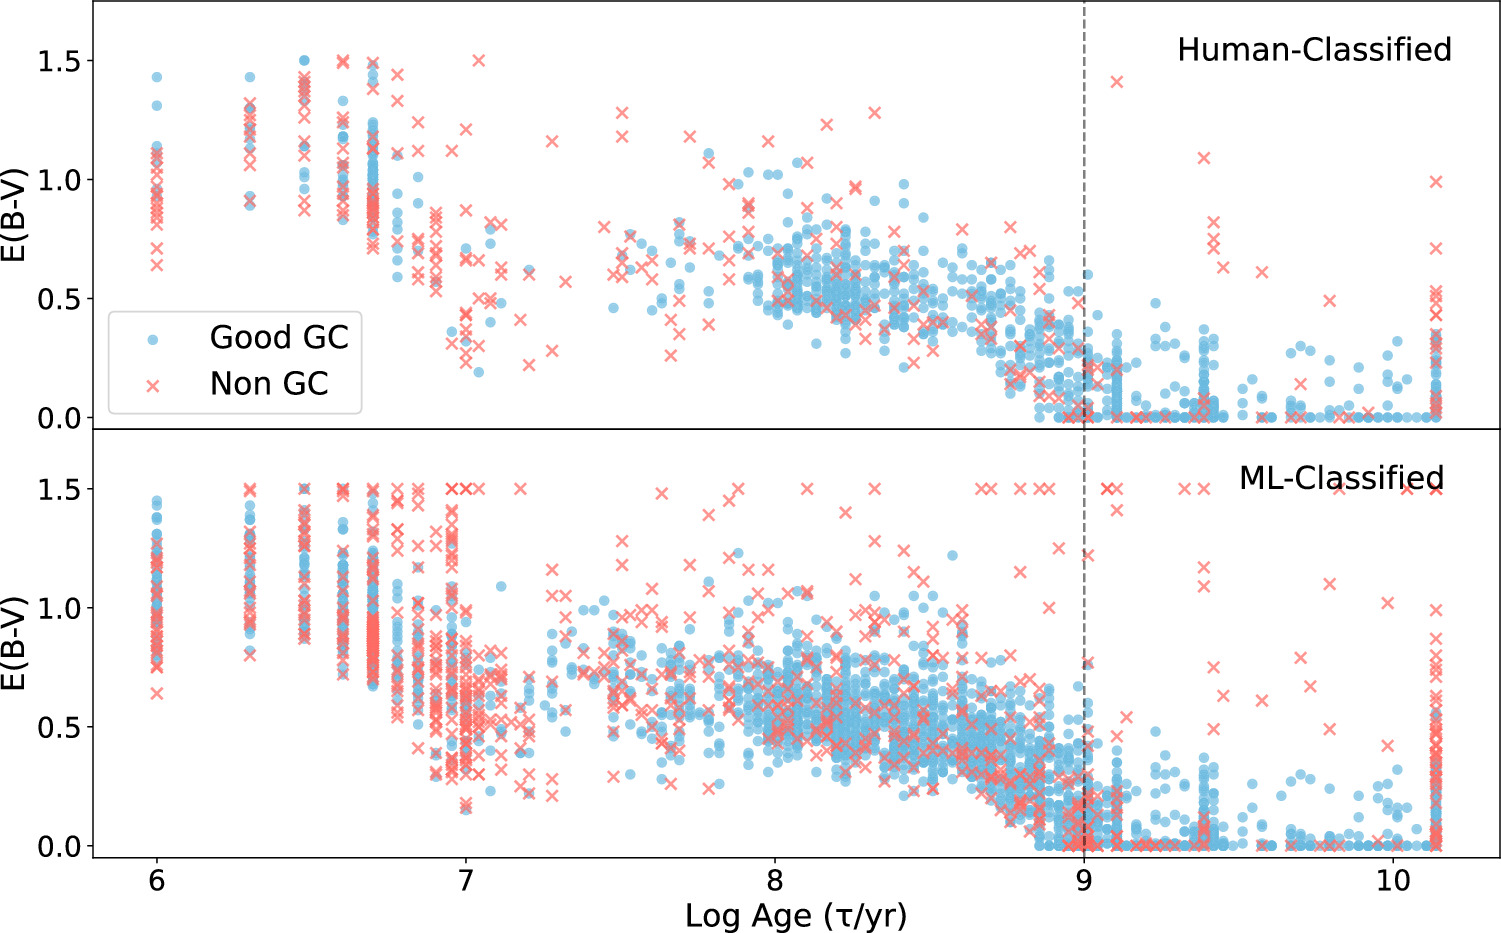
Figure 9. The best-fit age and reddening (E(B-V)) from the default PHANGS-HST pipeline for all color-selected GC candidates from the human-classified catalogs in the top panel and the ML-classified candidates in the bottom. Objects classified by us as likely GCs after visual inspection are shown in blue and contaminants are shown in red. We expect GCs to have estimated ages ≥ 1 Gyr (dashed line), but only ≈25% do. This illustrates the challenges of breaking the age–reddening–metallicity degeneracy using a single set of SSP model parameters, as discussed extensively in Whitmore et al. (2023) and D. A. Thilker et al. (2024, in preparation).
Download figure:
Standard image High-resolution imageWhitmore et al. (2023) introduced a method to determine the ages of ancient GCs in spiral galaxies. This method relies on selecting likely GCs based on their color in a region similar to the old cluster clump shown in Figure 2 here, and refitting for the age using a 1/50 × solar metallicity model with very low reddening of E(B – V) < 0.1 mag. Using this method, Whitmore et al. (2023) showed that most GCs were fit with ages ≥ 1 Gyr (see also D. A. Thilker et al. 2024, in preparation).
We compare sources in our final GC catalogs with 388 sources that were corrected for age using the method described above for six galaxies. We consider a "match" to be a source that we have classified as a likely GC that has a corrected age ≥ 1 Gyr. We also consider it a match if we classified a source as a reddened young cluster and the corrected age is less than 1 Gyr. We find that 324 of the 388 matched sources have ages consistent with our classifications, or a ∼83% match.
5. Discussion
5.1. Discovery of A Faint Population of Globular Clusters in NGC 3627 and NGC 628
The GCLF has been well studied in elliptical galaxies and has a universal shape with a peak near MV ≈ −7.4 mag and a Schechter-like downturn at the bright end. While the GCLF has not yet been well studied in spiral galaxies, it appears to have a similar shape and peak luminosity in the Milky Way (e.g., Jordán et al. 2007; Rejkuba 2012), M31 (Secker 1992; Reed et al. 1994), and M81 (Santiago-Cortés et al. 2010; Lomelí-Núñez et al. 2022). The peak and faint ends of the luminosity function are likely shaped by cluster disruption, since lower-mass (luminosity) clusters are preferentially disrupted due to the evaporation of stars caused by two-body relaxation on gigayear timescales (e.g., Fall & Zhang 2001). The GC candidates in the spiral galaxy M101 present an exception to this universal shape (Barmby et al. 2006; Simanton et al. 2015). M101 has an excess of faint, red clusters which have all the expected photometric and morphological properties of GCs, but which have a luminosity function that continues to increase (rather than turnover) in a power-law fashion down to at least one magnitude fainter than the expected peak, MV ≈ −6.4 mag.
Figure 10 shows V-band luminosity histograms for all the GC systems studied in this work. We use bins of equal width in magnitude in the range from −10 to −5.5 mag. The expected turnover at MV ≈ −7.4 mag is represented by the dashed black line in each panel. The upper left panel uses V-band magnitudes for Galactic GCs (Harris 1996, 2010), and the best-fit Gaussian model. The best fit gives a peak at MV = −7.30 ± 0.12 mag, and a standard deviation σ = 1.20 ± 0.08, which is in good agreement with the earlier fit results for the Milky Way GC system from Secker (1992), who found a peak of MV = −7.29 ± 13 mag and dispersion σ = 1.1 ± 0.1 mag.
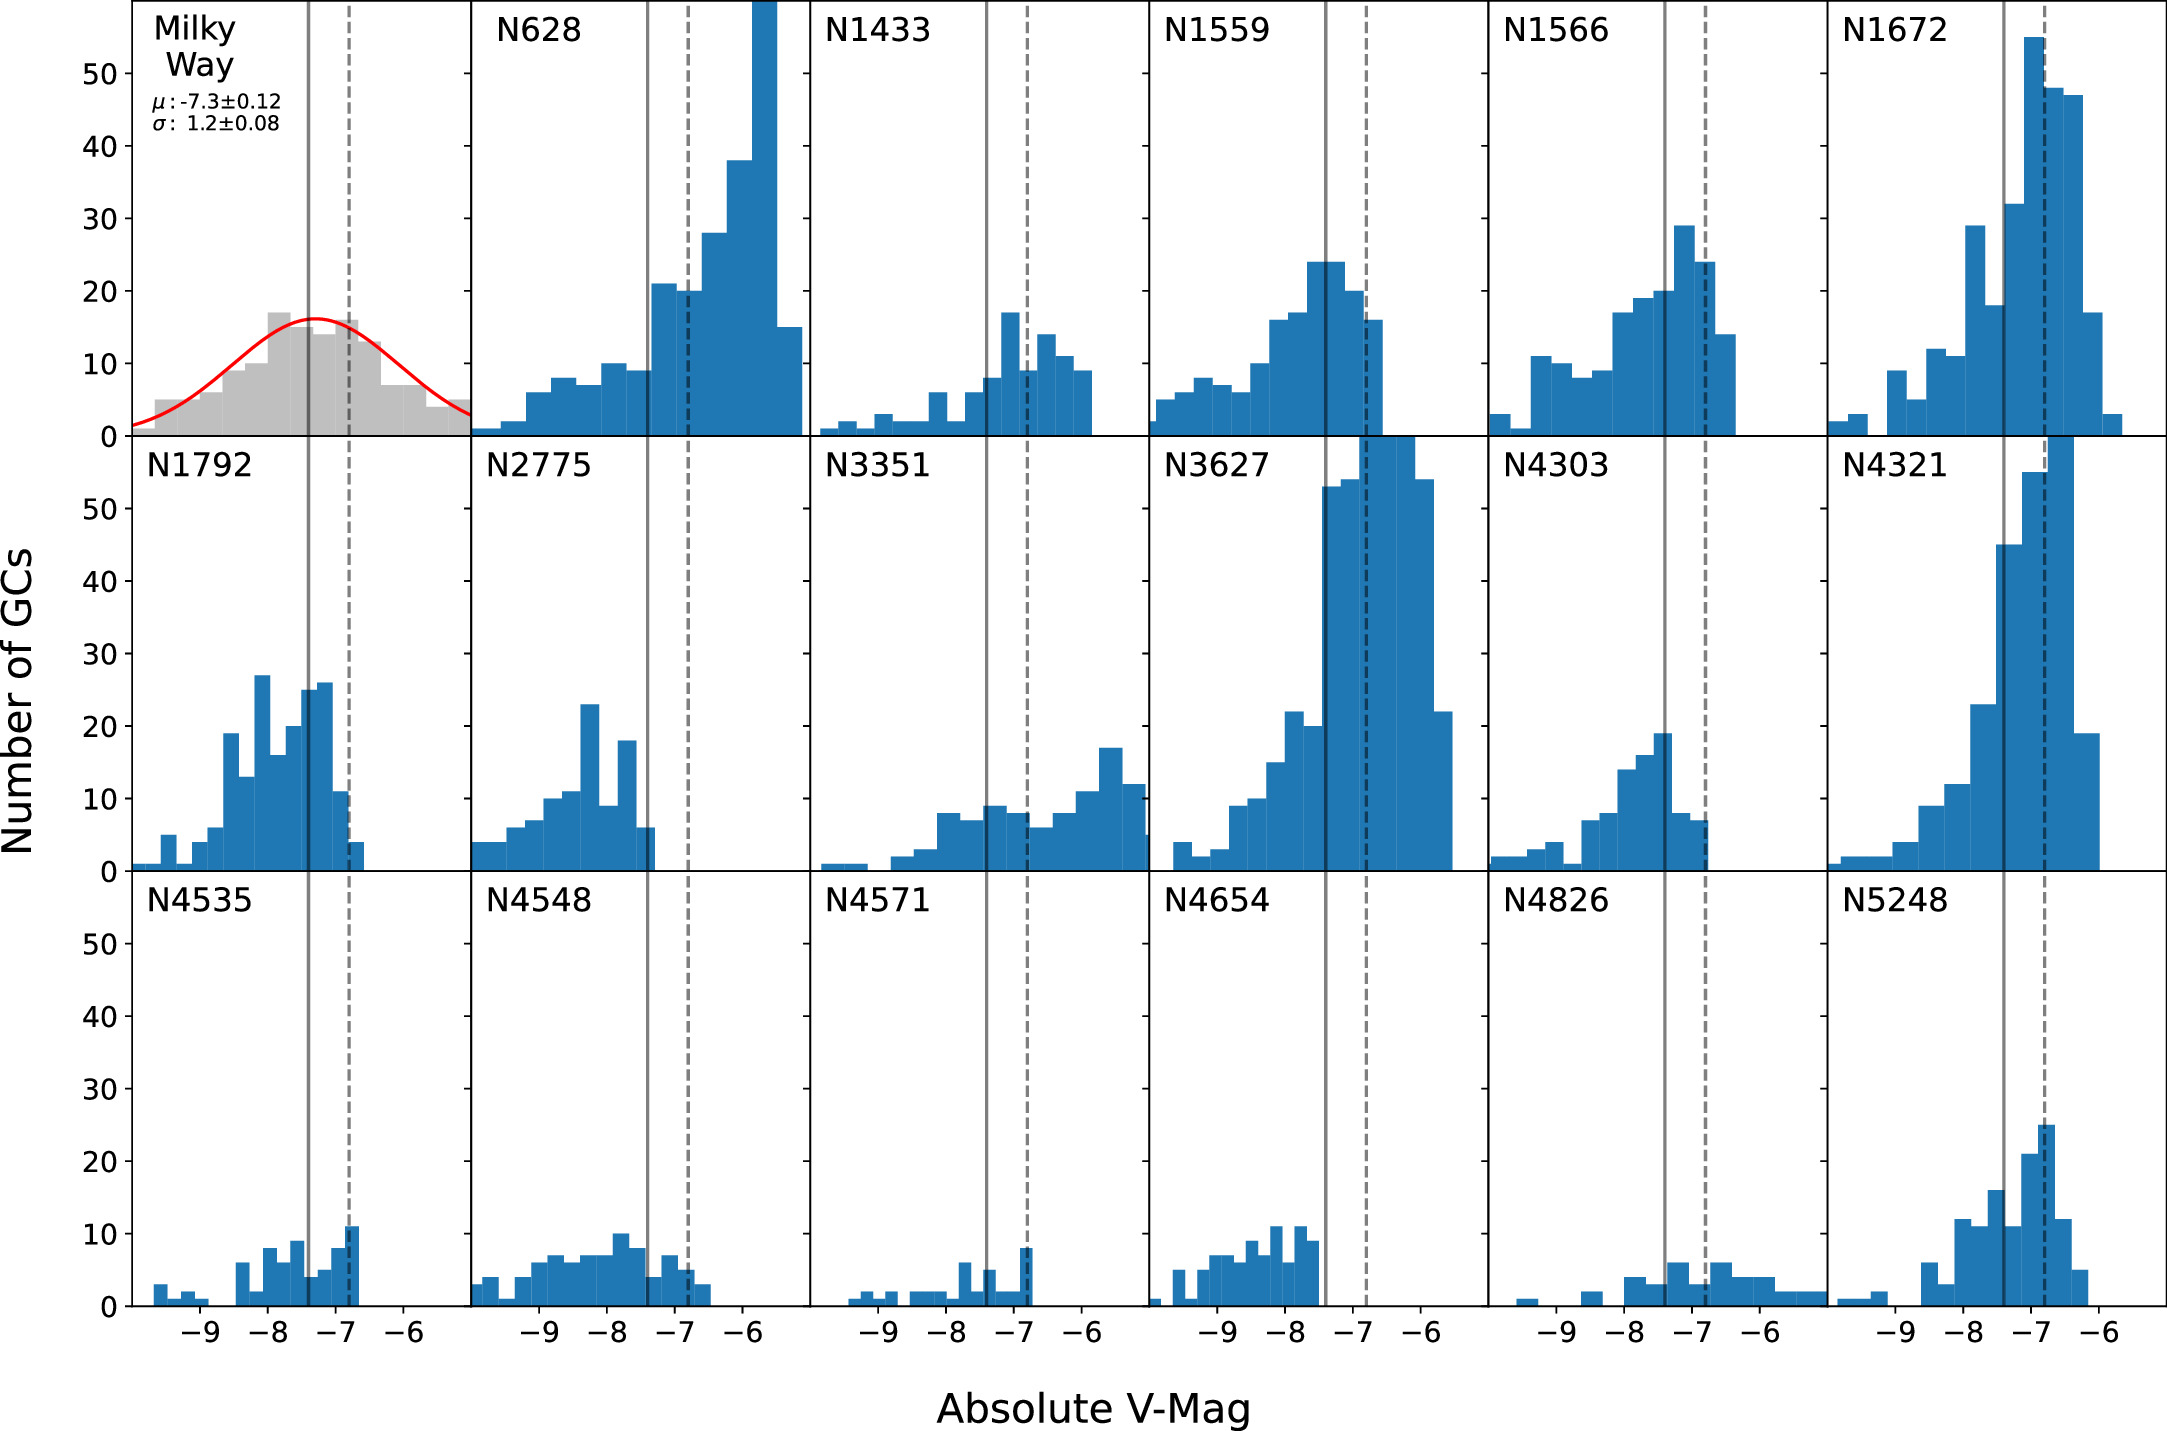
Figure 10. GCLFs are shown as absolute V-band magnitude histograms for each galaxy. The accepted universal turnover is marked with a solid vertical line at MV = −7.4 mag, while a dashed vertical line is used to mark the magnitude limit of MV = −6.8 that we adopt to divide between "faint" and "bright" cluster popluations. The top left panel shows the luminosity function of GCs in the Milky Way (Harris 1996, 2010). We fit a Gaussian to the luminosity function of GCs in the Milky Way, where the V-band magnitudes are taken from the most recent version of the Milky Way GC catalogs. The best fit, shown in red in the top left panel, has a peak near MV ≈ −7.30 ± 0.12 mag and a dispersion parameter σ = 1.20 ± 0.08 mag, very similar to the parameters found earlier by Secker (1992) for the Milky Way GCLF.
Download figure:
Standard image High-resolution imageThe luminosity functions have not been corrected for completeness, although by including the ML-classified catalogs the distributions go well below the expected turnover in the majority of cases. In 10 galaxies the catalogs extend ∼1 mag fainter than the expected turnover, and in five of these cases, they extend a full 1.5 mag beyond the expected turnover. There are seven galaxies where the cluster catalogs do not reach at least 1 mag below the expected turnover: NGC 1792, NGC 2775, NGC 4303, NGC 4535, NGC 4548, NGC 4571, and NGC 4654. These are some of the more distant galaxies in our sample, ranging from 15.8–23.15 Mpc. In addition, NGC 4826 has poor statistics, making it difficult to assess the shape of its luminosity function. We will not consider these eight galaxies further.
The shapes of the GCLFs in the nine galaxies which reach at least an MV of −6.4 fall into three categories: (1) we see a clear peak that is consistent with MV ≈ −7.4, (2) there may be a peak near the expected value, but the distribution is broad and the peak is indistinct, and (3) the number of clusters continue in power-law fashion well beyond the expected peak luminosity. We find two galaxies which fit into the first category: NGC 1559 and NGC 1566. Three galaxies fit into the second category: NGC 1433, NGC 3351, and NGC 5248, and four galaxies in the third category: NGC 628, NGC 1672, NGC 3627, NGC 4321.
Galaxies in the third category where the GCLF continues to increase to at least 1 mag below the expected turnover luminosity are of great interest. M101 is the only galaxy to date known to show this distribution of GC luminosities convincingly. Here, we find that NGC 628 and NGC 3627 also have large, convincing populations of faint (MV ≥ −6.8) GCs, with 219 and 350 of these sources, respectively.
5.2. What is the Nature of the Faint GCs?
In this section we focus on the large populations of faint GCs found in NGC 628 and NGC 3627 (MV ≥ −6.8).
We consider three possibilities for the nature of these faint cluster populations: (1) they are young, reddened clusters in the disk, (2) intermediate-age clusters (∼a few 100 Myr to several gigayears) with low to moderate reddening also in the disk, or (3) ancient (≥10 Gyr) clusters in either the halo or disk.
We believe that the first possibility, namely that these faint GC candidates are actually very young, reddened clusters, is quite unlikely, since none have associated Hα emission. In NGC 628, we find that only 10 of the 124 (8%) fainter than the magnitude limit of the human-selected catalogs even have Hα emission within ≈50 pc, and in these cases, the emission appears to be associated with another nearby object. The lack of nearby Hα emission for this population of faint red clusters indicates that they are unlikely to be very young, reddened clusters.
So, we focus on the remaining two possiblities by studying the spatial distribution of GCs, in order to discern where in the galaxy they likely reside. Figure 11 shows the locations of faint (red, MV ≥ −6.8 mag) and bright (blue, MV < −6.8 mag) GCs in NGC 628 and NGC 3627, while Figure 12 shows the radial density profiles of each population. The error bars show Poisson statistics.
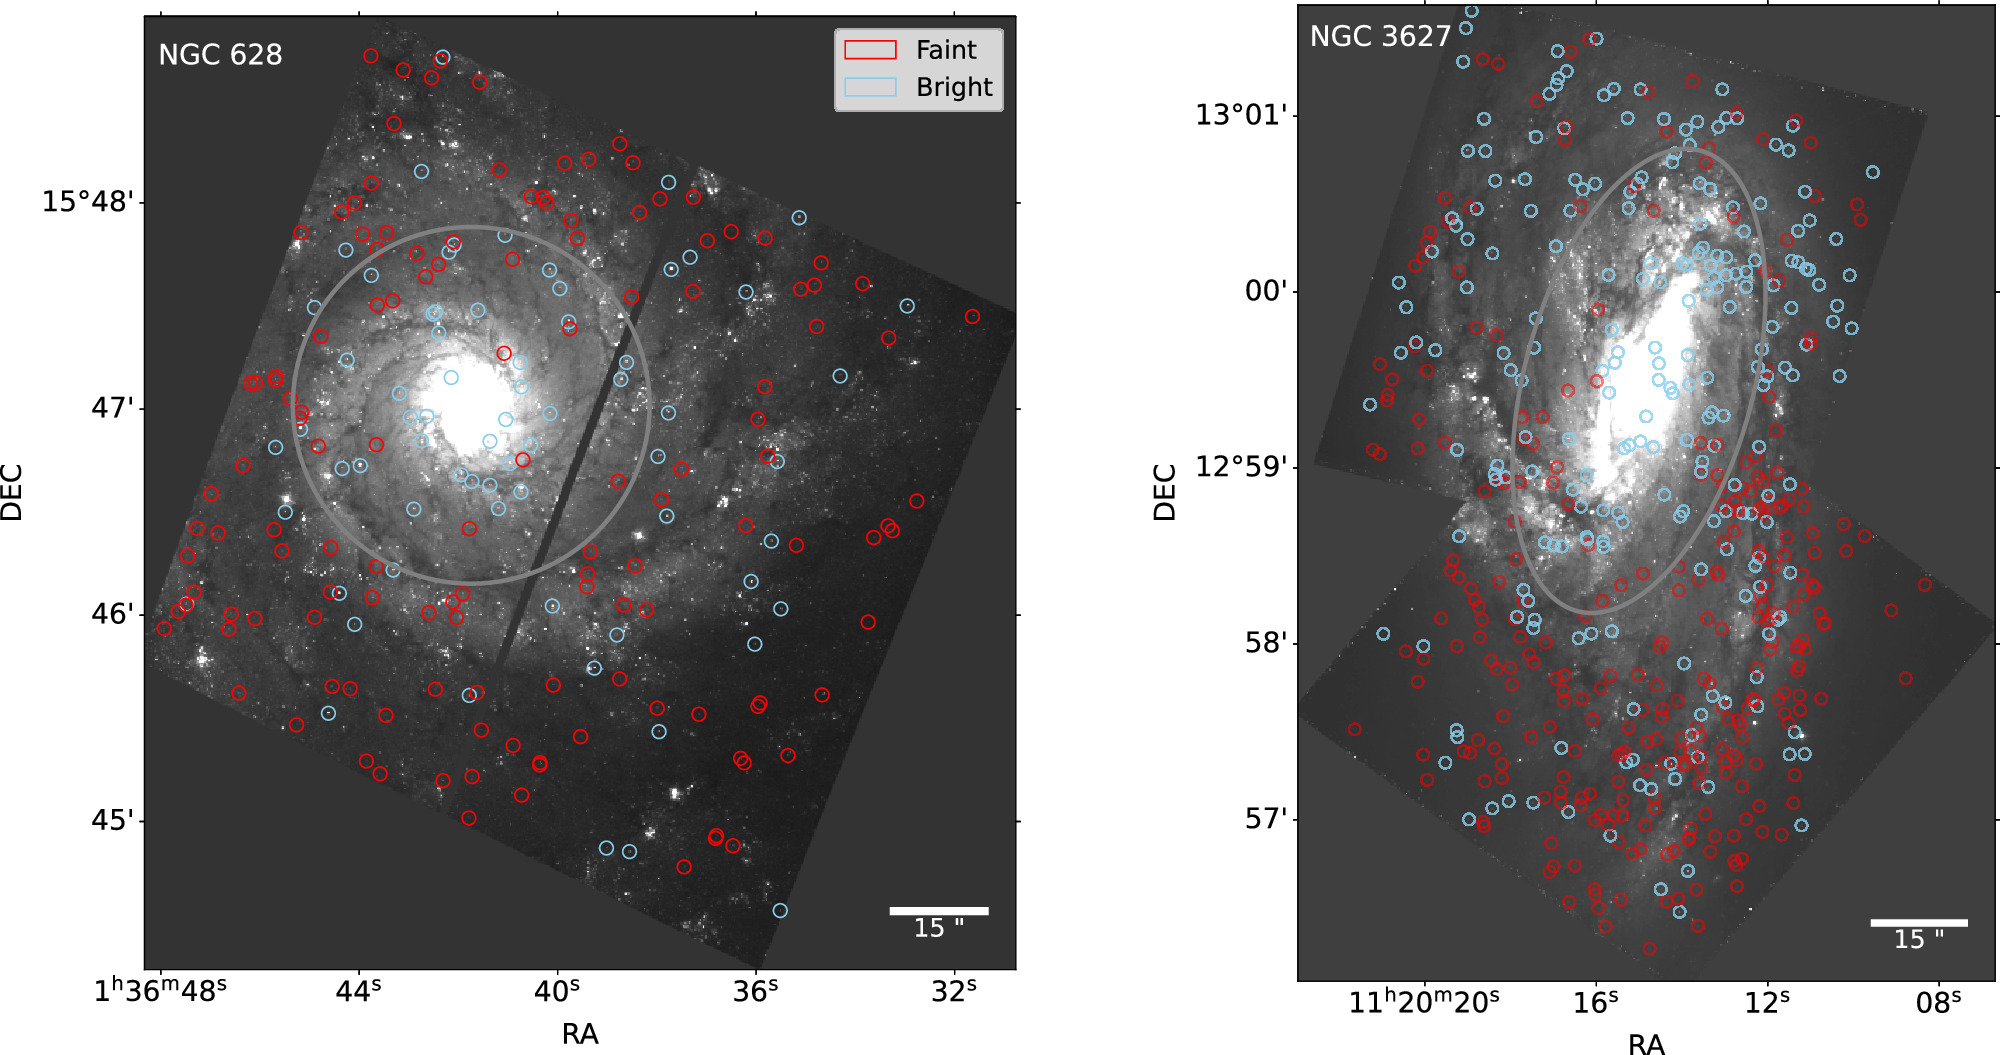
Figure 11. The locations of all likely GCs are overplotted on a V-band image of their host galaxy, NGC 628 (left) and NGC 3627 (right). The bright GCs (MV < −6.8) are indicated by blue circles and faint ones (MV > −6.8) are in red. The ellipses show the approximate distance where the radial density of the faint GC population peaks: 2.5 kpc for NGC 628 and 4.5 kpc for NGC 3627.
Download figure:
Standard image High-resolution image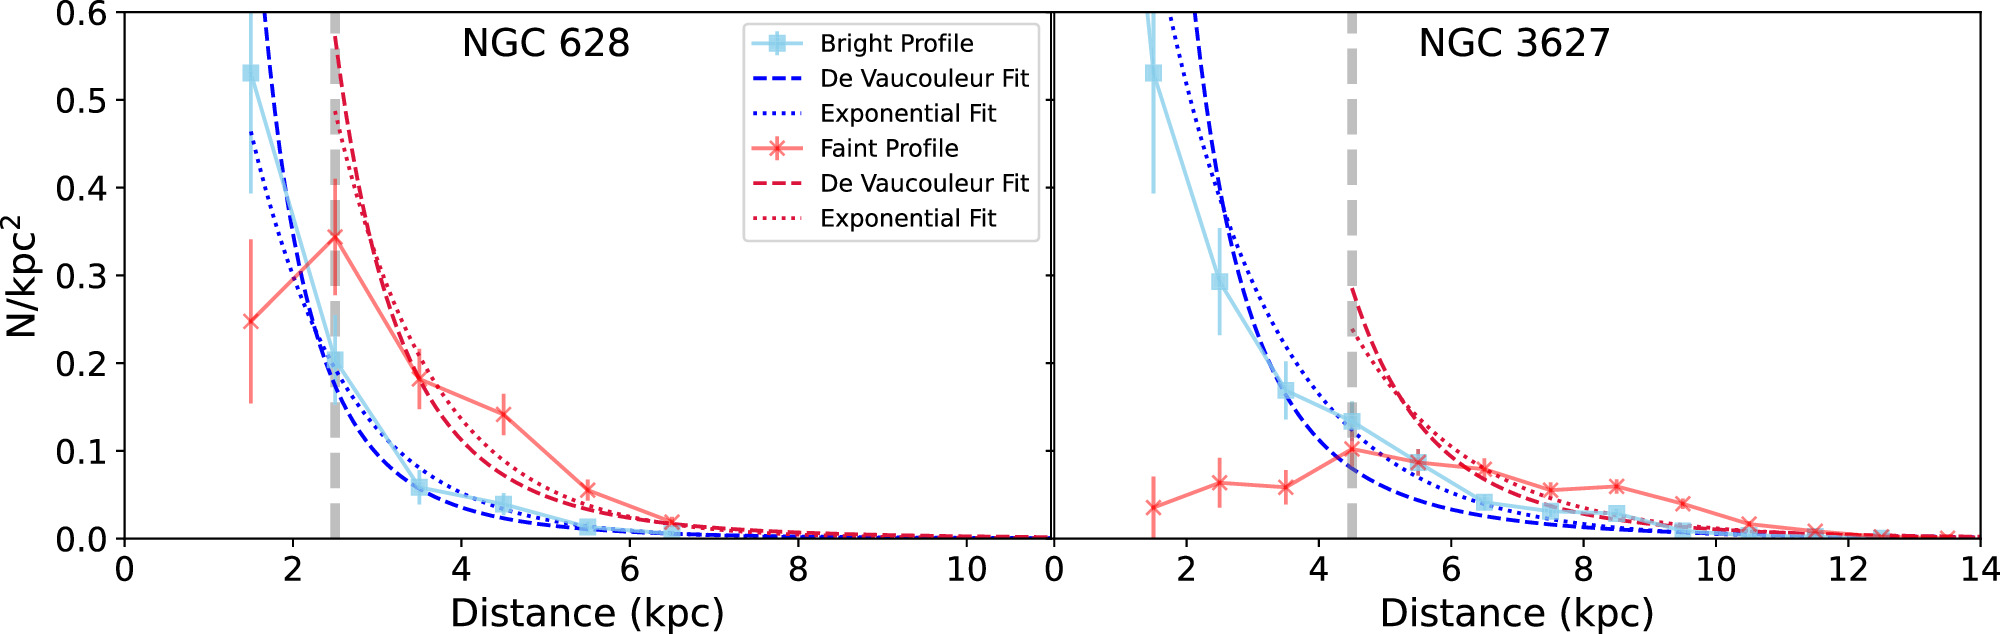
Figure 12. Radial density distributions of bright (blue) and faint (red) GCs (divided at MV = −6.8) are plotted using equal-size radial bins. The profiles for NGC 628 are on the left and for NGC 3627 on the right. Error bars are calculated as Poissonian statistics. The best-fit de Vaucouluer (dashed) and exponential (dotted) profiles to each distribution are shown.
Download figure:
Standard image High-resolution image
Higher background level in the bulge and central regions make it more difficult to identify faint GCs than bright ones. The dashed vertical lines in Figure 12 are placed at the galactocentric distance where the radial profiles of the faint GCs peak; this occurs at 2.5 kpc in NGC 628 and 4.5 kpc in NGC 3627. At closer distances, the profiles for the faint clusters decline, almost certainly due to incompleteness, while those for the bright ones continue to rise. At distances beyond the dashed lines in Figure 12, we see that the radial density profiles for the faint GCs are flatter and more extended than their bright counterparts. An exponential is typically used to describe spiral disks, and the de Vaucouleur profile is often used to describe a spheroidal population, like the central bulge (e.g., Baggett et al. 1998). Quantitatively, we fit the bright and faint distributions to both an exponential and a de Vaucouleur profile (De Vaucouleurs 1948). The exponential is fit of the form  and the de Vaucouler profile is fit of the form
  .
.
The fits are shown in Figure 12, as indicated by the legend. For the bright GC populations, there is little difference between the best de Vaucouleur and exponential fits (blue dashed and dotted lines, respectively), although the de Vaucouleur profile appears to better fit the innermost data point in NGC 628. Neither profile does a very good job of representing the faint GC populations (red curves). While it is not possible to draw firm conclusions, the faint GCs clearly have a broader, more extended distribution than the bright GCs. We speculate that the bright GCs are distributed in a spheroidal distribution, consistent with a galactic bulge + halo, while the faint populations may be associated with the disks of NGC 628 and NGC 3627.
6. Conclusions
In this work, we have created new catalogs of GCs in 17 spiral galaxies observed as part of the PHANGS-HST Treasury program. The galaxies have stellar masses between ≈1010 and 1011 M⊙, SFRs between 0.2 and 7.6 M⊙ yr−1, and include barred and unbarred Sa through Sd spirals. Only one of these galaxies (NGC 628) has a previously published catalog of GCs. Initial candidate lists were selected by applying color cuts of B – V ≥ 0.5 mag and V − I ≥ 0.73 mag to two distinct cluster catalogs, one based on morphological classifications made by coauthor B. Whitmore and the other by an ML algorithm (Wei et al. 2020; Hannon et al. 2023). The ML-based catalogs reach ≈0.5–2.0 mag fainter than the human ones, and the color selection is based on the intrinsic colors of GCs in the Milky Way.
Each color-selected candidate GC was subjected to a visual inspection which included morphology in the B, V, and I filters, an assessment of whether or not it is associated with Hα/CO emission or dust, and the local environment to determine if the source is a GC or a contaminant (e.g., reddened young or intermediate-age cluster, background galaxy, or foreground star). We expect GCs to be round (dynamically relaxed), not near regions of recent star formation, and uniform in color. Some key statistics related to the production of the GC catalogs are given below.
- 1.We found that 2705 out of 3567 color-selected candidates from the PHANGS-HST catalogs are likely GCs.
- 2.The percentage of confirmed GCs in the "bright" color-selected samples is similar in both the human- and ML-based cluster catalogs, ∼74.3%–78.3%.
- 3.There are a total of 1444 likely GCs identified in the ML catalogs that are fainter than the magnitude limits of the human-based catalogs.
- 4.These "faint" catalogs had an ≈79.8% confirmation rate, similar to that for the brighter samples.
For each GC, we present their position and photometry in five filters: F275W (≈NUV), F336W(≈U), F435W/F438W(≈B), F555W(≈V), and F814W(≈I), and their CI measured in 1 and 3 pixels. These are the largest and most homogeneously created catalogs of candidate GCs in spiral galaxies to date. The final catalogs created in this work can be found at 10.17909/jray-9798.
We studied the luminosity functions of the GC systems in the 17 spiral galaxies, and found that most are consistent with the expected shape, i.e., an approximately lognormal distribution with a peak or turnover near MV ≈ −7.4 mag. Two galaxies however, have luminosity distributions which continue in a power-law fashion at least 1 mag fainter than the expected turnover: NGC 628 and NGC 3627. These atypical luminosity functions are similar to that found for likely GCs in M101, making NGC 628 and NGC 3627 only the second and third spiral galaxies known to have these faint excess populations of red, old clusters.
The faint GC candidates in NGC 628 and NGC 3627 have a more extended spatial distribution than their bright counterparts, as expected from a disk population. They are unlikely to be reddened, young disk clusters because they do not show Hα emission and are not within obvious dust lanes. Their radial distributions are best fit by an exponential profile with a weak excess coincident with the location of spiral arms. Clusters with ages of a few hundred megayears have been found to be associated with the inner spiral arms of M51. We therefore speculate that the faint populations in NGC 628 and NGC 3627 could be lower-mass, intermediate-age (approximately one to a few gigayears) clusters that formed and survived in the disk.
Follow-up, optical spectroscopy would better constrain the ages and dynamics of the faint GC candidates we have found in NGC 628 and NGC 3627. In an upcoming work, we will use our new catalogs to establish the color distributions and calculate specific frequencies of the GC systems for the spiral galaxies studied here.
Acknowledgments
We dedicate this paper to the memory of Julie Whitmore (1954 January 13–2023 August 23).
This work is based on observations made with the NASA/ESA Hubble Space Telescope, obtained at the Space Telescope Science Institute, which is operated by the Association of Universities for Research in Astronomy, Inc., under NASA contract NAS 5-26555. These observations are associated with program #13364.
This work was carried out as part of the PHANGS collaboration. R.C. acknowledges support from NSF grant 1517819.
K.G. is supported by the Australian Research Council through the Discovery Early Career Researcher Award (DECRA) Fellowship (project number DE220100766) funded by the Australian Government. K.G. is supported by the Australian Research Council Centre of Excellence for All Sky Astrophysics in 3 Dimensions (ASTRO 3D), through project number CE170100013.
Software: Photutils (Bradley et al. 2020), Matplotlib (Hunter 2007), NumPy (Oliphant 2006), Astropy (Astropy Collaboration et al. 2013, 2018, 2022), SciPy (Virtanen et al. 2020), and SAOImage DS9 (Smithsonian Astrophysical Observatory 2000).