


Abstract
We report the discovery of PSR J1555−2908, a 1.79 ms radio and gamma-ray pulsar in a 5.6 hr binary system with a minimum companion mass of 0.052 M⊙. This fast and energetic ( erg s−1) millisecond pulsar was first detected as a gamma-ray point source in Fermi Large Area Telescope (LAT) sky survey observations. Guided by a steep-spectrum radio point source in the Fermi error region, we performed a search at 820 MHz with the Green Bank Telescope that first discovered the pulsations. The initial radio pulse timing observations provided enough information to seed a search for gamma-ray pulsations in the LAT data, from which we derive a timing solution valid for the full Fermi mission. In addition to the discovery and timing of radio and gamma-ray pulsations, we searched for X-ray pulsations using NICER but no significant pulsations were detected. We also obtained time-series r-band photometry that indicates strong heating of the companion star by the pulsar wind. Material blown off the heated companion eclipses the 820 MHz radio pulse during inferior conjunction of the companion for ≈10% of the orbit, which is twice the angle subtended by its Roche lobe in an edge-on system.
Export citation and abstract BibTeX RIS
1. Introduction
One of the great successes of the Fermi Large Area Telescope (LAT) mission (Atwood et al. 2009) has been the revelation that a large number of point sources in the GeV gamma-ray sky are powered by pulsars, including large populations both of energetic young pulsars and older, faster spinning millisecond pulsars (MSPs). In the early days of the Fermi mission, these discoveries came via two techniques: (1) folding the observed gamma rays at the pulse period of known radio pulsars (e.g., Abdo et al. 2009a) and (2) direct searches for periodicities in the gamma-ray photon arrival times themselves (e.g., Abdo et al. 2009b). Each of these techniques had its own biases and selection effects that left many gamma-ray pulsars undiscovered. The next highly successful technique was to use the locations of LAT gamma-ray sources that had pulsar-like characteristics (e.g., curved spectra and low variability) as targets for directed searches for radio pulsars, performed by the Fermi Pulsar Search Consortium (PSC) (Ray et al. 2012). This led to a bounty of MSP discoveries that has continued as the LAT survey observations reveal ever more gamma-ray sources (Cognard et al. 2011; Ransom et al. 2011; Kerr et al. 2012; Bhattacharyya et al. 2013; Ray et al. 2013; Camilo et al. 2015; Cromartie et al. 2016). Most recently, a new technique was employed to reveal pulsar candidates among the LAT sources: Frail et al. (2016, 2018) exploited the nearly full-sky 150 MHz Tata Institute of Fundamental Research GMRT Sky Survey (TGSS) radio survey performed by the Giant Metrewave Radio Telescope (GMRT) to identify steep-spectrum radio point sources within the error regions of LAT sources. These candidates were quickly followed up by the PSC with deep radio searches, leading to several new MSP discoveries (initially reported in Frail et al. 2018) and demonstrating the power of this technique. Here we provide details on the discovery of PSR J1555−2908 and follow-up observations that determined its orbit, discovered gamma-ray pulsations, searched for X-ray pulsations, and made initial studies of its optical companion star.
2. Image-based Candidate Selection Method
PSR J1555−2908 was initially identified from an image-based search for potential pulsar candidates. The method is described in more detail in Frail et al. (2018) but here we give a short summary. We searched for compact, steep-spectrum radio sources within the error ellipses of unassociated Fermi sources from a preliminary version of the LAT 8 yr catalog (hereafter 4FGL; Abdollahi et al. 2020). We used the GMRT 150 MHz All-Sky Radio Survey (TGSS ADR1; Intema et al. 2017) and the 1.4 GHz NRAO VLA Sky Survey (NVSS; Condon et al. 1998) to calculate initial two-point spectral indices and source angular diameters for all radio sources within Fermi unassociated sources. Outside the NVSS survey decl. limit (−45°), but north of the decl. limit of TGSS (−53°), we used the 843 MHz Sydney University Molonglo Sky Survey (SUMSS; Bock et al. 1999) for the higher frequency of the two-point spectral index. For those rare compact, steep-spectrum radio sources identified via this method, follow-up interferometric observations at arcsecond resolution were carried out in order to eliminate false positives from the sample, such as high-redshift radio galaxies.
This image-based method differs from past searches of Fermi unassociated sources (e.g., Kerr et al. 2012) in that pulsar candidates are selected without regard to the properties of the Fermi source, such as its spectral shape, temporal variability, the size of the error ellipse, or its sky distribution. A single unresolved radio source was identified within the error ellipse of P86Y3595 (now known as 4FGL J1555.7−2908) with a spectral index α = −2.5 ± 0.2 (where α is given by Sν
∝ να
). The radio source position was measured to be R.A. = 15h55m40 69, decl. = −
 (J2000) with an uncertainty of about 2''.
3. Radio Pulsation Search and Timing Observations
As part of a long-term effort to discover radio pulsars associated with Fermi sources, organized by the Fermi PSC, we made targeted observations of the candidates identified in Frail et al. (2018). We observed P86Y3595 on 2017 February 1 (MJD 57,785) for 30 minutes at 820 MHz with the Robert C. Byrd Green Bank Telescope (GBT). We used the GUPPI pulsar backend to record 200 MHz of bandwidth with 2048 channels at 61.44 μs resolution. We performed an acceleration search of these data over a range of trial dispersion measures using PRESTO (Ransom et al. 2002) and identified a strong candidate pulsation with 1.79 ms period (559.4 Hz) at a dispersion measure (DM) 75.91 pc cm−3. Following the discovery, a GBT observation of 5 minutes at S-band (on MJD 57,806) confirmed the discovery and determined the pulse width at that frequency to be a very narrow 3%.
We also obtained a 30 minute observation on MJD 57,788 using the Karl G. Jansky Very Large Array (VLA) in phased-array pulsar mode. The data were taken while the array was being reconfigured; 20 antennas were in their D-configuration positions (maximum baseline 1 km), and seven still in A-configuration (maximum baseline 30 km). The observation was split into three scans of 10 minutes in order to allow for rephasing. Interferometric phases were determined using the nearby calibrator J1554−2704, then individual antenna data streams were coherently summed to create a single-pixel data stream with high time resolution at the previously determined radio source position. The summed voltage data were processed in real time using dspsr (van Straten & Bailes 2011) and recorded using 2048 0.5 MHz channels (1024 MHz total bandwidth, centered on 1500 MHz) at 32 μs time resolution. It is worth noting that this VLA observation is quite broadband and exhibits profile evolution across the band. This profile evolution likely biases the measured DM from that observation.
We also detected the pulsation in a GBT observation of 2 minutes at 350 MHz that had been taken on MJD 56,907 as part of the GBNCC survey (Stovall et al. 2014). Lastly we obtained a GBT observation of 5 hr on MJD 57,833, revealing an eclipse with a sharp ingress and clear pulse delays for about 10 minutes after egress. The eclipse duration is approximately 10% of the duration of the orbit, and the likely dispersive pulse delays are typical for black widow pulsar systems. This observation was taken in coherently dedispersed search mode, providing a calibrated flux density and high time resolution. A fault in the GUPPI backend at the time of the observation prevented us from extracting reliable polarization measurements from this observation. The eclipse and total intensity pulse profile with high signal-to-noise ratio (S/N) from that observation are shown in Figure 1.
We also obtained five observations of varying duration using the 76 m Lovell telescope between 2019 November 15 and 2020 September 21. We used a backend based on ROACH FPGA boards (Bassa et al. 2016a) to record coherently dedispersed, phase-folded data covering a bandwidth of 384 MHz in 0.25 MHz channels centered at 1534 MHz, with 256 phase bins per pulse period. To obtain approximate flux-density calibrations for these observations, we estimated the system equivalent flux density from observations of the Crab nebula on nearby epochs, adjusting for ground spillover due to the low elevation. We estimate the fractional uncertainty on this calibration to be around 20%. The pulsed flux density was then estimated from each observation by fitting the high-S/N 820 MHz GBT pulse profile as a template, along with an arbitrary baseline, to the flux-calibrated profiles. The average flux density over the five observations was S1534 = 0.20 ± 0.05 mJy. A log of all the radio observations is presented in Table 1. The pulse profile at a range of frequencies is shown in Figure 2.
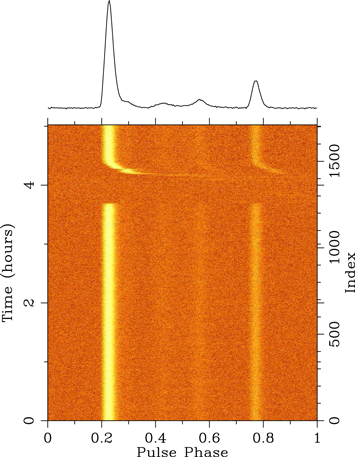
Figure 1. Folded pulse profile (intensity represented by the color) vs. time from a GBT observation of 5 hr at 820 MHz on MJD 57,833, showing the eclipse ingress and pulse delays during the egress. The summed total intensity pulse profile from the same observation is shown at the top.
Download figure:
Standard image High-resolution imageTable 1. Radio Observations of PSR J1555−2908
| Telescope | MJD | Freq. | BW | Duration | Orbital Phase | DM | Sν | Notes |
|---|---|---|---|---|---|---|---|---|
| (UTC) | (MHz) | (MHz) | (s) | (ϕ) | (pc cm−3) | (mJy) | ||
| GBT | 56,907.968322 | 350 | 100 | 120 | 0.668–0.674 | 75.916(2) | GBNCC | |
| GBT | 57,785.510301 | 820 | 200 | 1800 | 0.871–0.959 | 75.9196(6) | Discovery | |
| VLA | 57,788.543634 | 1500 | 1000 | 1920 | 0.862–0.975 | 75.997(4) | ||
| GBT | 57,806.554895 | 2000 | 700 | 480 | 0.006–0.030 | 75.91(2) | 0.10(5) | |
| GBT | 57,833.301146 | 820 | 200 | 18000 | 0.562–0.454 | 75.9212(1) | 2.5(5) | Eclipse |
| Lovell | 58,802.535248 | 1534 | 384 | 1404 | 0.414–0.483 | 75.94(3) | 0.24(5) | |
| Lovell | 58,803.504318 | 1534 | 384 | 525 | 0.564–0.590 | 75.95(4) | 0.27(5) | |
| Lovell | 58,805.433996 | 1534 | 384 | 2397 | 0.828–0.947 | 75.93(2) | 0.16(3) | |
| Lovell | 58,907.194884 | 1534 | 384 | 907 | 0.661–0.706 | 75.87(4) | 0.19(4) | |
| Lovell | 59,113.624898 | 1534 | 384 | 1562 | 0.715–0.793 | 75.89(2) | 0.15(3) |
Download table as: ASCIITypeset image
Combining these radio data, we obtained an initial orbital solution with a period of 5.60 hr and a semimajor axis of 0.151 lt-s. Because we have only a small amount of radio data, most of the system parameters are better determined by the gamma-ray timing in Section 4.2. However, the precise radio times of arrival over the 5 hr observation allow us to determine some of the orbital parameters more precisely than is possible from the gamma-ray data alone. In particular, we measure an eccentricity e = (4.5 ± 1.5) × 10−6,  lt-s, and an epoch of ascending node of tasc = 57,785.53936388(3) MJD(TDB).
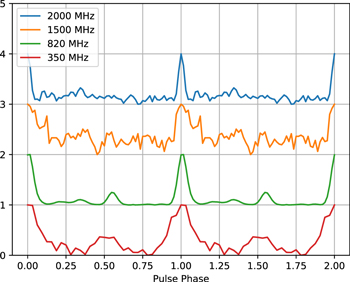
Figure 2. Multiband radio pulse profiles of PSR J1555−2908, from the observations specified in Table 1 (350 MHz = GBT on MJD 56,907, 820 MHz = GBT on 57,833, 1500 MHz = VLA on 57,788, 2000 MHz = GBT on 57,806). The flux density scale is arbitrary and offset vertically for display. Each profile is aligned to put the peak at phase 0.
Download figure:
Standard image High-resolution image4. Gamma-Ray Observations
The initial (not phase-connected) radio timing parameters provided the seed necessary to make a computationally tractable pulsation search in the gamma-ray data, as we describe here.
4.1. Fermi-LAT Data Preparation
To search for gamma-ray pulsations from PSR J1555−2908, we selected Pass 8 SOURCE-class gamma-ray photons (Atwood et al. 2012) detected by the Fermi-LAT between 2008 August 4 and 2018 April 19 from within a region of interest (RoI) of 5° radius around the radio position, with energies greater than 100 MeV, and with a maximum zenith angle of 90°.
To increase the sensitivity of the pulsation search, and avoid the need for hard cuts on photon energies and incidence angles, we weighted the contribution of each photon to the pulsation detection statistic (Kerr 2011). The weights represent the probability of each photon having been emitted by the targeted gamma-ray source, rather than by a nearby point source, or by the diffuse Galactic or isotropic gamma-ray components. The weights were computed with gtsrcprob, using the P8R2_SOURCE_V6 instrument response functions (IRFs) 24 and a preliminary ("FL8Y") version of the Fermi-LAT Fourth Source Catalog, and corresponding diffuse and isotropic emission templates, as the input model for the gamma-ray flux within the RoI.
4.2. Gamma-Ray Pulsation Search and Detection
We performed a gamma-ray pulsation search in 10 yr of LAT data around the parameters of a preliminary timing solution that was based on radio data spanning 50 days. A search was necessary because the radio timing parameters were not measured precisely enough to safely extrapolate over multiple years of LAT data, and the pulsar's gamma-ray photon flux is too weak to show significant pulsations over such a short time span. For several parameters (spin frequency, orbital period) the precision scales directly with the length of the data span, and at this stage the spin frequency derivative had not been measured.
Apart from the radio timing solution, the search parameter space was constrained by a Gaia sky position and the distribution of spin frequency derivatives for known MSPs. It was assumed that a Gaia source (ID 6041127310076589056) at position R.A. = 15h55m4065855(7), decl. = − (J2000) with magnitude G = 20.41 (EDR3; Gaia Collaboration et al. 2021), coincident with the image-based radio position (Section 2), is the pulsar's companion star. In the search, the positional parameters were kept fixed to these values. Note that this source is too faint for Gaia to measure its proper motion or parallax. The spin frequency derivative was searched for in the range
 ![$\dot{f}\in [-2\times {10}^{-14},0]\,\mathrm{Hz}\,{{\rm{s}}}^{-1}$](https://content.cld.iop.org/journals/0004-637X/927/2/216/revision1/apjac49efieqn5.gif) , because more than 95% of the known MSPs fall into this range (ATNF Pulsar Catalogue;
25
Manchester et al. 2005, version 1.64). In the case of a nondetection this range would have been extended in steps.
, because more than 95% of the known MSPs fall into this range (ATNF Pulsar Catalogue;
25
Manchester et al. 2005, version 1.64). In the case of a nondetection this range would have been extended in steps.
The sensitive H statistic (de Jager et al. 1989; Kerr 2011) was utilized to search for gamma-ray pulsations. This statistic incoherently combines the Fourier power of the lowest M harmonics. Typically, most power is found in the lowest five harmonics (Pletsch & Clark 2014), so for computational efficiency we truncated the harmonic summing at M = 5 as in the successful pulsation search of PSR J0952−0607 (Nieder et al. 2019).
An efficient and dense grid covering the parameter space is key to the detection of gamma-ray pulsations. To build such a grid we exploited the distance "metric," which is a second-order approximation of the expected fractional loss in squared signal-to-noise ratio due to offsets in the signal parameters (Balasubramanian et al. 1996; Owen 1996). The metric components for the binary pulsar parameters are presented in Nieder et al. (2020). Denser grids are required for higher harmonics and thus the grid is built for the highest harmonic, here M = 5.
The search space was split into smaller parts and the search was carried out in parallel on the ATLAS computing cluster in Hannover. On one single computer the search would have taken ∼70 days. Distributing the work over 7170 CPU cores, the search only took ∼15 minutes.
Significant gamma-ray pulsations were detected over most of the 10 yr LAT data span used in this search. The resulting pulse phase showed residual time dependence, indicating time evolution of the pulsar spin-down rate. Still, the maximum H statistic detected in the search was H5 = 276.3. Conservatively assuming that all 6 × 10¹¹ trials were independent (the actual effective number of trials is smaller), the false-alarm probability is PFA = 9.6 × 10−37, which confirms the detection of gamma-ray pulsations.
4.3. Gamma-Ray Pulsation Timing
Following the detection of gamma-ray pulsations, we extended the observation span to cover the most recent Fermi-LAT data (Bruel et al. 2018), up to 2020 August 5 (12 yr of data), and used the most recent P8R3_SOURCE_V3 IRFs. In the 8 yr 4FGL (and the 10 yr "4FGL-DR2" iteration, Ballet et al. 2020), the gamma-ray spectrum of 4FGL J1555.7−2908 is modeled with a simple power law, rather than the curved, sub-exponentially cutoff power-law spectrum typical for gamma-ray pulsars. This is because the curved spectrum did not provide a significantly better fit for the observed gamma-ray flux. This is likely due to a combination of a low overall photon flux and high uncertainties in the low-energy flux due to the contribution from the diffuse Galactic interstellar emission. Bruel (2019) developed a method to obtain optimized photon weights by adjusting the spectral parameters to maximize the resulting weighted H statistic. Adopting this technique to optimize the photon probability weights, we found a pulsar-like sub-exponentially cutoff power-law spectrum that resulted in a much more significant pulsation detection than was obtained using the simple power-law spectral model. We therefore adopted these weights for the follow-up timing analyses presented below.
In the timing analysis the pulsar is analyzed precisely using the likelihood,  , and the Bayesian information criterion (BIC; Schwarz 1978). To measure the pulsar parameters
λ
,
, and the Bayesian information criterion (BIC; Schwarz 1978). To measure the pulsar parameters
λ
,  is maximized by fitting a pulse profile to a template pulse profile
  (see, e.g., Ray et al. 2011; Kerr et al. 2015; Clark et al. 2017) by marginalizing over the pulsar parameters and the template parameters jointly as described by Nieder et al. (2019). The likelihood
 ![${ \mathcal L }(\hat{g},{\boldsymbol{\lambda }})={\prod }_{j=1}^{N}[{w}_{j}\hat{g}({\rm{\Phi }}({t}_{j},{\boldsymbol{\lambda }}))+(1-{w}_{j})]$](https://content.cld.iop.org/journals/0004-637X/927/2/216/revision1/apjac49efieqn9.gif) tests how likely the pulse profile is to be described via the template
tests how likely the pulse profile is to be described via the template  versus a flat noise distribution. The jth photon contributes according to its weight wj
and the pulsar's phase at emission time Φj
. The latter is computed using a phase model Φ(tj
,
λ
), the photon's arrival time at the LAT tj
, and the pulsar parameters
λ
. An analytic template is constructed as a sum of wrapped Gaussian peaks. For the width we used a log-uniform prior and constrained the range to allow only peaks broader than 1% of a rotation and narrower than half a rotation. All other parameters used a uniform prior.
versus a flat noise distribution. The jth photon contributes according to its weight wj
and the pulsar's phase at emission time Φj
. The latter is computed using a phase model Φ(tj
,
λ
), the photon's arrival time at the LAT tj
, and the pulsar parameters
λ
. An analytic template is constructed as a sum of wrapped Gaussian peaks. For the width we used a log-uniform prior and constrained the range to allow only peaks broader than 1% of a rotation and narrower than half a rotation. All other parameters used a uniform prior.
To account for small phase variations over the full data span, additional spin-frequency derivatives are needed. While only the first derivative was included in the search, four additional derivatives were favored by the BIC throughout the timing analysis. Higher orders were disfavored by the BIC.
We tested for the presence of additional effects, including proper motion, and eccentricity in the binary system. These parameters were found to be consistent with zero and disfavored by the BIC. For those parameters the timing analysis sets 95% confidence upper limits. A circular orbit is favored over an eccentric one with an upper limit on the eccentricity e95% < 1.4 × 10⁻⁴, which is consistent with the value found in the radio timing (e = (4.5 ± 1.5) × 10−6; see Section 3). The timing analysis clearly favors zero total proper motion  , setting the upper limit to
  . The 95% confidence interval on a variable orbital period is −
 .
.
Our full timing solution for the 12 yr data set is shown in Table 2 and the gamma-ray phase–time diagram, the gamma-ray pulse profile, and the superposed radio pulse profile are shown in Figure 3. For this final timing analysis, the projected semimajor axis x, the epoch of ascending node tasc, and the two Laplace–Lagrangian parameters  and
and  , where ω is the longitude of periastron, were kept fixed to the values from the radio timing analysis (see Section 3).
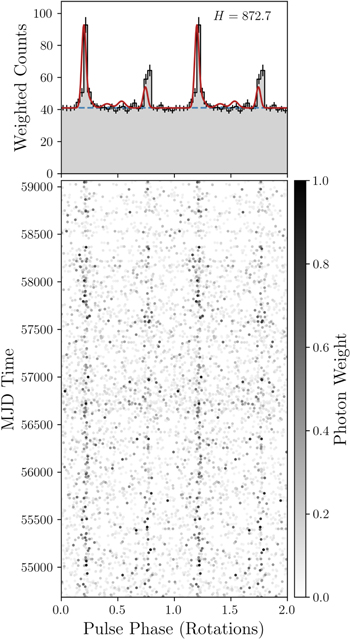
Figure 3. Integrated pulse profile and phase–time diagram of PSR J1555−2908, showing two identical rotations for clarity. Top: the histogram shows the weighted photon counts with 50 bins per rotation. The dashed blue line shows the estimated background level  , with weights wj
and number of bins Nbins. The aligned 820 MHz radio profile is shown in red. Bottom: each point represents the rotational phase of a detected gamma-ray photon and its gray scale indicates the probability weight.
, with weights wj
and number of bins Nbins. The aligned 820 MHz radio profile is shown in red. Bottom: each point represents the rotational phase of a detected gamma-ray photon and its gray scale indicates the probability weight.
Download figure:
Standard image High-resolution imageTable 2. Properties of PSR J1555−2908 from Gamma-Ray Timing
| Parameter | Value |
|---|---|
| Span of timing data (MJD) | 54,681–59,066 |
| Reference epoch (MJD) | 57,800.0 |
| Timing Parameters | |
| R.A. (J2000.0) | 15h55m406587(2) |
| Decl. (J2000.0) | −
|
| Spin frequency, f (Hz) | 559.44000642609(5) |
1st spin-frequency derivative,  (Hz s−1) (Hz s−1) | −1.3937(2) × 10−14 |
2nd spin-frequency derivative,  (Hz s−2) (Hz s−2) | 4(5) × 10−26 |
3rd spin-frequency derivative,  (Hz s−3) (Hz s−3) | 2(2) × 10−33 |
4th spin-frequency derivative,  (Hz s−4) (Hz s−4) | −1.5(7) × 10−40 |
5th spin-frequency derivative,  (Hz s−5) (Hz s−5) | −2.9(8) × 10−48 |
| Orbital period, Porb (day) | 0.2335002685(1) |
| Projected semimajor axis a , x (lt-s) | 0.1514468(1) |
| Epoch of ascending node a , tasc (MJD) | 57,785.53936388(3) |
1st Laplace–Lagrangian parameter
a
,  1 1
| 2(2) × 10−6 |
| 2nd Laplace–Lagrangian parameter
a
, 2
| −4(1) × 10−6 |
| Derived Properties b | |
| Spin period, Pobs (ms) | 1.788 |
1st spin-period derivative,  (s s−1) (s s−1) | 4.45 × 10⁻²⁰ |
| Galactic longitude, l | 344 48 48 |
| Galactic latitude, b | 1850 |
| Characteristic age, τc (Gyr) | 0.64 |
Spin-down power,  (erg s−1) (erg s−1) | 3.1 × 1035 |
| Surface dipole magnetic field, Bs (G) | 2.9 × 10⁸ |
| Light-cylinder magnetic field, BLC (G) | 4.6 × 10⁵ |
Notes. Numbers in parentheses are statistical 1σ uncertainties on the final digits. The JPL DE405 solar system ephemeris has been used and times refer to TDB (using TT = TAI + 32.184 s). The timing solution was obtained using the 12 yr Fermi-LAT data set described in Section 4.3.
a Parameter fixed to radio timing solution, see Section 3. b Not corrected for Shklovskii and Galactic acceleration effects due to highly uncertain distance measurement. However, the nondetection of proper motion suggests that these estimates should be accurate to a few percent.Download table as: ASCIITypeset image
5. NICER X-Ray Pulsation Search
Although the distance inferred from the dispersion measure is large (see Section 7), PSR J1555−2908 is one of the 10 fastest MSPs in the Galactic field (i.e., outside a globular cluster), and the LAT timing indicates that the spin-down power is very high, at 3.1 × 1035 erg s−1. This makes it a good candidate to search for X-ray pulsations, because other high- MSPs (e.g., B1937+21, B1821−24, and J0218+4232) exhibit bright nonthermal pulsations.
Motivated by this, we made a 122 ks observation of this source with the NICER X-ray telescope (NICER proposal #2527), with data accumulated from 2019 May 26 (ObsID 2527010101) through 2019 September 9 (ObsID 2527010142). Ray et al. (2019) provide a description of the NICER X-ray Timing Instrument and details of the data reduction for MSP pulsation searches. We follow a similar procedure here, but since these data were taken with a large angle between the target and the Sun, optical loading was not a significant problem, so we did not mask any of the 52 active detectors. We analyzed our data with HEASoft version 6.27.2 (NICER tools version 2020-04-23_V007a) and updated the gain calibration to version nixtiflightpi20170601v006. Our initial data extraction included energies of 0.25–10.0 keV, and made standard data cuts to exclude the South Atlantic Anomaly and ensure NICER was tracking the source and the source was >20° above the Earth limb. We made no cuts on magnetic cutoff rigidity, or the total count rate, in our initial extraction. This initial extraction yielded 117.8 ks of good time. For each photon, we computed the pulse phase using photonphase from PINT (Luo et al. 2021) and the timing model provided in Table 2. The par file for this model, compatible with the Tempo2 and PINT pulsar timing packages, is included in the .tar.gz package associated with this paper.
To exclude high background regions, instead of making an arbitrary cut on count rate, we developed a tool ni_Htest_sortgti.py that divides the data into segments of no more than 100 s (and no less than 10 s). These segments are sorted by mean count rate. Since the count rate from the pulsar is very low and presumably constant, this is equivalent to sorting by background rate. Then the H-test detection statistic is evaluated cumulatively, going from the lowest background to the highest. This algorithm thus finds the optimal background rate cut that maximizes the S/N of any detected signal. The script repeats this process over a large grid of Emin and Emax energy cuts to search for an optimal energy band as well. For our detection statistic, we chose to use the H-test (de Jager et al. 1989), which is preferred to the Z2 test for unknown pulse profiles that may be very sharp, as is seen in the nonthermal X-ray MSPs.
For PSR J1555−2908, this procedure did not reveal any very strong candidate pulsation. The highest H-test found corresponded to a single-trial significance of 3.05σ, when searching the range 0.26–2.74 keV, with the algorithm selecting the 106.7 ks with the lowest background out of the total. In those data, the mean count rate was 0.80 s−1. Since there were a large number of trials over the energy and background cuts, this does not represent a significant detection.
In the 0.25–2.0 keV band, the median count rate (source+background) was 0.75 s−1, with 90% of segments below 1.13 s−1. In the 2–8 keV band, the median count rate (source+background) was 0.23 s−1, with 90% of segments <0.6 s−1.
6. Optical Counterpart
We performed differential time-series photometry at the position of PSR J1555−2908 using the 2.4 m Hiltner telescope of the MDM Observatory on 2018 June 12 and 15. A back-illuminated SITe CCD with 1024 × 1024 24 μm pixels, each subtending 0 275, was exposed through an Sloan Digital Sky Survey r filter. Integrations of 5 minutes each were obtained for a total of 7.16 hr over the two nights. The differential photometry was calibrated using a comparison star from Pan-STARRS. A variable star with a maximum brightness of r = 20.4 and displaying a typical heating-dominated light curve was detected at the image-based radio position (Section 2), also consistent with the position and magnitude of the Gaia counterpart (Section 4.2) and the position from gamma-ray timing (Table 2). A finding chart is shown in Figure 4.
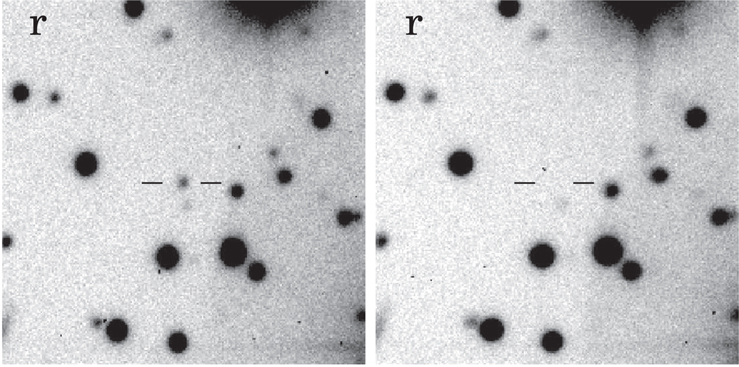
Figure 4. MDM 2.4 m r-band images centered on PSR J1555−2908, near maximum (left) and minimum (undetected, right) orbital brightness. The field displayed is 60'' × 60''; north is up and east is to the left.
Download figure:
Standard image High-resolution imageIt was immediately apparent that the timescale and pattern of variability are consistent with orbital modulation of a low-mass companion star heated by the pulsar wind. The phased light curve using the orbital ephemeris of Table 2 is shown in Figure 5. As expected, the peak brightness occurs near phase 0.75, superior conjunction of the companion, where we are viewing the heated side of the star. The "night" side of the companion was not detected; only upper limits of r > 23 were obtained at phases ϕ = 0.25 ± 0.1.
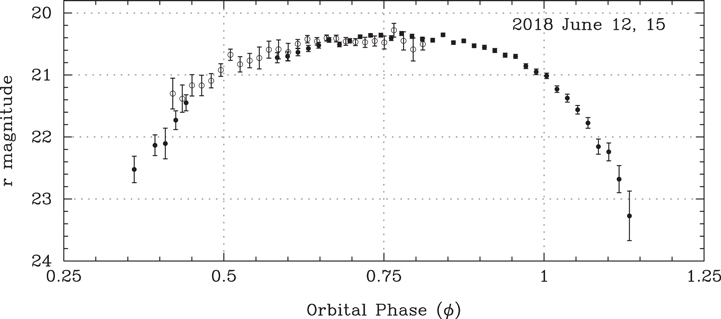
Figure 5. MDM 2.4 m r-band light curve of PSR J1555−2908 phased according to the ephemeris of Table 2. Filled circles are from 2018 June 12 and open circles are from 2018 June 15. Differential photometry was calibrated using a comparison star from Pan-STARRS. Upper limits of r > 23 close to inferior conjunction of the companion star (ϕ = 0.25 ± 0.1) are not shown. The data quality is worse on June 15 because of poor seeing. The photometry is available as the data behind the figure.(The data used to create this figure are available.)
Download figure:
Standard image High-resolution image7. Discussion
The radio discovery of PSR J1555−2908 continues the trend of successfully finding radio pulsations from MSPs by targeting LAT sources. It also demonstrates the power of using imaging radio surveys to discover steep-spectrum point sources associated with LAT sources. These are prime pulsar candidates.
The pulsar discovery provides some constraints on the distance to the source. The dispersion measure of 75.9 pc cm−3 gives distance estimates of 2.65 kpc for the NE2001 electron density model (Cordes & Lazio 2002) and 7.55 kpc for the YMW16 model (Yao et al. 2017). The difference in the two estimates can be traced to the properties of the thick disk component in the electron density models. The DM at high Galactic latitude is dominated by the thick disk, which in the YMW16 model has a smaller central density and a larger scale height than in the NE2001 model, and an integrated column density that is slightly more than half that of NE2001. High-latitude pulsars are thus assigned a larger DM distance in YMW16. PSR J1555−2908 is at Galactic coordinates (ℓ, b) = (3445, + 185), and has the largest DM of neighboring pulsars within a 5° radius. This pushes it to a large, albeit uncertain distance in YMW16.
From our flux-calibrated observations with the Lovell telescope, we estimated an L-band pulsed flux density of S1534 = 0.20 ± 0.05 mJy. Comparing this to the imaging flux density measured at 150 MHz by Frail et al. (2018) of S150 = 133.9 ± 14.4 mJy, and assuming a simple power-law spectrum Sν ∝ να , yields a two-point spectral index estimate of α = −2.8 ± 0.1, confirming the steep spectrum.
PSR J1555−2908 is a fast and energetic pulsar, currently the 13th fastest Galactic MSP in the ATNF Pulsar Catalogue. The small upper limit on the measured proper motion of 6.4 mas yr−1 sets an upper limit on the Shklovskii correction to the spin-down rate of at most 3%. The larger of the two DM distance estimates gives an intrinsic spin-down luminosity of 2.98 × 1035 erg s−1. This can be compared with the measured gamma-ray luminosity. The associated LAT source in the 4FGL DR3 catalog is 4FGL J1555.7−2908 with an energy flux above 100 MeV (G100) of (4.66 ± 0.61) × 10−12 erg cm−2 s−1. This corresponds to an efficiency of converting spin-down energy into >100 MeV gamma rays of 1.3% for d = 2.65 kpc and 11% for d = 7.55 kpc. These are both plausible values for gamma-ray MSPs (see Abdo et al. 2013). Alternatively, Abdo et al. (2013) define a rough heuristic relationship  erg s−1, which gives an expected gamma-ray luminosity of 1.8 × 1034 erg s−1. This implies a distance of 5.7 kpc, but with substantial uncertainty based on the observed scatter around that relationship.
The X-ray pulsation upper limits can be compared to the population of gamma-ray MSPs whose properties are compiled in Abdo et al. (2013). The ratio of >100 MeV gamma-ray flux (G100) to nonthermal X-ray flux ( unabsorbed 0.3–10 keV) ranges over at least two orders of magnitude, from ∼20 to over several thousand. If PSR J1555−2908 is like the energetic MSP PSR B1937+21 (essentially the most optimistic case), which has
  , then FX could be as high as 3 × 10⁻¹³ erg s−1. Assuming nH = 2.2 × 1021 cm−2 scaled from the DM according to He et al. (2013) and a power-law index of 2.0 yields a NICER count rate of 0.044 s−1. The detectability of pulsations depends on the unknown pulse shape (ranging from the worst case of a pure sinusoid to a very narrow pulse with low duty cycle), but we can estimate the detection significance using the method of Buccheri et al. (1987). For this flux, we should have detected these pulsations if the source pulsed fraction was larger than 75% (for a sinusoid) or 40% (for a narrow pulse). For less favorable gamma-ray to X-ray flux ratios, e.g., with predicted count rates <0.018 s−1, our observation would not have detected pulsations even with very narrow pulse shapes. Consequently, the X-ray observation is not sensitive enough to place very stringent constraints on the X-ray luminosity, but could have detected pulsations if this pulsar had an X-ray luminosity and pulse shape similar to PSR B1937+21.
In long-term timing of MSPs, for example with pulsar timing arrays like NANOGrav, it is very unusual for frequency derivatives above  to be significantly detected. One notable counterexample is PSR J1024−0719, which has a significantly detected second spin frequency derivative (Kaplan et al. 2016; Bassa et al. 2016b), ascribed to a long-period orbit. A discussion of the measured timing noise and the possibility of PSR J1555−2908 being in a triple system with a long-period outer orbit will be presented in L. Nieder et al. (2022, in preparation).
Another unusual trait of this MSP is the aligned radio and gamma-ray peaks, with similar morphology. These MSPs, dubbed Type A (for "aligned") by Espinoza et al. (2013) or Class II by Johnson et al. (2014), account for only a few percent of the known gamma-ray MSPs in the Fermi Third Pulsar Catalog (3PC, in preparation). MSPs in this subset are generally highly energetic, but the strongest correlation seems to be with the inferred magnetic field at the light cylinder (BLC; Espinoza et al. 2013). In the radio band they also generally have steeper spectra and lower levels of linear polarization than the general MSP population, and several are known to emit giant pulses. PSR J1555−2908 follows this trend, with its high  , very large BLC, and steep (α = −2.5; Frail et al. 2018) radio spectral index; however, we do not see evidence for giant pulses in the long 820 MHz GBT observation. Unfortunately, an instrumental issue with the GUPPI backend prevented us from making a measurement of the linear polarization fraction. The most successful models for these pulsars invoke co-located radio and gamma-ray emission regions in the outer magnetosphere, such as altitude-limited two-pole caustic models (Johnson et al. 2014).
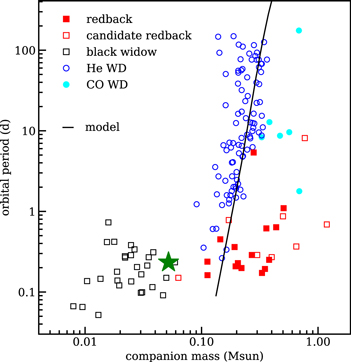
As has been the case for many of the MSPs discovered in searches of LAT sources, this pulsar is in an interacting binary system. The orbital solution gives a minimum companion mass of 0.052 M⊙, for an assumed neutron star mass of 1.4 M⊙. The very low mass of the companion (much lower than the mass of the white dwarf predicted by Tauris & Savonije (1999) of 0.17 M⊙) and radio eclipses put it in the black widow class. As shown in Figure 6, the minimum companion mass is relatively large for MSPs in this range of orbital period, which tend to have minimum companion masses of 0.02–0.03 M⊙, but the eclipse around phase 0.25 indicates that the system is nearly edge-on, so the true companion mass is close to the minimum value. The eclipse spans ≈10% of the orbit, which is twice the width of the companion's Roche lobe (see below) in an edge-on system, consistent with absorption by an evaporated wind. The measured eccentricity is very low, but in family for black widow type systems.
Figure 6. Companion mass vs. orbital period for recycled field MSPs with known companion star types. Most MSPs have He white dwarfs (open blue circles) from binary evolution, well represented by models from Tauris & Savonije (1999). These models (black line) assume an initial secondary mass of 1.0 M⊙, and denote the endpoints of an ensemble of systems with varying initial period, not the evolution of a single binary. The few CO white dwarfs (filled cyan circles) had close common-envelope evolution. The field redbacks (filled/open red squares) and black widows (open black squares) are visible at short orbital period. PSR J1555−2908 is marked with a green star at its minimum companion mass assuming an edge-on orbit and a neutron star mass of 1.4 M⊙. Figure and caption adapted from Strader et al. (2019).
Download figure:
Standard image High-resolution image
Our optical observations confirm that the optical source detected by Gaia is the heated companion star to PSR J1555−2908. The amplitude of the modulation, likely more than four magnitudes from maximum to the nondetection at minimum, is among the largest seen in black widow companions (e.g., Breton et al. 2013; Draghis et al. 2019), which is consistent with heating being powered by the unusually high spin-down power. With a light curve in only one filter, and incomplete detection around the orbit, it is not possible to constrain a detailed model of the system geometry and irradiation of the companion star by the pulsar wind. Instead, we make a back-of-the-envelope calculation to check whether the peak observed flux of the companion is consistent with heating supplied by the spin-down power of the pulsar, and see if this constrains the temperature of the heated side of the companion. For an assumed isotropic pulsar wind and a Roche-lobe-filling companion, the maximum irradiating power can be approximated as  , where rL
is the radius of the Roche lobe of the companion, a is the orbital separation, η is the heating efficiency, and
, where rL
is the radius of the Roche lobe of the companion, a is the orbital separation, η is the heating efficiency, and  erg s−1 for PSR J1555−2908. Assuming masses of 1.4 M⊙ and 0.052 M⊙, the ratio rL
/a = 0.154 according to Eggleton (1983). The maximum irradiating power is then Lirr = 1.8 × 1033
η erg s−1.
erg s−1 for PSR J1555−2908. Assuming masses of 1.4 M⊙ and 0.052 M⊙, the ratio rL
/a = 0.154 according to Eggleton (1983). The maximum irradiating power is then Lirr = 1.8 × 1033
η erg s−1.
In order to compare this to the observed optical flux at orbital phase 0.75, we assume an orbital inclination of i ≈ 90°, which is justified by the radio eclipses and the large amplitude of optical modulation around the orbit. We also correct the observed r = 20.4 for Ar
= 0.316, the maximum extinction along the line of sight (Schlafly & Finkbeiner 2011). Converting magnitude to flux density using  erg cm−2 s−1 Å−1 (Fukugita et al. 1995), the absorption-corrected flux density at
  Å is fλ,eff = 2.2 ×10⁻¹⁷ erg cm−2 s−1 Å−1. For the DM distance we assume either 2.65 or 7.55 kpc according to the two models of the electron density distribution referenced above.
At d = 2.65 kpc, we find that the temperature of the heated half of the star is required to be ≥5000 K in order for the star to fit within its Roche lobe. At Th = 5000 K, the efficiency η would be 0.05. For higher temperature the heated area would decrease, allowing the star to partially fill its Roche lobe, and the efficiency would increase modestly. Assuming instead that d = 7.55 kpc, the hot side must have Th > 9000 K to fit within the Roche lobe, but the efficiency becomes η ≥ 0.44. Any temperature above 14,000 K would require η > 1. Thus, the range of plausible models would be much more limited at the larger distance.
We have additionally obtained 12 hr of simultaneous photometric observations in the u, g, and i bands with the high-speed multiband imager ULTRACAM on the 3.6 m New Technology Telescope at ESO La Silla, as well as 0.65 orbits of optical spectroscopy, covering the optical maximum, with X-SHOOTER on ESO's Very Large Telescope. These observations and their modeling will be presented in M. Kennedy et al. (2022, in preparation).
We thank Nicholas C. S. Ray (West Potomac High School) for his careful screening of the candidates from the GBT pulsation search that first revealed the pulsar.
The Fermi-LAT Collaboration acknowledges generous ongoing support from a number of agencies and institutes that have supported both the development and the operation of the LAT as well as scientific data analysis. These include the National Aeronautics and Space Administration and the Department of Energy in the United States, the Commissariat à l'Energie Atomique and the Centre National de la Recherche Scientifique/Institut National de Physique Nucléaire et de Physique des Particules in France, the Agenzia Spaziale Italiana and the Istituto Nazionale di Fisica Nucleare in Italy, the Ministry of Education, Culture, Sports, Science and Technology (MEXT), High Energy Accelerator Research Organization (KEK) and Japan Aerospace Exploration Agency (JAXA) in Japan, and the K. A. Wallenberg Foundation, the Swedish Research Council, and the Swedish National Space Board in Sweden.
Additional support for science analysis during the operations phase is gratefully acknowledged from the Istituto Nazionale di Astrofisica in Italy and the Centre National d'Études Spatiales in France. This work was performed in part under DOE Contract DE-AC02-76SF00515.
Fermi work at NRL is supported by NASA. E. C. F. is supported by NASA under award number 80GSFC21M0002. Pulsar research at Jodrell Bank Centre for Astrophysics and access to the Lovell telescope is supported by a consolidated grant from the UK Science and Technology Facilities Council (STFC). This work was supported by the Max-Planck-Gesellschaft (MPG).
MDM Observatory is operated by Dartmouth College, Columbia University, Ohio State University, Ohio University, and the University of Michigan. The National Radio Astronomy Observatory and the Green Bank Observatory are facilities of the National Science Foundation operated under cooperative agreement by Associated Universities, Inc.
S.M.R. is a CIFAR Fellow and is supported by the NSF Physics Frontiers Center awards 1430284 and 2020265.
C.J.C. acknowledges support from the ERC under the European Union's Horizon 2020 research and innovation program (grant agreement No.715051; Spiders).
This research has made use of data and/or software provided by the High Energy Astrophysics Science Archive Research Center (HEASARC), which is a service of the Astrophysics Science Division at NASA/GSFC and the High Energy Astrophysics Division of the Smithsonian Astrophysical Observatory. This research has made use of the NASA Astrophysics Data System (ADS) and the arXiv.
Facilities: Fermi - Fermi Gamma-Ray Space Telescope (formerly GLAST), GBT - , VLA - , NICER. -
Software: astropy (Astropy Collaboration et al. 2018), PINT (Luo et al. 2021; https://github.com/nanograv/pint), HEAsoft (ascl:1408.004; https://heasarc.gsfc.nasa.gov/docs/software/heasoft/).
Footnotes
- 24
- 25