


Abstract
Ultra-high-energy photons with energies exceeding 1017 eV offer a wealth of connections to different aspects of cosmic-ray astrophysics as well as to gamma-ray and neutrino astronomy. The recent observations of photons with energies in the 1015 eV range further motivate searches for even higher-energy photons. In this paper, we present a search for photons with energies exceeding 2 × 10¹⁷ eV using about 5.5 yr of hybrid data from the low-energy extensions of the Pierre Auger Observatory. The upper limits on the integral photon flux derived here are the most stringent ones to date in the energy region between 1017 and 1018 eV.
Export citation and abstract BibTeX RIS

Original content from this work may be used under the terms of the Creative Commons Attribution 4.0 licence. Any further distribution of this work must maintain attribution to the author(s) and the title of the work, journal citation and DOI.
1. Introduction
The recent observations of photons with energies of a few 1014 eV from decaying neutral pions, both from a direction coincident with a giant molecular cloud (HAWC J1825-134, Albert et al. 2021) and from the Galactic plane (Amenomori et al. 2021), provide evidence for an acceleration of cosmic rays to energies of several 1015 eV, and above, in the Galaxy. A dozen sources emitting photons with energies up to 1015 eV have even been reported (Cao et al. 2021a), and in at least one of them (LHAASO J2108+515, also in directional coincidence with a giant molecular cloud), these photons might have a hadronic origin (Cao et al. 2021b). Observations of these photons are key in probing the mechanisms of particle acceleration, completing the multi-messenger approach aimed at understanding the nonthermal processes producing cosmic rays. The detection of even higher-energy photons would be of considerable interest in discovering extreme accelerators in the Galaxy. Also, should one detect photons of such energies clustered preferentially in the direction of the Galactic center, then this could highlight the presence of super-heavy dark matter (SHDM) produced in the early universe and decaying today (see, e.g., Benson et al. 1999; Berezinsky & Mikhailov 1999; Medina-Tanco & Watson 1999; Aloisio et al. 2006; Siffert et al. 2007; Kalashev & Kuznetsov 2016; Alcantara et al. 2019).
Above 1017 eV, the absorption length for photons almost matches the scale of the Galaxy, and reaches that of the Local Group as the energy increases (Risse & Homola 2007). The observation of point-like sources of photons would be compelling evidence for the presence of ultra-high-energy (UHE) accelerators within such a local horizon. Diffuse fluxes of photons are also expected from farther away from the interactions of ultra-high-energy cosmic rays (UHECRs) with the background photon fields permeating the extragalactic space (see, e.g., Gelmini et al. 2008; Kampert et al. 2011; Bobrikova et al. 2021) or with the interstellar matter in the Galactic disk (Bérat et al. 2022). Although the estimation of these cosmogenic photon fluxes suffers from several uncertainties of astrophysical origin, such as, in particular, the exact composition of UHECRs, they can be determined to range, at most, around 10−2 km−2 sr−1 yr−1 above 1017 eV and around 10−3.5 km−2 sr−1 yr−1 above 1018 eV. These cosmogenic fluxes are more than two orders of magnitude below the sensitivity of current instruments, thereby constituting a negligible background for detecting photons from point sources, extended structures, or exotic phenomena.
Previous searches for a diffuse flux of photons using data from KASCADE-Grande (Apel et al. 2017) and EAS-MSU (Fomin et al. 2017) have led to upper limits on photon fluxes of the order of 10 km−2 sr−1 yr−1 for energy thresholds between 1017 and 3 × 10¹⁷ eV, while at higher energies, at a threshold of 1018 eV, upper limits of the order of 10−2 km−2 sr−1 yr−1 were determined using data from the Pierre Auger Observatory (Savina & Pierre Auger Collaboration 2021). The aim of the study reported in this paper is to search for primary photons with energies above 2 × 10¹⁷ eV using data from the low-energy extensions of the Pierre Auger Observatory, which are briefly presented in Section 2. The data set used in this study is described in Section 3 together with the simulations needed to establish the selection criteria aimed at distinguishing photon-induced air showers from those initiated by hadronic cosmic rays. In Section 4, the specificities of the photon-induced showers are used to define discriminating observables, which are then combined to search for photon candidate events in the data. The results are given in Section 5, and from the absence of a photon signal, upper limits on the integral photon flux are derived that improve the previous ones mentioned before. Finally, the astrophysical significance of these limits is discussed in Section 6.
2. The Pierre Auger Observatory
The Pierre Auger Observatory (Aab et al. 2015a), located near Malargüe, Argentina, offers an unprecedented exposure for UHE photons. A key feature of the Pierre Auger Observatory is the hybrid concept, combining a surface detector array (SD) with a fluorescence detector (FD). The SD consists of 1600 water-Cherenkov detectors arranged on a triangular grid with a spacing of 1500 m, covering a total area of 3000 km2. The SD is overlooked by 24 fluorescence telescopes, located at four sites at the border of the array. The SD samples the lateral shower profile at ground level, i.e., the distribution of particles as a function of the distance from the shower axis, with a duty cycle of ∼ 100%, while the FD records the longitudinal shower development in the atmosphere above the SD. The FD can only be operated in clear, moonless nights, reducing the duty cycle to ∼ 15%. Through combining measurements from both detector systems in hybrid events, a superior accuracy of the air-shower reconstruction can be achieved than with just one system. In the western part of the SD array, 50 additional SD stations have been placed between the existing SD stations, forming a sub-array with a spacing of 750 m and covering a total area of about 27.5 km2. With this sub-array, air showers of lower primary energy (below 1018 eV) with a smaller footprint can be measured. To also allow for hybrid measurements in this energy range, where air showers develop above the field of view of the standard FD telescopes, three additional High-Elevation Auger Telescopes (HEAT) have been installed at the FD site Coihueco, overlooking the 750 m SD array. The HEAT telescopes operate in the range of elevation angles from 30°–60°, complementing the Coihueco telescopes operating in the 0°–30° range. The combination of the data from both HEAT and Coihueco ("HeCo" data) enable fluorescence measurements of air showers over a large range of elevation angles. A schematic depiction of the detector layout, including the 750 m array and HEAT, can be found in Figure 1.
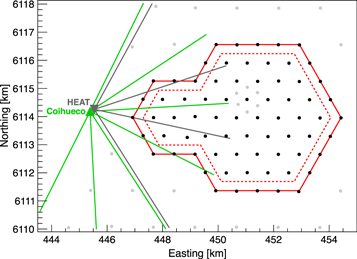
Figure 1. Schematic depiction of the part of the detector layout of the Pierre Auger Observatory (Aab et al. 2015a) that is relevant for the analysis discussed here. Detector stations from the 750 m SD array are shown as black points. Detector stations that are not used in this analysis (for example, from the 1500 m SD array) are grayed out. The projections of the fields of view of the fluorescence telescopes from Coihueco and HEAT on the ground are indicated by the green and gray lines, respectively. Note that Coihueco and HEAT cover different elevation ranges. The outline of the 750 m SD array is given by the solid red line, while the dashed red line marks the region where the shower core of an air-shower event has to be located for the event to be accepted in this analysis (see Section 3).
Download figure:
Standard image High-resolution image3. Data Samples and Simulations
The analysis is based on hybrid data collected by the Coihueco and HEAT telescopes and the 750 m SD array between 2010 June 1 and 2015 December 31. Subsequent data will be used in a follow-up paper. In the present paper, we use the same analysis techniques as in Aab et al. (2017a) to provide a first search for photons in the energy range between 2 × 10¹⁷ and 1018 eV using data from the Pierre Auger Observatory. The follow-up paper will not only make use of a larger data set, but will also profit from an analysis that is tailor-made for the low-energy enhancements of the Observatory.
Several selection criteria are applied to this data set to ensure a good reconstruction of the air-shower events and a reliable measurement of the observables used to discriminate photon- and hadron-induced air showers (see Section 4). These criteria are summarized in the following.
The total data set contains 587,475 HeCo events at the detector level, before any further selection criteria are applied. A subsample consisting of about 5% of the total data set (29,531 events, selected from the full data period using the simple prescription  , where TGPS denotes the time the event was recorded in units of GPS seconds) was used as a burnt sample to optimize the event selection and perform cross checks on the analysis. The events from the burnt sample are not used in the final analysis.
At the geometry level of the event selection, it is required that the events are reconstructed using the hybrid event reconstruction procedure, taking into account the timing information from a triggered SD station from the 750 m SD array in addition to the FD measurements. To exclude events pointing directly toward the FD telescope, where Cherenkov light will distort the FD measurement, a minimum viewing angle of 15° is required. Lastly, only events where the shower core is reconstructed within the inner region of the 750 m SD array (marked by the dashed red line in Figure 1) and where the zenith angle is below 60° are considered. More inclined events are not taken into account because of the absorption of the electromagnetic component of the air showers in the atmosphere and the resulting smaller trigger efficiency at lower energies.
At the third level of the event selection, the profile level, events with an unreliable reconstruction of the longitudinal profile of the air shower are discarded using a cut based on the reduced χ2 of the fit of a Gaisser–Hillas function to the recorded profile. Events are only accepted when the reconstructed atmospheric depth of the shower maximum  is inside the geometrical field of view of the fluorescence telescopes and gaps in the recorded tracks, which can appear, for example, for air showers crossing several telescopes, amount to less than 30% of the total observed track length. Finally, it is required that the uncertainty on the reconstructed photon energy Eγ
, defined as the calorimetric energy taken from the integration of the profile plus a missing-energy correction of 1% appropriate for primary photons (Aab et al. 2017a), is less than 20%.
is inside the geometrical field of view of the fluorescence telescopes and gaps in the recorded tracks, which can appear, for example, for air showers crossing several telescopes, amount to less than 30% of the total observed track length. Finally, it is required that the uncertainty on the reconstructed photon energy Eγ
, defined as the calorimetric energy taken from the integration of the profile plus a missing-energy correction of 1% appropriate for primary photons (Aab et al. 2017a), is less than 20%.
Since the precise knowledge of the atmospheric conditions is crucial for the hybrid reconstruction, events recorded during periods without information on the aerosol content of the atmosphere are not taken into account. To exclude events where the recorded profile may be distorted due to clouds over the Observatory, only events from known cloud-free periods are accepted. Events where no information on the cloud coverage is available from either the Lidar system installed at the FD site Coihueco (BenZvi et al. 2007) or infrared data from the GOES-12 satellite (Abreu et al. 2013) are excluded.
Finally, the last selection criterion removes events where fewer than four of the six SD stations in the first 750 m hexagon around the station with the largest signal are active. Such cases can occur, e.g., in the border region of the array or when individual SD stations are temporarily offline and not taking data. In this case, the discriminating observables Sb and Nstations (see Section 4) can be underestimated, mimicking air showers initiated by photons.
The numbers of events after each level of the event selection and the associated selection efficiencies are given in Table 1, excluding the burnt sample as mentioned before. The largest reduction occurs already at the geometry level. Here, the main contribution comes from the restriction of the acceptance to the area of the 750 m SD array, followed by the requirement that the events have to be reconstructed using the hybrid procedure. After all cuts, 2,204 events remain with a photon energy Eγ above 2 × 10¹⁷ eV.
Table 1. Numbers of Events from the Data Sample (Excluding the Burnt Sample) Passing the Different Event Selection Levels and the Associated Selection Efficiencies Relative to the Preceding Level
| Total number of HeCo events: | 557,944 | ... |
| After geometry level: | 20,545 | 3.7% |
| After profile level: | 12,129 | 59.0% |
| After atmosphere level: | 4373 | 36.1% |
| After Sb level: | 3873 | 88.6% |
| Eγ ≥ 2 × 10¹⁷ eV: | 2204 | 56.9% |
Note. See the text for explanations.
Download table as: ASCIITypeset image
A large sample of simulated events has been used to study the photon/hadron separation by the observables used in this analysis, to train the multivariate analysis, and to evaluate its performance. Air-shower simulations have been performed with CORSIKA (Heck et al. 1998), using EPOS LHC (Pierog et al. 2015) as the hadronic interaction model. About 72,000 photon-induced and 42,000 proton-induced air showers in six bins of equal width in ![${\mathrm{log}}_{10}(E[\mathrm{eV}])$](https://content.cld.iop.org/journals/0004-637X/933/2/125/revision1/apjac7393ieqn3.gif) between 1016.5 and 1019.5 eV, following a power-law spectrum with spectral index −1 within each bin, have been used. Zenith and azimuth angles of the simulated events were drawn from an isotropic distribution between 0° and 65° and from a uniform distribution between 0° and 360°, respectively. Although they do not have a significant impact on the development of photon-induced air showers at the target energy range below 1018 eV, pre-showering (Erber 1966; McBreen & Lambert 1981; Homola et al. 2007), and LPM effects (Landau & Pomeranchuk 1953; Migdal 1956) were included in the simulations. Only proton-induced air showers are used as background, as these are the most photon-like compared to air showers induced by heavier nuclei such as helium. Even though there are indications that the composition of UHECRs is getting heavier with energy (see, e.g., Yushkov & Pierre Auger Collaboration 2019), the assumption of a pure-proton background in the context of a search for UHE photons can be taken as a conservative worst-case assumption, since including heavier nuclei would always lead to a smaller estimate for the contamination in the final sample of photon candidate events.
between 1016.5 and 1019.5 eV, following a power-law spectrum with spectral index −1 within each bin, have been used. Zenith and azimuth angles of the simulated events were drawn from an isotropic distribution between 0° and 65° and from a uniform distribution between 0° and 360°, respectively. Although they do not have a significant impact on the development of photon-induced air showers at the target energy range below 1018 eV, pre-showering (Erber 1966; McBreen & Lambert 1981; Homola et al. 2007), and LPM effects (Landau & Pomeranchuk 1953; Migdal 1956) were included in the simulations. Only proton-induced air showers are used as background, as these are the most photon-like compared to air showers induced by heavier nuclei such as helium. Even though there are indications that the composition of UHECRs is getting heavier with energy (see, e.g., Yushkov & Pierre Auger Collaboration 2019), the assumption of a pure-proton background in the context of a search for UHE photons can be taken as a conservative worst-case assumption, since including heavier nuclei would always lead to a smaller estimate for the contamination in the final sample of photon candidate events.
All simulated air-shower events are processed with the Auger Offline Software Framework (Argiro et al. 2007) for a detailed simulation of the detector response. In these simulations, the actual detector status of both the SD and the FD as well as the atmospheric conditions at any given time during the aforementioned data period are taken into account, leading to a realistic estimate of the detector response. Each simulated air shower is used five times, each time with a different impact point on the ground, randomly taken from a uniform distribution encompassing the region of the 750 m SD array, and with a different event time, which was randomly determined according to the on-time of the Coihueco and HEAT telescopes during the data period used in this analysis. All simulated events are finally passed through the same event selection as the events from the data sample. After the event selection stage, the simulated samples contain about 55,000 photon-induced events and about 35,000 proton-induced events.
4. Analysis
The search for primary photons presented in this work exploits the well-known differences in air-shower development for photon-induced and hadron-induced air showers: on the one hand, air showers initiated by photons develop deeper in the atmosphere than those initiated by hadrons, and on the other hand, they exhibit a smaller number of muons at ground level (Risse & Homola 2007). The first difference can be quantified through  , which can be directly measured with the FD. To complement the FD observable
  , we use another quantity determined from the data of the 750 m SD array, called Sb
, which is defined as follows (Ros et al. 2011):
, we use another quantity determined from the data of the 750 m SD array, called Sb
, which is defined as follows (Ros et al. 2011):

where Si
denotes the measured signal in the ith SD station at a perpendicular distance Ri
to the shower axis. The parameter Sb
has been chosen here as b = 4 to optimize the photon-hadron separation in accordance with Aab et al. (2017a). By construction, Sb
is sensitive to the lateral distribution, which in turn depends on the depth of the air-shower development in the atmosphere and the number of muons. Hence, Sb
can be used to distinguish photon- and hadron-induced air showers. In addition to  and Sb
, the number of triggered SD stations Nstations is also used in the analysis, as it has been shown in Aab et al. (2017a) that it can significantly improve the overall performance of the analysis. The distributions of
and Sb
, the number of triggered SD stations Nstations is also used in the analysis, as it has been shown in Aab et al. (2017a) that it can significantly improve the overall performance of the analysis. The distributions of  , Sb
, and Nstations are shown in Figure 2 for the simulated samples as well as the data sample.
, Sb
, and Nstations are shown in Figure 2 for the simulated samples as well as the data sample.
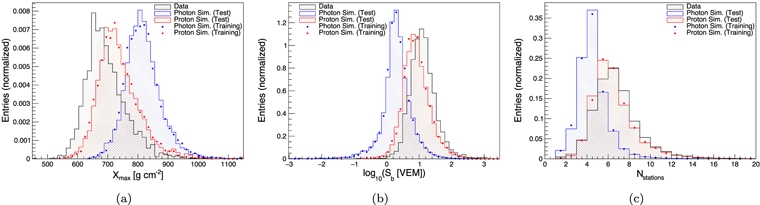
Figure 2. Normalized distributions of the three discriminating observables  , Sb
, and Nstations. The photon sample is shown in blue, the proton sample in red, and the data sample in black. Only events with Eγ
> 2 × 10¹⁷ eV are shown. The simulated samples are subdivided into a training sample used to train the MVA and a test sample used to determine the separation power of the individual observables. Note that for illustrative purposes and to facilitate the comparison of the data distributions to the ones obtained from the simulated samples, the latter were weighted with an
, Sb
, and Nstations. The photon sample is shown in blue, the proton sample in red, and the data sample in black. Only events with Eγ
> 2 × 10¹⁷ eV are shown. The simulated samples are subdivided into a training sample used to train the MVA and a test sample used to determine the separation power of the individual observables. Note that for illustrative purposes and to facilitate the comparison of the data distributions to the ones obtained from the simulated samples, the latter were weighted with an  spectrum instead of the
  one used in the MVA (see Section 4).
Download figure:
Standard image High-resolution imageTo combine the three discriminating observables, a multivariate analysis (MVA) is performed using the boosted decision tree (BDT) method as implemented by the TMVA package (Hoecker et al. 2007). To take into account energy and zenith angle dependencies, the photon energy Eγ and the zenith angle θ are also included in the MVA. The MVA is trained using two thirds of the simulated samples described before, while the remaining third is used to test the trained MVA for consistency and calculate the performance of the MVA with regard to photon/hadron separation. In Figure 2, the training and test subsamples are denoted by the markers and the shaded regions, respectively, for both the photon and the proton samples. In the training and testing stages of the MVA, events are weighted according to a power-law spectrum E−Γ with a spectral index Γ = 2, as in previous photon searches (see, e.g., Aab et al. 2017a).
The distribution of the output from the BDT β, which is used as the final discriminator for separating photon-induced air showers from the hadronic background, is shown in Figure 3 for both the simulated and the data samples (see also Section 5). The photon and proton distributions are clearly separated. The background rejection at a signal efficiency of 50%, i.e., the fraction of proton-induced events that have a β larger than the median of the photon (test sample) distribution—which is used as the photon candidate cut, marked with the dashed line in Figure 3)—is (99.87 ± 0.03)%, where the uncertainty has been determined through a bootstrapping method. When only events with Eγ
≥ 2 × 10¹⁷ eV are taken into account, the background rejection at 50% signal efficiency becomes (99.91 ± 0.03)%; hence, we expect a background contamination of (0.09 ± 0.03)%. For the size of the data sample given in Table 1 (2204 events), this would translate, under the assumption of a pure-proton background, to 1.98 ± 0.66 background events that are wrongly identified as photon candidate events. All of these numbers have been determined from the test samples (see above). Were the analysis to be based on  only, the background rejection at 50% signal efficiency would be 92.5%. The expected background contamination can therefore be reduced significantly by including the SD-related observables Sb
and Nstations.
only, the background rejection at 50% signal efficiency would be 92.5%. The expected background contamination can therefore be reduced significantly by including the SD-related observables Sb
and Nstations.
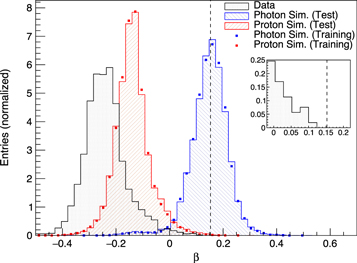
Figure 3. Normalized distributions of the final discriminator β. The photon sample is shown in blue, the proton sample in red, and the data sample in black. Only events with Eγ > 2 × 10¹⁷ eV are shown. The simulated samples are subdivided into a training sample used to train the MVA and a test sample used to determine the separation power of the full analysis. The dashed line denotes the median of the photon test sample, which is used as the photon candidate cut. The inlay shows a zoom on the data distribution around the photon candidate cut.
Download figure:
Standard image High-resolution image5. Results
Finally, we apply the analysis to the data sample to search for the presence of photon candidate events. The distributions of the three discriminating observables  , Sb
, and Nstations for the data sample are shown in Figure 2 together with the corresponding distributions for the simulated samples. In the following paragraphs, we briefly discuss these distributions.
, Sb
, and Nstations for the data sample are shown in Figure 2 together with the corresponding distributions for the simulated samples. In the following paragraphs, we briefly discuss these distributions.
The  distribution for the data sample is shifted toward smaller
  values compared to the proton distribution. This is in line with current Auger results on the composition of UHECRs: for example, in Yushkov & Pierre Auger Collaboration (2019), the
  values that were measured above 1017.2 eV are consistently below the expectation for primary protons, indicating a heavier composition. As the average
  is decreasing with increasing primary mass, a shift of the
  distribution for the data sample toward smaller values is expected. Similarly, a composition effect can be seen in the Sb
and Nstations distributions. As the lateral shower profile gets wider with increasing primary mass and the number of muons at ground level increases, more triggered SD stations are expected, on average, compared to primary protons (and consequently, primary photons), leading to higher values of Nstations, as well as a higher signal in these stations, which together with the higher multiplicity leads to larger Sb
values. Also the choice of the hadronic interaction model—here EPOS LHC—has an impact on the distributions obtained for the simulated samples, in particular the proton distributions. Furthermore, Aab et al. (2015b, 2016a) indicate a possible underestimation of the number of muons in simulations, which can also influence the distributions.
distribution for the data sample toward smaller values is expected. Similarly, a composition effect can be seen in the Sb
and Nstations distributions. As the lateral shower profile gets wider with increasing primary mass and the number of muons at ground level increases, more triggered SD stations are expected, on average, compared to primary protons (and consequently, primary photons), leading to higher values of Nstations, as well as a higher signal in these stations, which together with the higher multiplicity leads to larger Sb
values. Also the choice of the hadronic interaction model—here EPOS LHC—has an impact on the distributions obtained for the simulated samples, in particular the proton distributions. Furthermore, Aab et al. (2015b, 2016a) indicate a possible underestimation of the number of muons in simulations, which can also influence the distributions.
In the next step, the MVA is applied to the 2204 events from the data sample. The distribution of β obtained for the data sample is shown in Figure 3 and compared to the distributions for the simulated samples. As expected from the distributions of the individual observables, on average smaller, i.e., less photon-like, values of β for the data sample than for the proton sample are found.
Finally, we use the distribution of β for the data sample to identify photon candidate events. As in Aab et al. (2017a), we use a photon candidate cut fixed to the median of the photon (test sample) distribution in the energy range Eγ
> 2 × 10¹⁷ eV, which is shown in Figure 3 as a dashed line. Zero events from the data sample have a β value above the candidate cut value; hence, no photon candidate events are identified. When looking at the events closest to the candidate cut, it can be noticed that their Sb
values are located toward the photon-like tail of the distribution for primary protons at the respective energies, typically at 1.5–2 standard deviations from the corresponding mean values for protons. Their  values, however, are usually within 1 standard deviation from the corresponding average for protons. Regarding Nstations, a similar behavior as for Sb
is found. In the combination of the individual observables in the MVA, the resulting value of β is below the photon candidate cut.
values, however, are usually within 1 standard deviation from the corresponding average for protons. Regarding Nstations, a similar behavior as for Sb
is found. In the combination of the individual observables in the MVA, the resulting value of β is below the photon candidate cut.
We calculate the final results of this study in terms of upper limits on the integral flux of photons  , where C.L. denotes the confidence level at which we determine the upper limits.
  is calculated according to
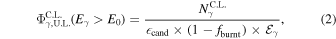
where  is the upper limit on the number of photon candidate events at the given confidence level calculated using the Feldman–Cousins approach (Feldman & Cousins 1998) with no background subtraction,
  cand is the efficiency of the photon candidate cut, fburnt is the fraction of the data used as a burnt sample, and
  is the integrated efficiency-weighted exposure for photons (see also Table 2).
  is calculated from simulations as
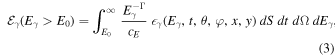
where γ
(Eγ
, t, θ, φ, x, y) is the overall efficiency for photons—excluding the final photon candidate cut—depending on the photon energy Eγ
, the time t, the zenith angle θ, the azimuth angle φ, and the coordinates x and y of the impact point of the air shower on the ground. The integration is performed over the area S, the time t, the solid angle Ω, and the photon energy Eγ
. The normalization factor cE
is calculated through

Table 2. Upper Limits on the Integral Photon Flux, Determined at 95% C.L., Calculated Using Equation (2)
| E0 [eV] | Nevents | Nγ |

|
cand
| 1 − fburnt |

|
|
|---|---|---|---|---|---|---|---|
| 2 × 10¹⁷ | 2,204 | 0 | 3.095 | 0.50 | 0.96 | 2.38 | 2.72 |
| 3 × 10¹⁷ | 1,112 | 0 | 3.095 | 0.48 | 0.96 | 2.69 | 2.50 |
| 5 × 10¹⁷ | 333 | 0 | 3.095 | 0.45 | 0.94 | 2.68 | 2.74 |
| 1018 | 67 | 0 | 3.095 | 0.38 | 0.94 | 2.41 | 3.55 |
Note. See the text for explanations.
Download table as: ASCIITypeset image
The result of the integration following Equation (3) with a spectral index Γ = 2 is shown in Figure 4. In the energy range of interest between 2 × 10¹⁷ and 1018 eV, the weighted exposure varies between 2.4 and 2.7 km2 yr sr, with a maximum at 3.5 × 10¹⁷ eV. Toward lower energies, the exposure becomes smaller because lower-energy air showers trigger the detector with reduced efficiency. Toward higher energies, the dominant cause for the decrease in exposure is the event selection, because showers where  is reconstructed to be below the field of view of the telescopes are excluded from the analysis (see Section 3).
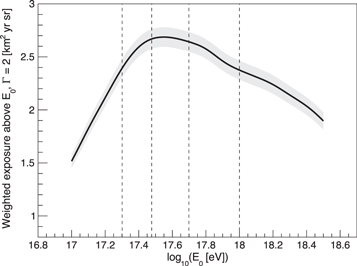
Figure 4. Integrated efficiency-weighted hybrid exposure for photons, calculated from simulations following Equation (3) under the assumption Γ = 2, with the statistical uncertainties shown as a gray band. The dashed lines denote the energy thresholds at which upper limits on the integral photon flux are placed in this analysis.
Download figure:
Standard image High-resolution imageWe place upper limits on the integral photon flux  at threshold energies of 2, 3, and 5 × 10¹⁷ eV, as well as 1018 eV, at a confidence level of 95%. At these threshold energies, the upper limits are 2.72, 2.50, 2.74, and 3.55 km−2 yr−1 sr−1, respectively. The quantities needed to calculate the upper limits according to Equation (2) are listed in Table 2. For completeness, we also calculated upper limits at a confidence level of 90%, as used e.g., in Apel et al. (2017) and Fomin et al. (2017). The upper limits in this case are 2.15, 1.97, 2.16, and 2.79 km−2 yr−1 sr−1 at the same threshold energies. Using the energy spectrum of cosmic rays measured by the Pierre Auger Observatory (Abreu et al. 2021), the upper limits on the integral photon flux can be translated into upper limits on the integral photon fraction. At a confidence level of 95%, these are 0.28, 0.63, 2.20, and 13.8% for the same threshold energies as above.
To assess the impact on the final results of the choice of hadronic interaction models and of the assumptions on the composition of primary cosmic rays, smaller samples of proton-induced air showers simulated with the hadronic interaction models QGSJET-II-04 (Ostapchenko 2011) and SIBYLL 2.3c (Fedynitch et al. 2019) and of air showers induced by iron nuclei, simulated with EPOS LHC, have been used. Each of these samples contains 30,000 air-shower events. The analysis has been repeated replacing the default background sample (primary protons simulated with EPOS LHC) by primary protons simulated with QGSJET-II-04 and SIBYLL 2.3 c and with a mixture of 50% primary protons and 50% primary iron nuclei (both simulated with EPOS LHC). In all cases, no photon candidate events were identified in the data sample, indicating that the analysis is robust against these assumptions. Likewise, varying the spectral index Γ from 2 to, e.g., 1.5 or 2.5, and repeating the analysis does not change the observed number of photon candidates (0). It should be taken into account, however, that Γ also enters the calculation of the weighted exposure, leading to a change in the final upper limits by, on average, 5%. Finally, we studied the impact of possible systematic uncertainties in the measurement of the observables. Changing the  values of all events in the data sample by ±10 g cm−2 (Bellido & Pierre Auger Collaboration 2017) does not change the number of photon candidate events. Likewise, changing the Sb
values of all events in the data sample by ±5% (Aab et al. 2017a) has no effect on the number of photon candidate events. These tests show that the analysis is also robust against systematic uncertainties in the measured observables.
values of all events in the data sample by ±10 g cm−2 (Bellido & Pierre Auger Collaboration 2017) does not change the number of photon candidate events. Likewise, changing the Sb
values of all events in the data sample by ±5% (Aab et al. 2017a) has no effect on the number of photon candidate events. These tests show that the analysis is also robust against systematic uncertainties in the measured observables.
6. Discussion and Conclusions
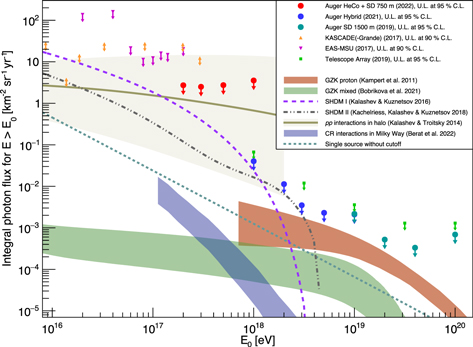
The upper limits on the integral photon flux derived in the previous section are shown in Figure 5, together with the results of other photon searches with energy thresholds ranging from 1016–1020 eV. In the energy region below 1018 eV, the limits obtained in this study are the most stringent ones, improving previous limits from KASCADE-Grande (Apel et al. 2017) and EAS-MSU (Fomin et al. 2017) by up to an order of magnitude. The analysis presented here extends the energy range of photon searches at the Pierre Auger Observatory and complements previous analyses in the energy range above 1019 eV (Rautenberg & Pierre Auger Collaboration 2019) and between 1018 and 1019 eV (Savina & Pierre Auger Collaboration 2021), closing the gap to the smaller air-shower experiments mentioned before. For a threshold energy of 1018 eV, the upper limit determined in this analysis is about two orders of magnitude above the previous limit from Savina & Pierre Auger Collaboration (2021), which is due mainly to the smaller exposure, which in turn is a consequence of the smaller size of the 750 m SD array compared to the full array. Overall, the Pierre Auger Observatory now provides the most stringent limits on the incoming UHE photon flux over three decades in energy. This set of upper limits allows us to draw some conclusions relevant to the astrophysics of UHECRs and beyond, which we now discuss.
Figure 5. Upper limits (at 95% C.L.) on the integral photon flux above 2 × 10¹⁷ eV determined here (red circles). Shown are also previous upper limits by various experiments: Pierre Auger Observatory (hybrid: blue circles, taken from Savina & Pierre Auger Collaboration 2021; SD: cyan circles, taken from Rautenberg & Pierre Auger Collaboration 2019), KASCADE/KASCADE-Grande (orange triangles, taken from Apel et al. 2017), EAS-MSU (magenta diamonds, taken from Fomin et al. 2017), and Telescope Array (green squares, taken from Abbasi et al. 2019). The red band denotes the range of expected GZK photon fluxes under the assumption of a pure-proton scenario (Kampert et al. 2011). The green band shows the expected GZK photon flux assuming a mixed composition that would fit the Auger data (Bobrikova et al. 2021). In addition, the expected photon fluxes from the decay of SHDM particles are included (decay into hadrons: dashed violet line, based on Kalashev & Kuznetsov 2016; decay into leptons: dotted–dashed gray line, based on Kachelriess et al. 2018; the exact lines have been obtained through personal communication with one of the authors). The photon fluxes that would be expected from pp interactions in the Galactic halo (Kalashev & Troitsky 2014, olive-green line) or from cosmic-ray interactions with matter in the Milky Way (Bérat et al. 2022, blue band) are shown as well. Also included is the expected flux of photons from a single, putative source without a cutoff in its spectrum (dotted turquoise line, modeled after HAWC J1825-134, Albert et al. 2021, where we extrapolated the measured flux to the highest energies), ignoring its directionality as if its flux were distributed over the full sky.
Download figure:
Standard image High-resolution image
A guaranteed flux of UHE photons of cosmogenic origin is that resulting from interactions of UHECRs with the background photon fields permeating the universe, most notably the cosmic microwave background (Greisen 1966; Zatsepin & Kuzmin 1966). This flux is much reduced relative to that of UHECRs due to, as pointed out in the introduction, the short photon horizon (a few hundred kiloparsecs) compared to the cosmic-ray one (from a few tens of megaparsecs above the GZK threshold to cosmological scales below). Although guaranteed, the precise knowledge of this flux suffers from several uncertainties. The production channel of these photons is the decay of π0 mesons. The hadrons that cause the creation of these mesons may be primary proton cosmic rays, or secondary ones mainly produced by the photodisintegration of nuclei interacting inelastically with a cosmic background photon. Since the nucleons produced in a photodisintegration reaction inherit the energy of the fragmented nucleus divided by its atomic number, the photons ultimately produced from primary heavy nuclei are of lower energies than those from lighter ones or from proton primaries. The photon flux, therefore, depends on the nature of the UHECRs, which remains poorly constrained above about 5 × 10¹⁹ eV. The expectation for a pure-proton scenario is shown as the red band in Figure 5 (Kampert et al. 2011), while that for a mixed composition at the sources is shown as the green band (Bobrikova et al. 2021). The latter, which is an order of magnitude lower than the former and falls off much faster, is in agreement with the various constraints inferred from the data collected at the Observatory, namely, the mass composition and the energy spectrum (Aab et al. 2017b). Other dependencies that explain the width of the bands come from the hypotheses on the maximum acceleration energy of the nuclei at the sources and on the shape of the energy spectrum of the accelerated particles. Overall, while the sensitivities reached above about 3 × 10¹⁸ eV approach the most optimistic expectations of the cosmogenic photon flux from protons, they are about 1.5 orders of magnitude above those from the mixed-composition model.
Another cosmogenic flux is that from the interactions of UHECRs with the matter traversed in the Galactic plane, which is larger than the aforementioned one below about 1018 eV (Bérat et al. 2022). Shown in blue, the width of the band accounts for uncertainties arising from the distribution of the gas in the disk, the absolute level of the UHECR flux, and the mass composition. The limits obtained in this study improve previous ones in the energy range of interest to probe such a flux; yet they remain between two and three orders of magnitude above the expectations.
The cosmogenic fluxes just mentioned can be seen as floors above which increased sensitivity to photons could reveal unexpected phenomena. To exemplify such a potential, we explain below the four curves that correspond to fluxes from putative sources in the Galactic disk or to patterns that could emerge from proton-proton interactions in the halo of the Galaxy or from the decay of SHDM.
The recent observation of photons above 2 × 10¹⁴ eV from decaying neutral pions from the J1825-134 source reported in Albert et al. (2021), in a direction coincident with a giant molecular cloud, provides evidence that cosmic rays are indeed accelerated to energies of several 1015 eV, and above, in the Galaxy. Interestingly, the flux of this source could extend well beyond 2 × 10¹⁴ eV, as no cutoff is currently observed in its energy spectrum measured up to this energy. As an example of the discovery potential with increased exposure, we show as the green curve the flux from such a putative source extrapolated to the highest energies. Note that this flux, which is directional in essence, is here for simplicity calculated by converting it to a diffuse one, assuming the flux was distributed over the full sky. We observe that the extrapolated flux for this source is higher than the cosmogenic ones below 1018 eV. The upper limits determined here exceed the extrapolated flux of this single, specific source by two orders of magnitude. They nevertheless limit the effective number of similar sources in the Galaxy. Improved tests of the abundance of such putative sources will be possible by further increasing the sensitivity of photon searches in this energy region or decreasing the energy threshold.
The origin of the bulk of the high-energy neutrino flux observed at the IceCube observatory (see, e.g., Aartsen et al. 2020) is still debated. However, their production mechanism is conventionally considered as that of high-energy hadronic or photohadronic interactions that create charged pions decaying into neutrinos. These same interactions produce neutral pions that decay into photons. Therefore, there is an expected connection between high-energy photons and high-energy neutrinos. Since the horizon of photons is much smaller than that of neutrinos, they can trace the local sources in a way that could facilitate the differentiation between different scenarios. In Figure 5, we reproduce in olive green the expectations for cosmic-ray interactions with the hot gas filling the outer halo of the Galaxy up to hundreds of kiloparsecs, as estimated in Kalashev & Troitsky (2014) by requiring that this photon flux is the counterpart of the neutrino one. The width of the band reflects the uncertainties in the spectral shape of the neutrino flux. We observe that the limits derived in this study are already constraining.
Finally, UHE photons could also result from the decay of SHDM particles. We note that previous upper limits on the incoming photon flux already severely constrained non-acceleration models in general, and SHDM models in particular, trying to explain the origin of cosmic rays at the highest energies (see, e.g., Abraham et al. 2008; Aab et al. 2017a). Still, the production of super-heavy particles in the early universe remains a possible solution to the dark matter conundrum because of the high value of the instability energy scale in the Standard Model of particle physics, which, according to current measurements of the Higgs-boson mass and the Yukawa coupling of the top quark, ranges between 1010 and 1012 GeV (Degrassi et al. 2012; Bednyakov et al. 2015). The Standard Model can, therefore, be extrapolated without encountering inconsistencies that would make the electroweak vacuum unstable up to such energy scales (and even to much higher ones given the slow evolution of the instability scale up to the Planck mass (Degrassi et al. 2012)), where new physics could arise, giving rise to a mass spectrum of super-heavy particles that could have been produced during post-inflation reheating by various mechanisms (see, e.g., Ellis et al. 1992; Berezinsky et al. 1997; Chung et al. 1998; Ellis et al. 2016; Garny et al. 2016; Dudas et al. 2017; Kaneta et al. 2019; Mambrini & Olive 2021). The set of limits shown in Figure 5 allows for constraining the phase space of mass and lifetime of the SDHM particles (see, e.g., Kalashev & Kuznetsov 2016; Kachelriess et al. 2018; Bérat et al. 2022). To illustrate the discovery potential with searches for UHE photons, we show as the dashed violet line and the dotted–dashed gray line the expected photon fluxes in the case of hadronic (Kalashev & Kuznetsov 2016) and leptonic (Kachelriess et al. 2018) decay channels, respectively. For these lines, we assume that the mass MX of the SHDM particles is 1010 GeV and their lifetime τX is 3 × 10²¹ yr, as currently allowed by previous limits. As the sensitivity of current photon searches increases, it will be possible to further constrain these values (Anchordoqui et al. 2021).
Further improvements of the upper limits derived in this analysis can be expected not only from using a larger data set, profiting from the constant increase in exposure over time, but also from the ongoing detector upgrade of the Pierre Auger Observatory, dubbed AugerPrime (Castellina & Pierre Auger Collaboration 2019; Aab et al. 2016b). A major part of this upgrade is the installation of scintillation detectors on top of the water-Cherenkov detector stations of the SD, with the aim of better separating the muonic and electromagnetic components of an air shower. Current photon searches already exploit the differences in these components between photon- and hadron-induced air showers, albeit in a rather indirect way. AugerPrime will allow for a more direct access, which will lead to an overall better separation between photon-induced air showers and the vast hadronic background. Naturally, this upgrade will improve the upper limits on the incoming photon flux or, in the best case, lead to the unambiguous detection of photons at UHEs.
The successful installation, commissioning, and operation of the Pierre Auger Observatory would not have been possible without the strong commitment and effort from the technical and administrative staff in Malargüe. We are very grateful to the following agencies and organizations for financial support:
Argentina—Comisión Nacional de Energía Atómica; Agencia Nacional de Promoción Científica y Tecnológica (ANPCyT); Consejo Nacional de Investigaciones Científicas y Técnicas (CONICET); Gobierno de la Provincia de Mendoza; Municipalidad de Malargüe; NDM Holdings and Valle Las Leñas; in gratitude for their continuing cooperation over land access; Australia—the Australian Research Council; Belgium—Fonds de la Recherche Scientifique (FNRS); Research Foundation Flanders (FWO); Brazil—Conselho Nacional de Desenvolvimento Científico e Tecnológico (CNPq); Financiadora de Estudos e Projetos (FINEP); Fundação de Amparo à Pesquisa do Estado de Rio de Janeiro (FAPERJ); São Paulo Research Foundation (FAPESP) grant Nos. 2019/10151-2, 2010/07359-6, and 1999/05404-3; Ministério da Ciência, Tecnologia, Inovações e Comunicações (MCTIC); Czech Republic—grant Nos. MSMT CR LTT18004, LM2015038, LM2018102, CZ.02.1.01/0.0/0.0/16_013/0001402, CZ.02.1.01/0.0/0.0/18_046/0016010, and CZ.02.1.01/0.0/0.0/17_049/0008422; France—Centre de Calcul IN2P3/CNRS; Centre National de la Recherche Scientifique (CNRS); Conseil Régional Ile-de-France; Département Physique Nucléaire et Corpusculaire (PNC-IN2P3/CNRS); Département Sciences de l'Univers (SDU-INSU/CNRS); Institut Lagrange de Paris (ILP) grant No. LABEX ANR-10-LABX-63 within the Investissements d'Avenir Programme grant No. ANR-11-IDEX-0004-02; Germany—Bundesministerium für Bildung und Forschung (BMBF); Deutsche Forschungsgemeinschaft (DFG); Finanzministerium Baden-Württemberg; Helmholtz Alliance for Astroparticle Physics (HAP); Helmholtz-Gemeinschaft Deutscher Forschungszentren (HGF); Ministerium für Innovation, Wissenschaft und Forschung des Landes Nordrhein-Westfalen; Ministerium für Wissenschaft, Forschung und Kunst des Landes Baden-Württemberg; Italy—Istituto Nazionale di Fisica Nucleare (INFN); Istituto Nazionale di Astrofisica (INAF); Ministero dell'Istruzione, dell'Universitá e della Ricerca (MIUR); CETEMPS Center of Excellence; Ministero degli Affari Esteri (MAE); México—Consejo Nacional de Ciencia y Tecnología (CONACYT) No. 167733; Universidad Nacional Autónoma de México (UNAM); PAPIIT DGAPA-UNAM; The Netherlands—Ministry of Education, Culture and Science; Netherlands Organisation for Scientific Research (NWO); Dutch national e-infrastructure with the support of SURF Cooperative; Poland—Ministry of Education and Science, grant No. DIR/WK/2018/11; National Science Centre, grants Nos. 2016/22/M/ST9/00198, 2016/23/B/ST9/01635, and 2020/39/B/ST9/01398; Portugal—Portuguese national funds and FEDER funds within Programa Operacional Factores de Competitividade through Fundação para a Ciência e a Tecnologia (COMPETE); Romania—Ministry of Research, Innovation and Digitization, CNCS/CCCDI—UEFISCDI, projects PN19150201/16N/2019, PN1906010, TE128, and PED289, within PNCDI III; Slovenia—Slovenian Research Agency, grant Nos. P1-0031, P1-0385, I0-0033, and N1-0111; Spain—Ministerio de Economía, Industria y Competitividad (FPA2017-85114-P and PID2019-104676GB-C32), Xunta de Galicia (ED431C 2017/07), Junta de Andalucía(SOMM17/6104/UGR, P18-FR-4314) Feder Funds, RENATA Red Nacional Temática de Astropartículas (FPA2015-68783-REDT) and María de Maeztu Unit of Excellence (MDM-2016-0692); USA—Department of Energy, Contracts Nos. DE-AC02-07CH11359, DE-FR02-04ER41300, DE-FG02-99ER41107, and DE-SC0011689; National Science Foundation, grant No. 0450696; The Grainger Foundation; Marie Curie-IRSES/EPLANET; European Particle Physics Latin American Network; and UNESCO.