


Abstract
A kilonova, the electromagnetic emission produced by compact binary mergers, is formed through a delicate interplay of physical processes, involving r-process nucleosynthesis and interactions between heavy elements and photons through radiative transfer. This complexity makes it difficult to achieve a comprehensive understanding of kilonova spectra. In this study, we aim to enhance our understanding and establish connections between physical parameters and observables through radiative-transfer simulations. Specifically, we investigate how ejecta temperature and element mass influence the resulting kilonova spectrum. For each species, the strength of its line features depends on these parameters, leading to the formation of a distinct region in the parameter space, dubbed the resonance island, where the line signature of that species is notably evident in the kilonova spectrum. We explore its origin and applications. Among explored r-process elements (31 ≤ Z ≤ 92), we find that four species—SrII, YII, BaII, and CeII—exhibit large and strong resonance islands, suggesting their significant contributions to kilonova spectra at specific wavelengths. In addition, we discuss potential challenges and future perspectives in observable heavy elements and their masses in the context of the resonance island.
Export citation and abstract BibTeX RIS

Original content from this work may be used under the terms of the Creative Commons Attribution 4.0 licence. Any further distribution of this work must maintain attribution to the author(s) and the title of the work, journal citation and DOI.
1. Introduction
The kilonova spectrum emerges as a consequence of intricate physical processes and interactions associated with the merging of two neutron stars or a neutron star and a black hole, along with subsequent outflows, including dynamical and disk-wind ejecta (see Metzger 2019 and Barnes 2020 for the recent review of kilonovae). The merging process initiates r-process nucleosynthesis, followed by consequential interactions between the produced heavy elements and a flood of photons resulting from radioactive decay. Within the ejecta, these interactions give rise to distinct spectral lines in the kilonova spectrum. The complexity inherent in these processes poses a challenge, making it difficult to standardize or establish a uniform pattern for the kilonova spectrum.
While understanding the entire kilonova process with sophisticated yet computationally intensive magnetohydrodynamic simulations of a binary merger is demanding, the cause-and-effect relationships within the radiative-transfer process offer a potentially more accessible path for investigation. Although not fully explored, this approach also holds significant potential for shedding light on kilonova physics. For example, vigorous studies on AT2017gfo (e.g., Kasen et al. 2017; Perego et al. 2017; Siegel & Metzger 2017; Tanaka et al. 2017; Radice et al. 2018; Ford et al. 2024; Vieira et al. 2024) highlighted the key role of Ye in shaping the spectrum, with higher Ye generally leading to bluer spectra. However, the full parameter space of Ye and its impact remains largely unexplored.
The kilonova spectrum from the radiative-transfer process is shaped by the complicated interplay of ejecta properties, such as electron fraction (Ye ), velocity and density profiles, and temperature. These parameterized ejecta configurations have been widely studied (e.g., Tanaka & Hotokezaka 2013; Kasen et al. 2017; Even et al. 2020; Bulla et al. 2021; Gillanders et al. 2022, 2024; Wu et al. 2022; Fontes et al. 2023; Shingles et al. 2023; Sneppen et al. 2023; Tak et al. 2023; Fryer et al. 2024). In Tak et al. (2023), we delved into the influence of diverse ejection histories on the development of kilonova spectra and their associated light curves. Specifically, we introduced representative velocity profiles of ejecta and explored how features in each velocity profile leave their imprints on both the kilonova spectrum and the light curve. Fryer et al. (2024) also conducted a study with a similar focus, aiming to understand the impact of velocity distribution on light curves and spectra. As discussed by Shingles et al. (2023) and Collins et al. (2023), line transitions by SrII commonly occur at the front end of the expanding line-forming region with higher velocities. This indicates a connection between the strength of line transitions and the velocity profile of the ejecta. The role of ejecta mass and its velocity was also emphasized by Fontes et al. (2023).
Other than the ejecta mass and velocity, various properties of kilonovae have been widely studied. For example, the influence of different compositions and their opacities on the shape of a kilonova spectrum has been widely investigated (e.g., Even et al. 2020; Tanaka et al. 2020; Fontes et al. 2023). Korobkin et al. (2021) examined various morphologies of kilonovae and their impact on the light curve. Additionally, Sneppen et al. (2023) discussed the relationship between the electron density in the ejecta and the strength of the SrII line feature.
In conjunction with these efforts, in this study, our goal is to illustrate how the strength and occurrence of line transitions change with the ejecta temperature and element mass. Details on the parameterized configurations of the ejecta model are provided in Section 2. We perform a radiative-transfer spectral analysis for the specified parameter spaces, and the results are presented in Section 3. In Section 4, we discuss the results and their implications, while Section 5 provides a summary of our findings.
2. Model Configuration
We conduct radiative-transfer spectral analysis across diverse kilonova ejecta conditions using tardis (Kerzendorf & Sim 2014; Kerzendorf et al. 2023). This 1D Monte Carlo radiative-transfer spectral synthesis code has been employed extensively to simulate kilonova spectra (e.g., Smartt et al. 2017; Watson et al. 2019; Gillanders et al. 2021, 2022; Perego et al. 2022; Tak et al. 2023). The basic mechanisms for how tardis generates synthetic spectra are summarized below, but for full details, see Kerzendorf & Sim (2014) or the online documentation. 4
First, tardis defines a completely opaque, optically thick inner boundary, that emits a single-temperature blackbody. This opaque inner region is surrounded by an envelope of less opaque material, discretized into shells. These shells represent the computational domain, or line-forming region, of the simulation. 5 The code initializes a (user-defined) number of radiation packets, or r-packets (analogous to bundles of photons), at the surface of this photosphere (i.e., the inner boundary of the computational domain).
The simulation begins with the r-packets randomly assigned both a propagation direction, and a frequency sampled from a (single-temperature) blackbody distribution, and they freely stream through the computational volume until they interact. These r-packets can interact either via free-electron scattering, or some line interaction with a species (an atom or ion) present in the ejecta. When an interaction is triggered, a new propagation direction is assigned, and the r-packet continues along its path.
The propagation of these r-packets continues until they have all either escaped the outer boundary of the envelope (i.e., the outer boundary of the computational domain) or scattered beneath the photosphere. The properties of the escaping r-packets are then used to compute a synthetic spectrum. Each r-packet can undergo many interactions, depending on the specific model properties, but only the final interaction contributes to the synthetic spectrum. 6
By tracking the interaction history of r-packets, tardis is capable of estimating the effective contributions of different species present in the line-forming region of the simulation to the emergent synthetic spectrum. The final synthetic spectrum will be composed of contributions from emergent r-packets that, in the line-forming region, either (1) did not undergo any interaction, (2) scattered with a free electron, or (3) underwent a line interaction with some species.
The properties of the ejecta material within the line-forming region (e.g., density, temperature, composition) are all governed by user-defined inputs. The following describes the model configurations for this simulation study.
First, the velocity profile of the ejecta, represented as a function of ejection time τ, is assumed to be

where  .
7
The constant τ0 is determined by setting
.
7
The constant τ0 is determined by setting  and
and  , resulting in

where the ejection duration τd
is set to 100 ms (Dessart et al. 2009; Perego et al. 2014; Kasen et al. 2017; Radice et al. 2018), and vmin and vmax are the ejecta velocities at the inner and outer boundaries of the line-forming region, respectively. In this simulation study, they are fixed at 0.08c and 0.35c, respectively (Hotokezaka et al. 2013; Siegel & Metzger 2017; Radice et al. 2018; Wollaeger et al. 2019; Rosswog et al. 2022). The velocity and its derivative profiles are presented in Figure 1. For a constant mass ejection rate,  , the incorporation of this velocity profile into the continuity equation for stationary coasting shells provides (Equation (38) in Uhm 2011; see also Tak et al. 2023)

where ρ0 is the normalization constant, and t is the time since the explosion. This profile finds widespread adoption in kilonova studies (e.g., Tanaka et al. 2017; Watson et al. 2019; Gillanders et al. 2022). We assume a photospheric radius of rph = 1015 cm from the center of the explosion (see Drout et al. 2017 for the estimates of the photospheric radius of AT2017gfo) and its velocity of vph = 0.16c, which gives the observation time of t = rph/vph ≈ 2.4 days after the explosion. The bolometric luminosity of the photosphere is assumed to be  , where σR denotes the Stefan–Boltzmann constant. We emphasize that the velocity and density profiles are crucial factors influencing the resulting kilonova spectrum (Tak et al. 2023). Despite their significance, we adhere to employing the simple profile (Equation (3)) throughout the entire simulation to focus on the impact of ejecta temperature and element mass.

Figure 1. Ejecta velocity and its derivative profiles. The upper panel displays the velocity profile (Equation (1)), while the lower panel illustrates its derivative. Mass ejection is assumed to continue for up to 100 ms, with minimum and maximum velocities of 0.08c and 0.35c, respectively.
Download figure:
Standard image High-resolution imageOther than the aforementioned considerations, we adopt the configuration utilized by Tak et al. (2023), including the selection of atomic data set, plasma treatment methods, and abundance. The atomic data set is compiled from extensive sources including Chianti, Kurucz, and DREAM, among others (Dere et al. 1997; Biémont et al. 1999; Kurucz 2017, 2018; Quinet & Palmeri 2020; Del Zanna et al. 2021; Gillanders et al. 2021; McCann et al. 2022; Bromley et al. 2023; see Tak et al. 2023, for details). For the tardis plasma setup, we adopt the special relativity treatment in radiative transfer (Vogl et al. 2019). We utilize the local thermal equilibrium (LTE) approximation for ionization, while excitation follows the dilute-LTE approach. Line interactions are addressed with the macroatom approach (Lucy 2002, 2003), encompassing fluorescence effects and multiple internal line transitions. Lastly, we adopt the solar system r-process composition, estimated by Prantzos et al. (2020), for elements from Gallium (Z = 31) to Uranium (Z = 92). Among 49 heavy elements considered in this analysis, the mass fractions of 11 selected elements are listed in Table 1. These elements are identified as the most active contributors to the kilonova spectrum in this simulation (see Section 3.3). We stress that our results are highly dependent on the relative abundance of elements (see Section 4.1), and as a result, the strength of some features observed in AT2017gfo can be underestimated in this analysis, e.g., CeIII (Domoto et al. 2021).
Table 1. Solar r-process Abundance for 11 Selected Elements, Adopted from Prantzos et al. (2020)
| Element | Sr | Y | Zr | Ba | La | Ce | Pr | Nd | Tb | Dy | Ho |
|---|---|---|---|---|---|---|---|---|---|---|---|
| Atomic number (Z) | 38 | 39 | 40 | 56 | 57 | 58 | 59 | 60 | 65 | 66 | 67 |
| Mass fraction | 1.00 | 0.54 | 1.06 | 0.39 | 0.08 | 0.14 | 0.07 | 0.28 | 0.05 | 0.33 | 0.08 |
Note. The selection is based on their contributions to the spectrum, where the listed elements contribute more than 3% of the total bolometric luminosity at some temperature and ejecta mass (see Section 3.3 and Figure 5). Note that we renormalize the mass fraction with respect to the mass of Sr by setting the mass fraction of Sr to 1. Lanthanides are elements with atomic numbers, 58 ≤ Z ≤ 71.
Download table as: ASCIITypeset image
In this study, we vary the ejecta mass in the line-forming region from 3 × 10⁻⁶ M⊙ to 0.3 M⊙ by changing the normalization constant ρ0 and its temperature from 2000 to 8400 K, while keeping other configurations fixed. 8 These ranges are selected based on the results from hydrodynamic simulations and observations of AT2017gfo. The total ejecta mass is expected to be around 10−4–10−2 M⊙ for the dynamical ejecta (e.g., Bauswein et al. 2013; Hotokezaka et al. 2013; Abbott et al. 2017; Radice et al. 2018; Kullmann et al. 2022) and 10−2–10−1 M⊙ for the disk-wind ejecta (e.g., Perego et al. 2014; Cowperthwaite et al. 2017; Siegel & Metzger 2017; Villar et al. 2017). Since the total ejecta mass of the system (Mtot) is the sum of the mass beneath the photosphere (Mph) and the ejecta mass in the line-forming region (Mej), we adopt a wider mass range in this simulation. For the assumed ejecta velocity profile with the ejection time of 100 ms (Equation (1)), Mej is approximately half of Mtot (Mej/Mtot ≃ 0.53). The temperature of AT2017gfo decreases from 6000 to 2500 K, from 1 to 5 days after the explosion (see Waxman et al. 2018).
Hereafter, "ejecta mass" refers specifically to the ejecta mass within the line-forming region, because this radiative-transfer simulation is not sensitive to the mass beneath the photosphere.
3. Results
3.1. Overall Bolometric Luminosity
We synthesize more than 2000 kilonova spectra with various combinations of ejecta mass (Mej) and temperature (T), and calculate the bolometric luminosity (LBol) across wavelengths ranging from 3000 to 25000 Å in the unit of erg s−1. The overall contribution from line transitions for all the species under consideration is denoted as LLT. It is calculated as the sum of LBol,s,  LBol,s, where LBol,s represents the contribution to the bolometric luminosity from each species. This value is derived by summing the luminosities of photon packets whose last interaction involves that particular species.
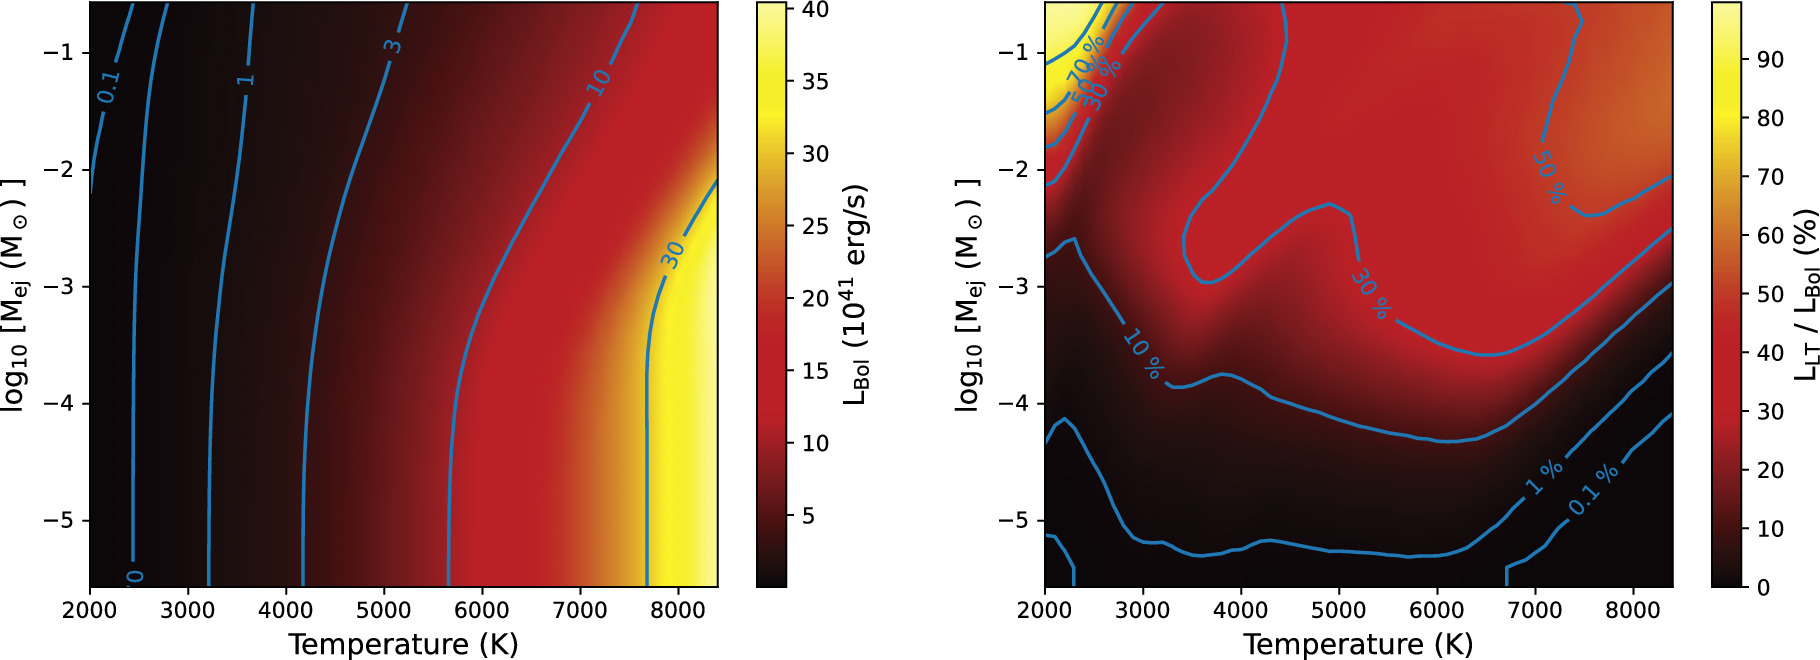
Figure 2 shows the bolometric luminosity LBol (left panel) and the overall contribution of line transitions to the kilonova spectrum LLT/LBol (right panel). Since the photospheric bolometric luminosity Lph increases with temperature, it is expected that the bolometric luminosity LBol will also increase with temperature. On the other hand, for a given temperature, an increase in Mej reaches a point where LBol starts to decrease. This decrease occurs because some photon packets are scattered beneath the photosphere, and thus fail to escape the line-forming region. As evident in the right panel, the contribution of a line transition to the kilonova spectrum is inherently proportional to the ejecta mass. The contour displays a distinctive undulating pattern, particularly prominent in the 30% and 50% contours, indicating a significant dependence of the line-transition strength on the ejecta mass and temperature. This undulating feature is a result of the line-transition features of particular heavy elements (e.g., SrII, YII, and lanthanides) and their ionization states (see Section 3.3).

Figure 2. Bolometric luminosity and the relative contribution from line transitions. The left panel displays the bolometric luminosity with contours (blue lines) observed in wavelengths ranging from 3000 to 25000 Å. The right panel shows the line-transition contribution, which represents the ratio of the bolometric luminosity of emitted photons interacting with heavy elements to the total bolometric luminosity.
Download figure:
Standard image High-resolution imageIn Figure 3, the stacked spectral energy distribution (SED) is depicted, with each SED plotted along the x–z direction. In the left panel, at a temperature of 3500 K, the brightest wavelength of the SED changes with increasing ejecta mass. When the ejecta mass surpasses 10−3 M⊙, emissions at wavelengths below 8000 Å tend to diminish due to numerous line transitions from various species, resulting in optically thick ejecta at these wavelengths. Instead, above this mass, a clear SrII triplet signature is observed at the wavelength around 11000 Å consistent with the observations of AT2017gfo (see, e.g., Watson et al. 2019; Domoto et al. 2021; Gillanders et al. 2022; Perego et al. 2022). In the right panel, at a temperature of 6000 K, the luminosities at lower wavelengths (< 8000 Å) are again diminished as the ejecta mass increases. This decrease is attributed to strong transitions of doubly ionized lanthanides (e.g., PrIII and NdIII; see Section 3.3).
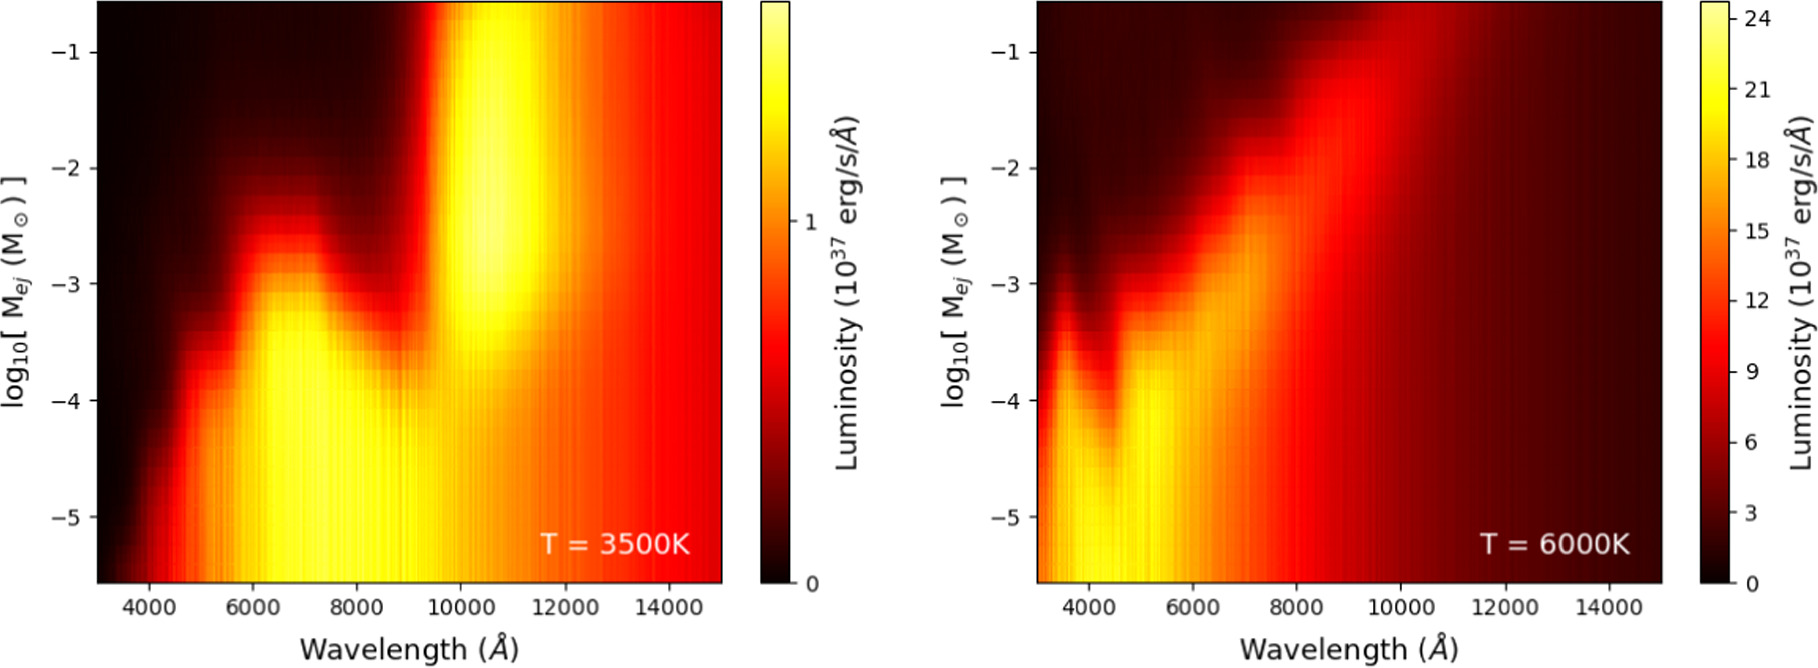
Figure 3. Spectral energy distributions at temperatures 3500 (left) and 6000 K (right) for various ejecta masses in the line-forming region. Each spectrum obtained from a given ejecta mass is plotted along the x–z direction.
Download figure:
Standard image High-resolution image3.2. Luminosity Fraction from Individual Elements
We examine the bolometric luminosity of each species (LBol,s), its relative contribution to the total bolometric luminosity (LBol,s/LBol), and the mass of each species for a given ejecta mass and temperature. Here we caution that LBol,s does not correspond to some quantity of radiation produced by a given species. Instead, it is simply a derived quantity from our synthetic spectra that corresponds to the amount of emergent radiation from our tardis simulations that last interacted with a given species.
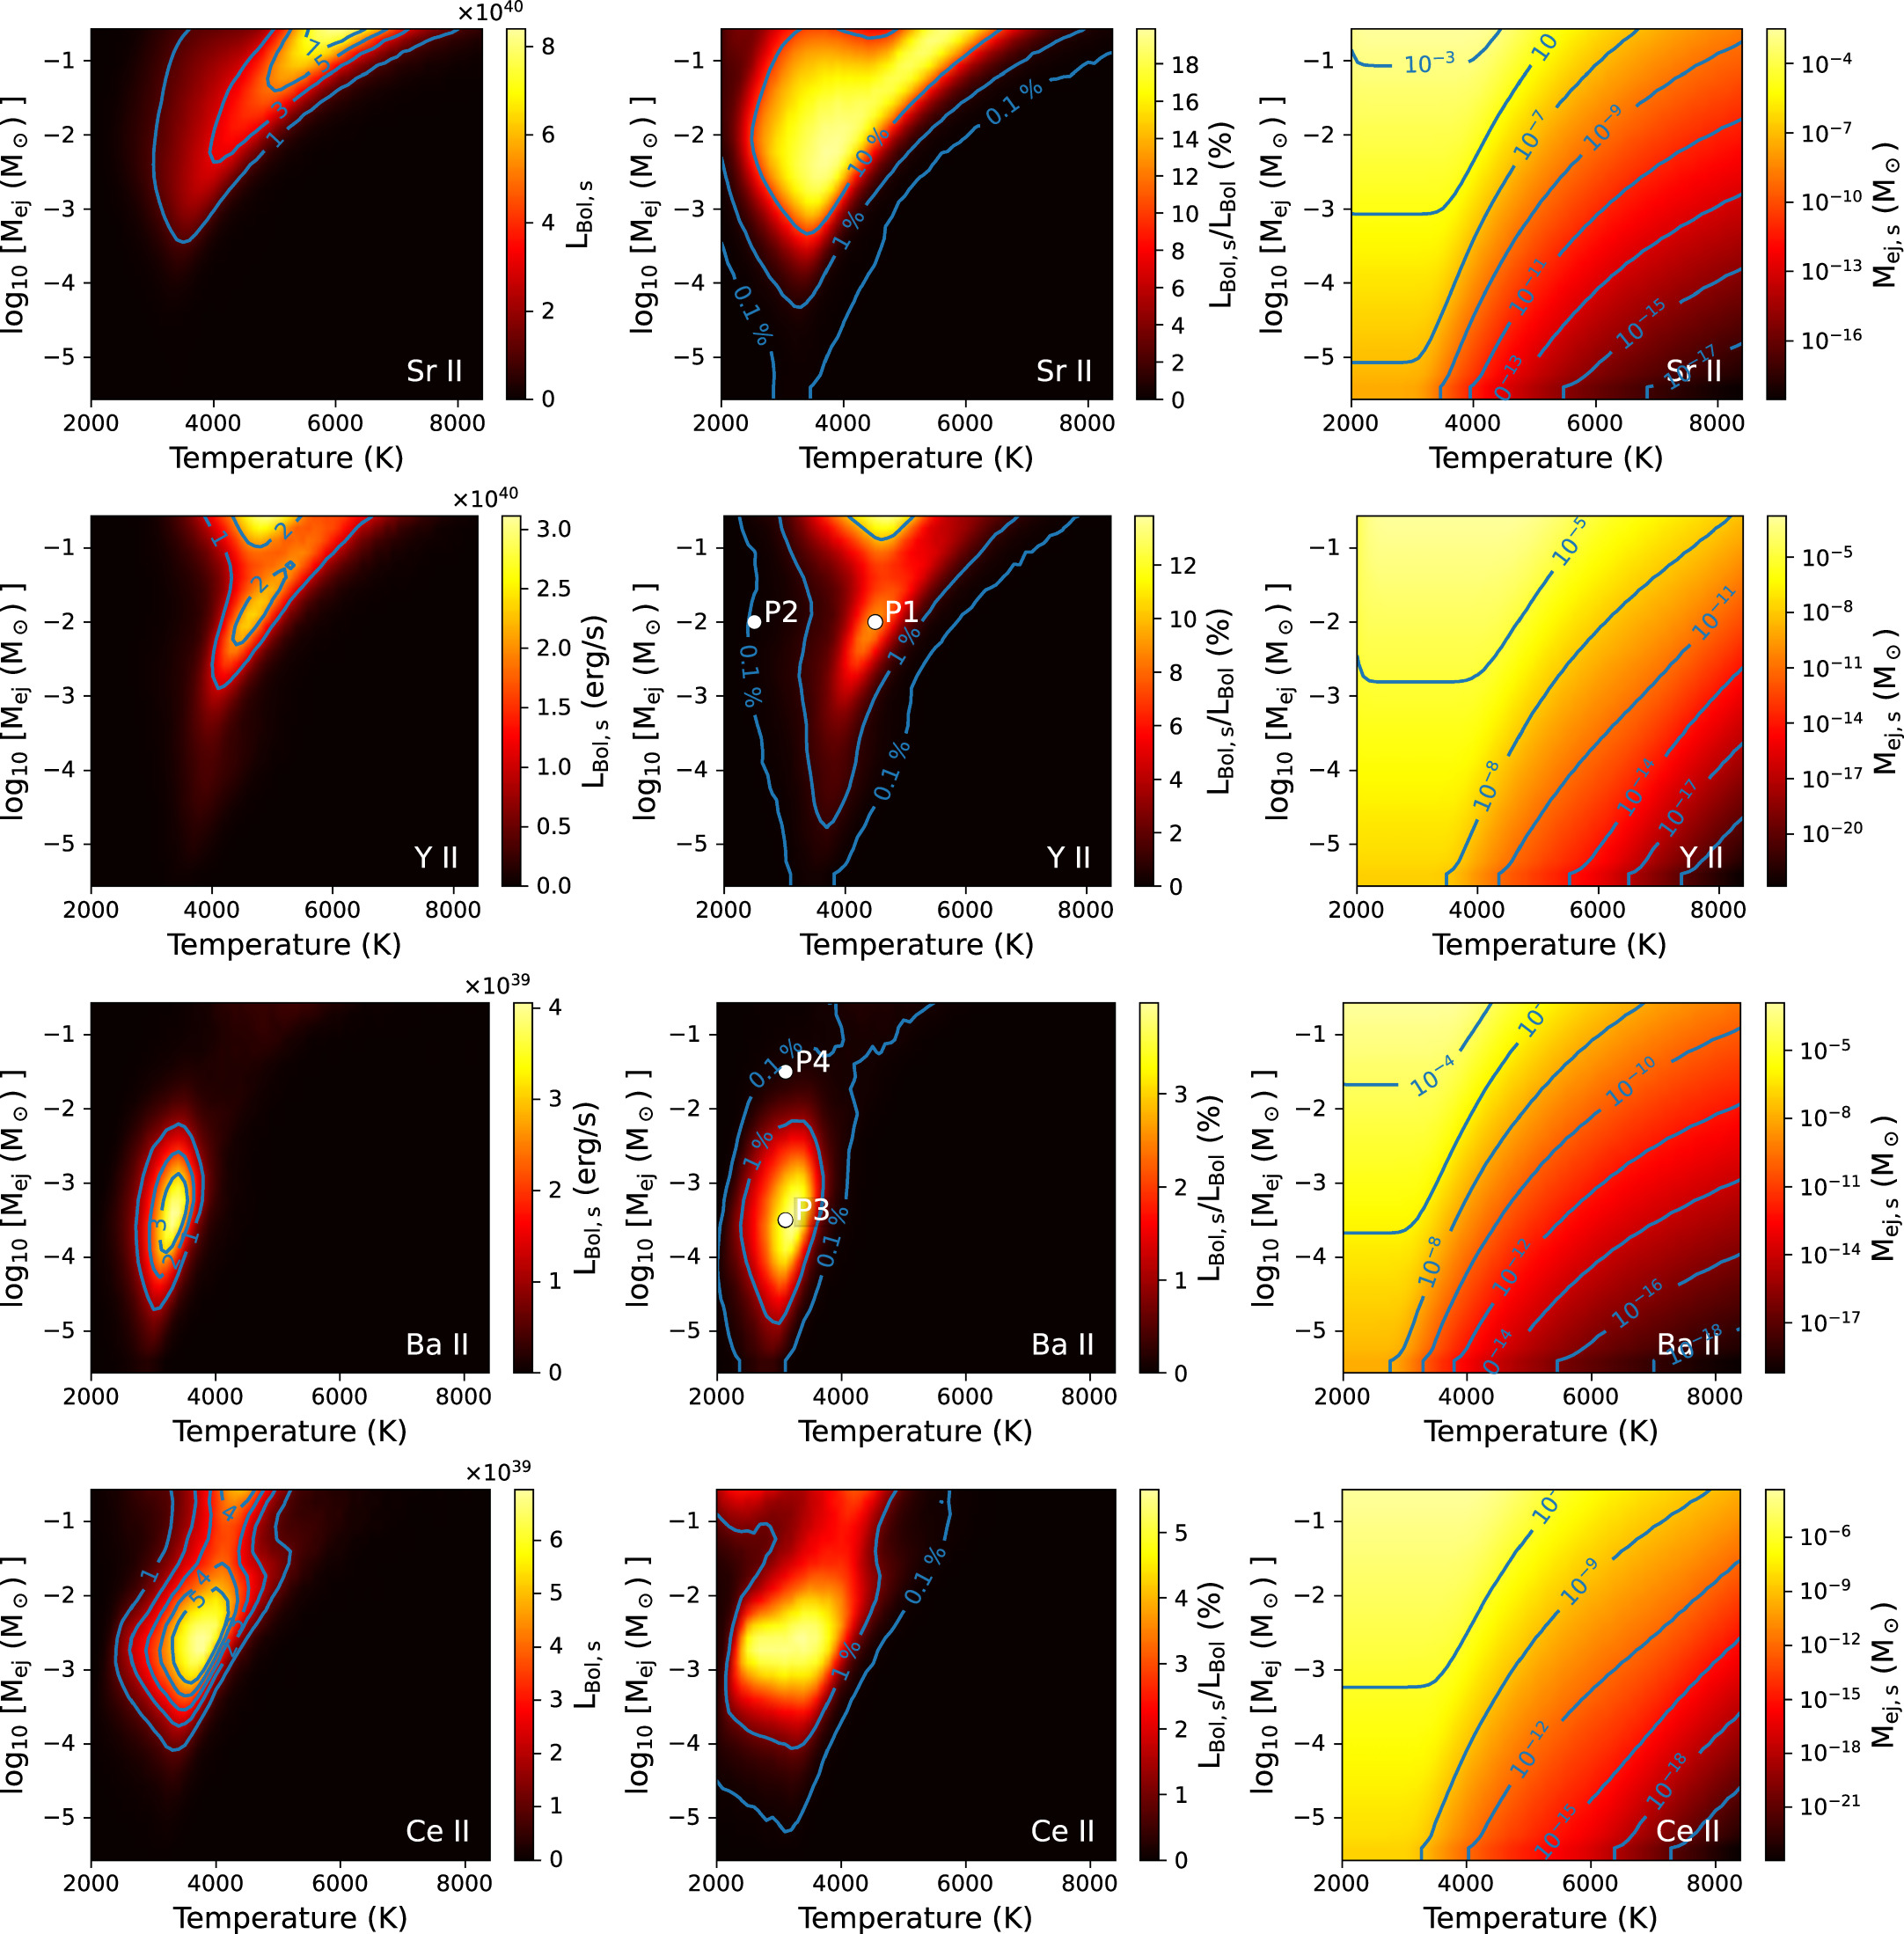
Figure 4 displays four examples—SrII, YII, BaII, and CeII—representing the most prominent species among considered heavy elements at temperatures below 6000 K, where some of them are prominently observed in AT2017gfo (e.g., Watson et al. 2019; Domoto et al. 2021; Gillanders et al. 2022). They contribute up to 3% or more to the total bolometric luminosity and become resonant within specific parameter spaces of the ejecta mass and temperature. We call this region the resonance island, and its location varies by species. Again, we clarify that this feature is not a result of the radiative decay of elements. Instead, it emerges from the reprocessing of photons as they pass through the line-forming region.

Figure 4. The luminosity and mass of four species (SrII, YII, BaII, and CeII) vary with temperature and ejecta mass. The left panels depict the bolometric luminosity of these four species, the middle panels illustrate their contribution to the overall bolometric luminosity, and the right panels display the mass of each species. Blue solid lines represent the contours. Points P1–P4 in the middle panels of YII and BaII are used for studying their origin (Section 4.1).
Download figure:
Standard image High-resolution imageAs depicted in the top-middle panel, SrII exhibits the largest and strongest resonance island, making its signature easily detectable in the kilonova spectrum. The two species, YII and CeII, on the other hand, display multiple islands; one for lower Mej and another for higher Mej. The origin of the multiple islands is discussed in Section 4.2. Species from Period 6 (BaII and CeII) typically exhibit resonance at lower Mej (approximately 10−3 M⊙), while the resonance island for Period 5 species (SrII and YII) is located at higher Mej and extends across a broad mass range.
As evident in the right panels, the species' mass, Mej,s, is directly proportional to Mej. Simultaneously, an increase in temperature leads to a decrease in mass, which is attributed to the transition of a singly ionized species to a doubly ionized species, as described by the Saha ionization equation. 9
The results for other elements can be accessed from the supplementary webpage. 10
3.3. Resonance Island Map
Figure 5 shows the resonance island map (RIM), where the 3% contribution contours of the 11 most potent elements are displayed. As temperature decreases, the dominance of line transitions in the line-forming region shifts sequentially from doubly ionized to singly ionized and then to neutral elements.

Figure 5. Resonance island map: The figure displays the 3% contribution contours for 11 significant species. Neutral ions tend to contribute to the kilonova spectrum at lower temperatures. The resonance islands for singly ionized ions occupy the temperature range from 2500 to 5000 K. Doubly ionized lanthanides contribute at higher temperatures. Lanthanides are represented by bluish colors.
Download figure:
Standard image High-resolution imageIn ejecta with low temperature and high ejecta mass, prominent line transitions take place from neutral species (SrI, YI, ZrI, BaI, and LaI). The range between 2500 and 5000 K is primarily dominated by line transitions from singly ionized species (SrII, YII, ZrII, BaII, and CeII), while the realm of doubly ionized species (lanthanides) extends above around 5000 K.
For singly ionized atoms, BaII and CeII (Period 6 elements) tend to show their strong contributions to the kilonova spectrum at lower ejecta masses (around 10−3 M⊙), while the resonance islands for SrII and YII (Period 5 elements) are situated at higher ejecta masses.
This map clearly displays the resonance-island locations of various species, offering guidance to identify the relevant species associated with emission/absorption features in an observed spectrum, for a given ejecta mass and temperature.
4. Discussion
4.1. Origin of the Resonance Island
When comparing the prominence of the resonance island (middle panels in Figure 4) and the species mass at the island (right panels in Figure 4), it becomes evident that the strength of the resonance is not solely determined by the mass and/or temperature of the line-forming region. Given that BaII has a well-isolated island, we focus on this region (specifically, the "P3" point in Figure 4) to delve into its origin.
We begin by examining the origin of the horizontal boundaries of the resonance island for BaII. The left panel of Figure 6 shows how the bolometric luminosity of BaII (LBol,s) varies with the BaII mass for a fixed ejecta mass (Mej =10−3.5 M⊙), represented by circle points connected with a dotted line. As the temperature increases from 2500 to 3000 K, the mass of the species remains relatively constant, while LBol,s exhibits an increase. At around 3100 K, the ratio between singly and doubly ionized atoms starts to change, resulting in a decrease in BaII mass. Nevertheless, LBol,s continues to rise until T ≃ 3300 K, as the temperature-induced increase in LBol,s outweighs the reduction from the mass decrease. Subsequently, LBol,s declines above T ≃ 3300 K due to the ionization.

Figure 6. Bolometric luminosity of BaII in various conditions. The left panel displays the bolometric luminosity of BaII at different temperatures. Dotted points connected with the dashed line are obtained from the solar r-process abundance (Table 1) for a fixed ejecta mass of Mej = 10−3.5 M⊙. For each temperature, solid lines are obtained by varying the Ba mass while fixing the masses of others. The right panel illustrates the change in the bolometric luminosity of BaII as we alter the ejecta mass for three temperatures. Solid lines correspond to results based on the solar r-process abundance, whereas dashed lines are derived under the assumption that only Ba is present in the line-forming region, meaning the ejecta mass is equivalent to the Ba mass.
Download figure:
Standard image High-resolution imageFor a more detailed comprehension of the trend, we intentionally raise the BaII mass in the line-forming region while keeping the masses of the other elements unchanged (represented by solid lines). Note that these artificial compositions no longer resemble the solar r-process abundance. For a fixed Mej,s, LBol,s continues to rise with increasing temperature, albeit at a diminishing rate. On the other hand, for a given temperature, LBol,s reaches a saturation point at around Mej,s ∼ 10−6 M⊙. Beyond this point, additional mass increments no longer result in an increase in LBol,s. This result implies that, even if there is more BaII in the ejecta, we can only establish the lower limit of its mass.
To be brief, the horizontal boundaries are linked to variations in the likelihood of interaction with changes in both photon flux and element mass. When the photon flux in the photospheric spectrum increases/decreases with temperature, there is a corresponding rise/decline in the interaction rate between photons and species. Likewise, an increase/decrease in the mass of BaII results in a higher/lower interaction rate.
Next, we turn our attention to the examination of the vertical boundaries of the BaII resonance island. In the right panel of Figure 6, we explore the change of LBol,s as Mej increases at three temperatures (solid lines labeled as "Solar Abund."): T = 3000 K (pink), 3300 K (brown), and 3600 K (red). Across all mass regimes, LBol,s at T = 3300 K surpasses those obtained at the other temperatures. We remind that the temperature of 3300 K corresponds to the summit of the island, where it reaches its maximum brightness (the left panel of Figure 6). In the low mass regime, an increase in BaII mass results in a corresponding increase in luminosity. As the mass of the species increases, LBol,s peaks at a certain mass, dependent on temperature, and then gradually begins to decrease.
To investigate the cause of the evolution of LBol,s as a function of Mej,s, we examine the evolution of LBol,s under the same conditions but with Ba exclusively present in the line-forming region (depicted by the dashed lines labeled as "Ba only"). In general, LBol,s from "Ba only" is higher than that of "Solar Abund." Unlike the "Solar Abund." case, LBol,s peaks at more and less the same point around Mej,s ∼ 10−6 and remains constant beyond it. This suggests that the overall value of LBol,s, as well as its peak and decline, originates from the influence of other elements.
Considering the RIM for the given r-process solar abundance (Figure 5), as the ejecta mass increases—leading to a rise in the mass of all elements within the ejecta—photons actively interact with other elements, specifically CeII and SrII. As a result, the interaction rate with BaII decreases, resulting in the upper boundary of the island. Similarly, at higher temperatures, there is a greater chance for photon packets to interact with SrII and PrIII (Figure 5), which enlarges the gap in LBol,s between "Ba only" and "Solar Abund." This suggests that the relative abundance of elements in the ejecta (Ye ) can notably impact the boundaries of the resonance island, particularly the upper limit. Furthermore, this result emphasizes the importance of the element composition in determining the contribution of each species, thereby shaping the kilonova spectrum. Further exploration of the relationship between Ye and the RIM can be explored in future research.
Finally, Figure 7 demonstrates how the relative contributions of SrII, YII, BaII, and CeII to the kilonova spectrum change as their masses vary at a temperature of 3300 K. The degree of influence between a species' mass and the strength of its resonance island differs among species; e.g., the strength of SrII resonance island increases sharply as its mass increases. In addition, the required masses of species for compounding the resonance island (3% contour) are different from one another: specifically, BaII requires a mass of 2 × 10⁻⁷ M⊙, CeII needs 6 × 10⁻⁷ M⊙, SrII demands 1.3 × 10⁻⁶ M⊙, and YII forms its island at its mass above 10−3 M⊙ at this temperature. As described in Section 3.3, the resonance islands for Period 6 elements are formed at a lower ejecta mass compared to Period 5 elements. Given that the necessary mass for making the resonance island prominent varies among species, this pattern is likely due to the varying inherent strength, or probability, of species' line transitions. This highlights the influence of the distinct characteristics of each species' energy levels and corresponding line properties on the formation of the resonance island.

Figure 7. Relative contributions to the kilonova spectrum from four species at a temperature of 3300 K. The four species are SrII, YII, BaII, and CeII.
Download figure:
Standard image High-resolution imageIn summary, the boundaries of the resonance island are determined by the combined effects of photon flux determined by temperature, species mass influenced by abundance and ejecta mass, line properties, and the relative line strength of other species.
4.2. Origin of the Multiple Resonances
To understand the origin of the two distinct islands in YII, we analyze changes in the spectral energy distribution (SED) with increasing ejecta mass (or species' mass). 11 For this investigation, we focus on a fixed temperature of 4500 K, as this temperature intersects both resonance islands.
Figure 8 displays the stacked SED for the luminosity contribution by YII. In the figure, three prominent points are visible; two are prominent at Mej ∼ 10−2 M⊙ (approximately Mej,s ∼ 10−5 M⊙) and the other is at a higher mass, Mej ≳ 10−0.5 M⊙. They are linked to a series of transitions, including three prominent line transitions with wavelengths of 7884, 9479, and 11181 Å. Note that multiple weaker transitions contribute to those prominent points as well (see Sneppen et al. 2023). This implies that these two separate islands are associated with different line transitions. One of them at a lower ejecta mass largely originates from the two transitions (7884 and 9479 Å), which have similar line properties; they are similarly saturated as Mej increases. The other island is predominantly from the line transition with λ = 11181 Å.

Figure 8. The contribution to the spectrum by YII as a function of the ejecta mass. This spectral energy distribution is obtained at a temperature of 4500 K. The three bright regions correspond to the resonances of three transition lines.
Download figure:
Standard image High-resolution image4.3. Strong Transitions
The diagram in Figure 9 illustrates the strength of lines (i.e., the relative occurrence rate) for four elements (SrII, YII, BaII, and CeII) at different values of Mej, all at a constant temperature of T = 3500 K. The results for other elements at different temperatures can be found on the supplementary webpage (see footnote 7).

Figure 9. The relative strength of line transitions of four species with respect to the ejecta mass at a temperature of 3500 K. We consider four representative species, SrII, YII, BaII, and CeII. The relative strength corresponds to the number of occurrences of the last line transitions for a given ejecta mass and temperature.
Download figure:
Standard image High-resolution imageIn the case of SrII (top panel of Figure 9), two prominent lines emerge at 10330 and 10918 Å from the NIR triplet transitions (see, e.g., Watson et al. 2019). We note that the other triplet line (10039 Å) is present in the models, but is fainter by a factor of ∼10. Both BaII and CeII show a preferred line transition across a broad Mej range, with wavelengths of 6499 Å and 8028 Å respectively. However, in the case of YII, diverse and multiple transitions occur depending on Mej range, where the wavelength of strong transitions increases as Mej increases. This implies that the YII feature (emission/absorption) in the observed spectrum would be smoothed out by its own other transitions, making it difficult to detect its signature (this feature is also reported by Sneppen et al. 2023). Note that the ejecta mass range of the preferred line domain (or vertical height) also changes with temperature.
4.4. Observational Implications
Observing the line-transition feature of a species necessitates meeting specific conditions, as the occurrence rate peaks at a particular temperature and is influenced by the species' mass. In other words, estimating the mass from observed spectra is only feasible when the conditions of temperature and ejecta mass are in harmony with those of resonance.
To illustrate this point, we select two elements, YII and BaII, and investigate how observed SED can differ when the conditions agree/disagree with their respective resonance islands: in Figure 4, P1 (YII resonance island), P2 (outside of YII resonance island), P3 (BaII resonance island), and P4 (outside of BaII resonance island). For each condition, we adjust the mass of a specific element, while keeping the masses of other elements fixed. In Figure 10, the top and bottom panels depict the changes in SEDs as we vary the mass of Y and Ba, respectively. When the ejecta mass and temperature align with the resonance conditions (as shown in the left panels, P1 and P3 in Figure 4), the changes in the masses of Y and Ba directly impact the SED in wavelengths of around 7500 Å and 6500 Å respectively. For example, increasing the mass of Y reduces the emission at 7500 Å attributable to the increased opacity caused by YII at that wavelength. This implies that it is possible to estimate the mass of the element from the spectral feature. Note that this YII P-Cygni feature (at ∼7600 Å) was proposed as the source of an observed feature in the intermediate-phase spectra of AT2017gfo by Sneppen & Watson (2023).

Figure 10. Spectral energy distributions under various conditions are depicted. The default conditions for each panel are displayed in the bottom-left corner, corresponding to P1–P4 in Figure 4. In each panel, we vary the mass of elements to observe how changes in their mass influence the resulting spectra. The left panels depict resonance conditions, wherein the mass of the target species (YII or BaII) notably influences the spectrum. The right panels correspond to nonresonance conditions. Note that, as observed in the top-right panel, the alteration in the mass of Y does not impact the contribution of YII but does affect the contribution of Y I.
Download figure:
Standard image High-resolution imageUnder unfavorable conditions (nonresonance), it might be challenging to identify any spectral features of the elements, even if they are present. In the lower-right panel, under conditions outside the BaII resonance island (P4 in Figure 4), it is evident that modifying the mass of Ba does not bring about any changes in the spectrum. In the case of Y (the top-right panel in Figure 10), altering the mass of Y does not induce the spectral feature of YII in the wavelength around 7500 Å as observed in the top-left panel. However, it does reveal the YI absorption feature at around 15000 Å as the conditions of P2 are now aligned with those for the YI resonance island (see Figure 5).
5. Summary
From the radiative-transfer simulations under various conditions, we identified the resonance conditions of the line transition(s) for each species. We also presented an RIM that serves as a guide for identifying element candidates that may exhibit spectral features as well as assessing the feasibility of constraining the mass of those elements at a given temperature.
Each species has its own resonance island with a unique shape. At a high temperature (>6000 K), doubly ionized lanthanides contribute actively to the kilonova spectrum. The resonance island for neutral atoms is located at low temperatures with high mass ejection. The resonance-island boundaries are shaped by the combined impact of temperature, species mass, line-transition characteristics, and the relative line strength of other elements.
We have discussed several observational challenges in determining or constraining the mass of a species. In Section 4.1, we highlighted that, independent of temperature, BaII exhibits a mass saturation point in its strong line transition (λ ∼ 6500 Å) at  M⊙. Beyond this point, a further increase in the mass of BaII does not impact the strength of the line feature. This implies that it becomes impractical to constrain the mass of BaII if
  M⊙. We emphasize that this mass refers to the mass within the line-forming region, and the total mass of BaII within the kilonova system in our parameter configuration will be approximately twice this value (assuming a uniform ejecta composition and a smooth, continuous density profile; see Section 2). Consequently, when attempting to constrain the mass of a species, it is crucial to verify whether the determined mass is significantly lower than the saturation mass. Furthermore, when deviating from the resonance island for a species, the species would make a weak contribution to the observed spectrum, as discussed in Section 4.4. These complexities pose challenges in straightforwardly estimating the mass of a species from the observed SED.
We stress that the accuracy of our result heavily depends on the completeness of the atomic data set. Since there is limited information available for many of the heavy r-process elements, it is likely we underestimate the significance and strength of line transitions for certain heavy elements. Nevertheless, given the current understanding of the available atomic data, our result offers guidance for exploring the line signatures of kilonovae. As highlighted by Gillanders et al. (2024), the properties of lines for certain species are inadequately examined, yet they hold particular importance in comprehending observations. This emphasizes the need for dedicated studies on the atomic data of those elements.
Given the current understanding of kilonova ejecta mass (Mej ∼ 0.01–0.1 M⊙), elements associated with Period 5 are likely to exhibit strong line-transition features, as observed in AT2017gfo (e.g., Watson et al. 2019; Domoto et al. 2021; Gillanders et al. 2022; Perego et al. 2022). However, a future kilonova with lower mass ejections could exhibit prominent spectral features from Period 6 elements. In addition, rapid follow-up observations of kilonovae could allow us to identify a line-transition feature produced by doubly ionized lanthanides, since the ejecta temperature is higher at earlier times.
Acknowledgments
We appreciate the kind assistance of Insu Paek from Seoul National University for hosting the supplementary website. This work was supported by the National Research Foundation of Korea (NRF) grant No. 2021M3F7A1084525, funded by the Korean government (MSIT). This research made use of tardis, a community-developed software package for spectral synthesis in supernovae. The development of tardis received support from GitHub, the Google Summer of Code initiative, and ESA's Summer of Code in Space program. tardis is a fiscally sponsored project of NumFOCUS. tardis makes extensive use of Astropy and Pyne.
Software: tardis (Kerzendorf et al. 2023, https://zenodo.org/record/8128141).
Footnotes
- 4
- 5
The model properties of the inner boundary and the envelope are controlled by user inputs.
- 6
While this statement is true for the real packet case, there exists a virtual packet treatment within tardis that can be used to increase the emergent packet count, effectively decreasing the noise introduced from Monte Carlo processes. This treatment depends on the intermediate interactions that each of the r-packets undergo (see Kerzendorf & Sim 2014, for details).
- 7
The choice of any positive value ϕ0 gives Equation (3) with a different normalization constant.
- 8
- 9
In thermal equilibrium, the ionization rate rises with temperature, as described by the Saha ionization equation:
![${n}_{i+1}/{n}_{i}\propto {({k}_{B}T)}^{3/2}\exp [-{\epsilon }_{i}/({k}_{B}T)]$](data:image/png;base64,iVBORw0KGgoAAAANSUhEUgAAAAEAAAABCAQAAAC1HAwCAAAAC0lEQVR42mNkYAAAAAYAAjCB0C8AAAAASUVORK5CYII=) , where ni+1 and ni
represent the number of ions in the (i + 1)th and ith ionization states, respectively,
, where ni+1 and ni
represent the number of ions in the (i + 1)th and ith ionization states, respectively,  i
is the ionization potential between the (i + 1)th and ith ionization states, and kB
is the Boltzmann constant.
i
is the ionization potential between the (i + 1)th and ith ionization states, and kB
is the Boltzmann constant. - 10
- 11
The spectra for other elements at different temperatures are located at http://kilonova.snu.ac.kr.
![${n}_{i+1}/{n}_{i}\propto {({k}_{B}T)}^{3/2}\exp [-{\epsilon }_{i}/({k}_{B}T)]$](https://content.cld.iop.org/journals/0004-637X/967/1/54/revision1/apjad3af4ieqn7.gif)