Abstract
This paper describes the pilot study that attempts to analyze the difference in learners’ behavior of reading multimedia learning materials by our program. Learners with different cognitive styles characterized as verbalizers and visualizers were assigned to read the materials about cooking science with their eye movement recorded, and analyzed. An alternative strategy of visualization to integrate the instructional message with the temporal and spatial data in a single diagram is attempted and testified in this pilot study. As the result, it is observed that the gaze of the verbalizers mainly moves back and forth among the paragraph areas constituted mainly by text of each page whereas the visualizers frequently check pictures referenced by some text, yet figure legends are more read by verbalizers. Preliminary findings from the pilot study provide data presentation and interpretation in better granularity, and support that learners’ cognitive styles affect their decisions of orders, emphasis, and repetition to read text and pictures.
You have full access to this open access chapter, Download conference paper PDF
Keywords
1 Introduction
With widespread of IT technologies in our daily lives, resourceful learning environment with multimedia instruction and learning materials becomes common for instructors and learners to access. In this learner-controlled multimedia learning environment, how learners’ decisions and preferences of information seeking and processing influence their learning, has been a critical yet controversial issue in the field of educational psychology [1,2,3]. In addition to the relationship between students’ preferences and capabilities, instructors specifically concerned whether and how the instructional program should be accommodated to learners’ preferences. However, relatively few studies have been conducted to resolve the problems [4]. Also a lack of objective and clear data has been criticized because most of previous studies adopted indirect self-reported measurement instead of direct observational method like eye-tracking [5]. For a few studies [5, 6], which attempt to directly examine verbal and visual learners’ eye movements in the context of multimedia learning with pictorial and textual stimuli, they reported real challenges in generalizability due to limited granularity of existing eye trackers and rather smaller sample size. A major cause to their challenges results from the fact that cognitive styles of verbalizer-visualizer are dimensional, not in dichotomy, meaning that most people display both styles to some extent [2, 6]. Based on this premise, it is understood that exploring the reading interaction between learners’ cognitive style, learning preference and performance in details will call for instruments with better granularity to not only record but also present fine-grained differentiation in their reading behaviors. Our study therefore attempts to analyze the data obtained by eye-tracking systems in terms of area of interests (AOIs) by our program developed in house.
In addition to the individual trait of cognitive style, learners’ preferences in choosing text or pictures in instructional texts also influence their learning performance [7]. While the research results are inconsistent on the causal relationship between cognitive styles and preferences, it is supported that a combination of text and pictures support learning based on the dual-coding theory [8, 9]. To approach the unanswered questions of the advantages of instructional text and pictures for verbalizers and visualizers, further empirical investigation of learners’ cognitive styles and multimedia messages design will be necessary. Therefore, this study focuses on learners’ cognitive styles on verbalizer-visualizer dimension, and provides reading materials in multiple media formats including text, pictures and figure legends to investigate learners’ reading interaction with different representations.
Motivated by the aforementioned issues, this study intends to explore the interaction between visualizer-verbalizer learners and text-picture materials by direct observation of the learners’ gaze behaviors and eye movement. The observed gaze behaviors will be recorded for comparison between verbalizers and visualizers. In addition to the general yet fractional presentation of eye-tracking data in fixations and saccades, an alternative strategy of visualization to integrate the instructional message with the temporal and spatial data in a single diagram is attempted. In the remainder of this article, the research design including the measurement, instrument, and materials will be reported in Sect. 2. Preliminary findings of the pilot study will be presented in Sect. 3. Finally, the conclusion and future works will be discussed in Sect. 4.
2 Research Design
2.1 Cognitive Styles
This study investigates the reading interaction of learners of verbalizer-visualizer cognitive styles with multimedia message in textual, graphical and annotated illustrational formats. This study followed the quasi-experiment methodology for the research design, and a between-group experiment was conducted. College students were invited to participate in the user experiment to read a scientific text of chemical reactions and recipes about daily cooking. Scientific text was selected in this study because the intentional use of text and pictures to facilitate comprehension and learning is common in scientific text, and the material of a rather general topic of daily cooking was designed in order to avoid interference with learners’ prior knowledge and intelligence. A total number of 16 valid sample was collected and analyzed for this pilot study to testify the algorithm of the proposed analyzer program.
2.2 Instruments and Procedures
Previous studies on cognitive style were inconsistent in distinguishing the structure of verbalizer and visualizer. Some studies identified verbalizer and visualizer as different factors with different scales, and some defined verbalizer-visualizer as continuous on a single scale. For the belief that the verbalizer-visualizer cognitive style is dimensional in nature, this study viewed the distinction as a one-scale dimension [3], with verbal and visual cognitive style at either end. The Style of Processing Scale (SOPS) developed by Childers, Houston & Heckler in 1985 [9] is adopted accordingly to measure and determine the participants’ cognitive styles. SOPS is a modified instrument from the original 6-itemed Visualizer-Verbalizer Questionnaire (VVQ) [10]. SOPS employs 16 more items in addition to 6 items of the VVQ and changes the response, which is originally binary, to a continuous scale for the same extent. The scale was scored to give a single overall score, where verbal and visual styles are in opposition [9]. The total of 22 questions of SOPS inquires the participants about their typical behaviors when carrying out different mental tasks, among which 11 items are related to verbal processing and 11 are related to visual processing. The inventory of SOPS was translated into Chinese as shown in Table 1, and administered online before the user experiment. According to the participants’ scores of SOPS, all 16 participants were distinguished as 8 verbalizers and 8 visualizers with the calculation of relative tendency by the median [9].
The two groups of participants were then randomly assigned to read two types of reading materials with different text-picture layouts. As shown in Fig. 1, layout in Fig. 1(a) consists of explanatory illustrations and pictures as additional remark to the text above. Layout in (b) consists of annotated illustrations located next to the corresponding text, and with supplemental figure legends under the pictures. Layout in (c) consists of procedural presentation of text and a corresponding picture.

Pages of the learning materials used for the experiment.
2.3 Obtaining Gaze Data
Each participant was required to read through the learning materials and their eye movement was observed and recorded by Tobii EyeX Controller, a screen-based eye-tracker with the sampling rate of 50 Hz. This eye-tracker was attached to the computer screen in front of the participants when they read the materials on the screen. Figure 2 illustrates examples of those gaze data for two different participants characterized as the verbalizers and the visualizers respectively for the layout in Fig. 1(b). Each fixation point is shown by the circle with the diameter corresponding to the amount of time while the point is being gazed by the participant. With the raw data of eye movement obtained by the eye-tracker, we further specified the region of interests (ROIs) and extracted the period of fixation based on the ROIs for purposeful analyses by our program afterwards.

Examples of fixation points for the layout in Fig. 1(b).
Each ROI corresponds to a single element of the description in the learning materials. Figure 3 illustrates the ROIs specified for the page with the layout in Fig. 1(b) by rectangular regions labeled in alphabetical order with A, B and so on. Each ROI includes one of the three kinds of description: text, pictures and figure legends, which are shown in Fig. 3 respectively as a dark shade, light shade and no shade applied to the corresponding region.
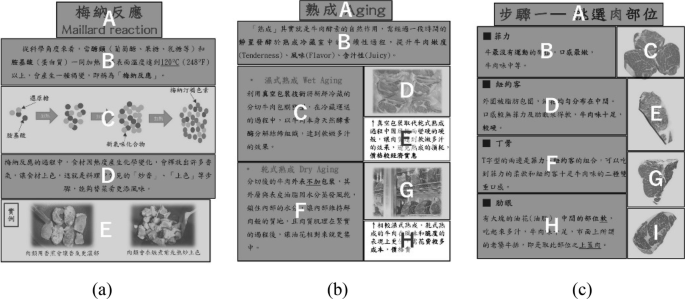
ROIs of texts, pictures and figure legends specified for the analysis by our program.
Among these descriptions, some text refers to pictures, and some pictures are accompanied with figure legends. To be more specific, text in B and D refers to pictures in C and E respectively in Fig. 4(a). Text in C and F refers to pictures in D and G respectively in (b). Furthermore, pictures in D and G are accompanied with figure legends in E and H respectively. Text in B, D, F and H refers to pictures in C, E, G and I respectively in (c).

Periods with fixation points in different ROIs with text, pictures and figure legends in each paragraph area for Fig. 1(b).
With these relations among text, pictures and figure legends, an ROI including a picture with no accompanying legend or ROIs including a picture with its accompanying figure legend constitute a picture area. An ROI including text with no reference to a picture or ROIs including text with the picture area referenced by the text constitute a paragraph area, which serves as a step in the order of the explanation given by the learning materials. Picture areas are constituted by C and E in Fig. 3(a), by {D, E} and {G, H} in (b), and by C, E, G and I in (c). Paragraph areas are constituted by A, {B, C} and {D, E} in Fig. 3(a), by A, B, {C, {D, E}} and {F, {G, H}} in (b), and by A, {B, C}, {D, E}, {F, G} and {H, I} in (c).
2.4 Visualizing the Eye Movement for Each Participant
To visualize the eye movement over different ROIs including text, pictures and figure legends, which are structured into picture areas and paragraph areas as described above, the periods while fixation points of the gaze kept staying in the same ROI were drawn by diagrams. Figure 4 shows examples of the diagrams for the gaze of eight participants characterized as verbalizers and those as visualizers for the page in Fig. 1(b) with explanatory illustrations and pictures as additional remark to the text. In each diagram, horizontal lines along with one of the four rows correspond to the periods while the fixation points of the gaze were staying in the paragraph area that serves as the step in the order corresponding to the row among the four paragraph areas in the page. The parts colored in black, gray and white within the same period respectively correspond to the period for the fixation points to stay in the ROIs including text, pictures and figure legends constituting the paragraph area (see Fig. 5).

Correspondence between the period of each horizontal line in the diagram in Fig. 4 and the ROIs where the fixation points are located during the period.
The results in Fig. 5 show that some learners did not read through the page from the top to the bottom. They sometimes omitted to check the picture referenced by text and to read the figure legend accompanied by a picture after reading the text and the picture. The tendency of these behaviors differed with the learners, and there seemed to be some difference in these tendency between those who characterized as the verbalizers and visualizers, although the difference was not so clear.
3 Preliminary Findings
3.1 Visualizing the Traversals of ROIs
To visualize the above difference in learning behavior between the verbalizers and the visualizers, their gaze was analyzed by focusing on its different kinds of traversal of the ROIs. What we considered for the purpose above were traversals between different paragraphs sequenced in the same page, traversals between the text and the picture area referenced by the text in the same paragraph area, and traversals between the picture and the figure legend for annotation of the picture in the same picture area. These three kinds of traversals are called hereafter as sequential traversals, referential traversals and annotative traversals, respectively. Number of participants for whom each of these three kinds of traversals is observed at each moment for reading through the page is counted over each group of the eight participants characterized as the verbalizers and the visualizers respectively in Fig. 4. The results are shown in Fig. 6.

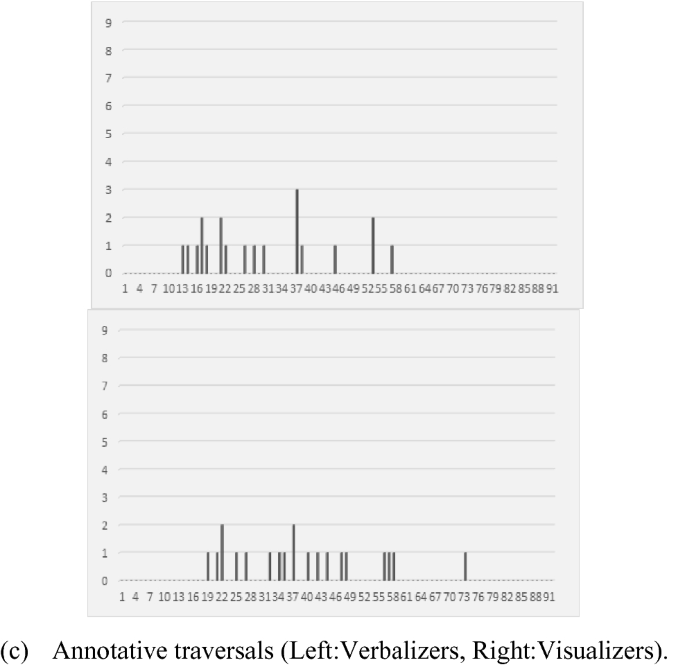
Number of the participants with the traversal of gaze between the ROIs of different types at each moment for reading through the page in Fig. 1(b).
As shown in Fig. 6(a), the number of sequential traversals at each moment, which corresponds to the same amount of time, is generally larger for verbalizers than visualizers. This result suggests that verbalizers followed the structure of the text more frequently than visualizers. That is, verbalizers tended to read line by line, paragraph by paragraph, and also dwelled longer in the text area of the learning materials. Visualizers, on the other hand, skimmed over most textual message frequently, whether the texts were the context or the figure legends. As shown in Fig. 6(b), visualizers also show more referential traversals between the text and graphical area since they tended to attend to the pictures and explanatory illustrations first and then referred to the related text quickly. From this result together with that verbalizers and visualizers did not possess significant difference in terms of the number of annotative traversals as shown in Fig. 6(c), it is reasonable to understand that when it comes to the layout with supplemental figure legends under the pictures, visualizers did not check the figure legends accompanying with each picture so frequently as the verbalizers do. By the number of the traversals, the results suggest that the influence of participants’ cognitive style could override the influence of message layout. Participants’ attention was intuitively drawn to their preferred media type, regardless of the text-graphic layout of the learning materials.
4 Conclusions and Future Works
This article has presented the results of our pilot study for analyzing gaze behaviors of learners reading through learning materials constituted by text, pictures and figure legends from the viewpoint of the difference in cognitive styles characterized as verbalizers and visualizers. The raw data of eye movement were obtained by eye-tracking devices. Those data are visualized by a single diagram, in which fixation points are integrated into periods corresponding to ROIs, and traversals between them were analyzed. Preliminary findings from the data supports the differences in verbalizer-visualizer cognitive styles resulted in their decisions of orders, emphasis, and repetition to read text and pictures. Verbalizers draw their attention to and read more frequently the text and figure legends than visualizers in layouts with explanatory and annotated illustrations. To verify the tendency of the gaze behaviors above as one of our future steps, further analysis will incorporate larger number of participants and investigate learners’ reading performance to empirically access the causal relationship among cognitive styles, learning preferences and the learning performance. In addition, different layouts of message design that assemble scientific text in real world are also considered in our future work to investigate learners’ performance in genuine contexts with better generalizability.
References
Cassidy, S.: Learning styles: an overview of theories, models, and measures. Educ. Psychol. 24, 419–444 (2004)
Kirschner, P.A., van Merriënboer, J.J.: Do learners really know best? Urban legends in education. Educ. Psychol. 48(3), 169–183 (2013)
Mayer, R.E., Massa, L.: Three facets of visual and verbal learners: cognitive ability, cognitive style, and learning preference. J. Educ. Psychol. 95(4), 833 (2003)
Höffler, T.N., Prechtl, H., Nerdel, C.: The influence of visual cognitive style when learning from instructional animations and static pictures. Learn. Individ. Differ. 20(5), 479–483 (2010)
Mehigan, T.J., Barry, M., Kehoe, A., Pitt, I.: Using eye tracking technology to identify visual and verbal learners. In: IEEE International Conference on Multimedia and Expo (IEEE ICME 2011), pp. 1–6 (2011)
Koć-Januchta, M., Höffler, T., Thoma, G.-B., Prechtl, H., Leutner, D.: Visualizers versus verbalizers: effects of cognitive style on learning with texts and pictures–an eye-tracking study. Comput. Hum. Behav. 68, 170–179 (2017)
Clark, J.M., Paivio, A.: Dual coding theory and education. Educ. Psychol. Rev. 3(3), 149–210 (1991)
Clark, R.E., Feldon, D.F., Mayer, R.E.: The Cambridge Handbook of Multimedia Learning (2005)
Childers, T.L.: Measurement of individual differences in visual versus verbal information processing. J. Consum. Res. 12(2), 125–134 (1985)
Richardson, A.: Verbalizer-visualizer: a cognitive style dimension. J. Ment. Imag. 1(1), 109–125 (1977)
Author information
Authors and Affiliations
Corresponding author
Editor information
Editors and Affiliations
Rights and permissions
Copyright information
© 2019 Springer Nature Switzerland AG
About this paper

Cite this paper
Kakusho, K., Takase, F., Murakami, M., Lin, W., Yueh, HP. (2019). How Learners with Different Cognitive Styles Read Learning Materials with Text and Pictures: A Gaze Analysis. In: Rau, PL. (eds) Cross-Cultural Design. Culture and Society. HCII 2019. Lecture Notes in Computer Science(), vol 11577. Springer, Cham. https://doi.org/10.1007/978-3-030-22580-3_32
Download citation
DOI: https://doi.org/10.1007/978-3-030-22580-3_32
Published:
Publisher Name: Springer, Cham
Print ISBN: 978-3-030-22579-7
Online ISBN: 978-3-030-22580-3
eBook Packages: Computer ScienceComputer Science (R0)