Location via proxy:   
[Report a bug]   [Manage cookies]                

Popular pages

Research and data to make progress against the world’s largest problems.

13,216 charts across 120 topicsAll free: open access and open source

Our Mission

What do we need to know to make the world a better place?

To make progress against the pressing problems the world faces, we need to be informed by the best research and data.

Our World in Data makes this knowledge accessible and understandable, to empower those working to build a better world.

Read about our mission

We are a non-profit — all our work is free to use and open source. Consider supporting us if you find our work valuable.

Donate to support us
As seen on
Logos of the publications that have used our content. From left to right: Science, Nature, PNAS, BBC, Financial Times, The New York Times, The Guardian, The Atlantic, and The Washington Post

Daily Data Insights

Bite-sized insights on how the world is changing, published every weekday.

See all Daily Data Insights
The image shows a series of six line graphs depicting the trends in global emissions of different pollutants from 1750 to 2022. The title reads "The world has passed 'peak pollution'," indicating that emissions of several pollutants have declined since their peak levels, except for ammonia.

The pollutants shown are:

- Sulphur dioxide (SO₂) – peaked in the mid-20th century and has since declined.
- Nitrogen oxide (NOx) – followed a similar pattern, peaking around the late 20th century and then dropping.
- Carbon monoxide (CO) – peaked mid-20th century and declined.
- Black carbon (BC) – shows a rise until recently, followed by a drop.
- Organic carbon (OC) – has risen steadily with a recent plateau.
- Ammonia (NH₃) – continues to rise without a recent decline.

The world has probably passed “peak air pollution”

Global emissions of local air pollutants have probably passed their peak.

The chart shows estimates of global emissions of pollutants such as sulphur dioxide (which causes acid rain), nitrogen oxides, and black and organic carbon.

These pollutants are harmful to human health and can also damage ecosystems.

It looks like emissions have peaked for almost all of these pollutants. Global air pollution is now falling, and we can save many lives by accelerating this decline.

The exception is ammonia, which is mainly produced by agriculture. Its emissions are still rising.

These estimates come from the Community Emissions Data System (CEDS).

Air pollution has not peaked everywhere in the world — explore the data for your country →

Continue reading
The visualization illustrates the distribution of international migrants based on the distance between their countries of origin and destination as of 2020. A horizontal axis represents the distance in kilometers, ranging from 0 to over 10,000. The vertical axis shows the share of all emigrants as a percentage.

There are data points indicating that the majority of international migrants come from neighboring countries, which are highlighted as the most common destinations. The largest share falls within the 0 to 500 kilometers distance range, with decreasing percentages as the distance increases. 

The source of the data is listed at the bottom, citing UN DESA (2020) and Natural Earth (2024). Additionally, there is a note explaining that the distances represent the shortest geographical distances between the borders of the origin and destination countries.

The most frequent international migration journeys are between neighboring countries

One way to understand how far international migrants move is to measure the shortest distance between the borders of their origin and destination countries.

The chart above shows these distances for all international migrant populations worldwide. It includes the total number of people living outside their home country rather than yearly migration flows.

Most migration journeys are short, with neighboring countries (shown as “0 km” on the chart) the most common destinations. Nearly half of all migrants — about 47% — move less than 500 kilometers, roughly the distance from the Netherlands to Switzerland. The median distance between origin and destination countries is just under 600 kilometers.

24% of migrants travel over 3,000 kilometers, about the distance from Ukraine to Portugal. Only a small fraction — less than 4% — move more than 10,000 kilometers, equivalent to a journey from Rwanda to the United Kingdom.

Read our full article on how far migrants travel from their home countries

Continue reading
A horizontal bar chart displaying the number of living languages spoken in various countries. The countries listed from highest to lowest number of languages are: 

1. Papua New Guinea: 840 languages
2. Indonesia: 710 languages
3. Nigeria: 530 languages
4. India: 453 languages
5. China: 306 languages
6. Mexico: 293 languages
7. Cameroon: 279 languages
8. United States: 236 languages
9. Australia: 224 languages
10. Brazil: 222 languages

The chart is titled "How many living languages are spoken in each country? 2024" and states that a living language has at least one person speaking it as their first language. Data source is cited as Summer Institute of Linguistics (SIL) International, 2024, with a note referencing Our World in Data.

Papua New Guinea has more living languages than any other country

Papua New Guinea has 840 living languages — more than any other country.

A living language is one that is spoken by at least one person as their first language. The chart shows the ten countries with the most living languages as of 2024. This data is from the Ethnologue dataset produced by the Summer Institute of Linguistics International.

There are over 7,000 living languages globally, meaning that more than 10% of the world’s living languages are spoken in Papua New Guinea.

Papua New Guinea was initially settled by humans around 50,000 years ago, allowing a long time for languages to be established. Around 3,500 years ago, people speaking a different family of languages (Austronesian) arrived and settled in Papua New Guinea, bringing additional diversity to the country.

Unlike many nations, Papua New Guinea did not experience historical events such as the establishment of an early centralized authority, which often led to the dominance of a single language. Instead, its rugged mountainous terrain isolated communities, fostering the independent development of numerous languages.

Explore the number of living languages in other countries

Continue reading
This chart presents data on cardiovascular disease death rates per 100,000 people from 1950 to 2021 for four countries: the United States, France, the United Kingdom, and Italy. 

- The United States shows a significant decline in cardiovascular disease death rates, starting from around 500 deaths per 100,000 people in 1950 and dropping to below 150 by 2021, indicating a fourfold decrease.
- France's trend similarly reflects a decrease, with rates starting near 300 in 1950 and falling to around 50 by 2021, illustrating a fivefold reduction.
- The United Kingdom's data mirrors France's, beginning at around 500 in 1950 and reducing to around 100, also representing a fivefold decline.
- Italy exhibits a decline as well, with cardiovascular death rates decreasing from 400 per 100,000 in 1950 to around 100 in 2021, indicating a fourfold reduction.

The data source is the WHO Mortality Database (2024) and the chart is published by OurWorldInData.org.

Cardiovascular disease death rates have fallen rapidly in many countries

Cardiovascular disease mortality has fallen massively since the 1950s.

This chart shows annual age-standardized death rates from cardiovascular diseases in four countries: the United States, France, the United Kingdom, and Italy.

The decline is substantial. In the United States, the death rate dropped from over 500 per 100,000 people in 1950 to under 150 in 2021 — a four-fold decline. The reduction in France and the United Kingdom was even greater, with death rates falling five-fold.

This progress comes from advancements in medical science, surgeries, emergency care, public health efforts, and dietary changes, improving cardiovascular health.

A dramatic reduction in smoking rates, better screening and monitoring for conditions like high blood pressure, and the development of life-saving treatments such as stents, statins, and clot-busting drugs have all contributed.

Explore trends in cardiovascular mortality in more countries

Continue reading
Map titled "Which countries met the UN's target of giving 0.7% of national income to foreign aid in 2023?" showing countries in three categories: "No data" (white), "Below the UN target" (tan), and "Meeting the UN target" (blue). Only Sweden is shown in blue, meeting the UN's foreign aid target. Countries such as the United States, Canada, Australia, and various European nations appear in tan, indicating they fall below the target. The map notes that the UN’s 0.7% target is intended for developed countries and references data from the OECD (2024).

Five developed countries met the UN’s target for foreign aid in 2023

In the 1970s, the UN General Assembly adopted a resolution asking developed countries to contribute at least 0.7% of their national income to foreign aid. Most countries accepted this target, except for Switzerland and the United States.

But very few countries have met this target in the fifty years since then. Even today, only a handful of countries do.

Just five countries met this target in 2023: Norway, Luxembourg, Sweden, Germany, and Denmark. You can see them in blue on the map.

Every other developed country gave less than 0.7% of their national income.

Explore more of our new charts on foreign aid: who contributes, and where it goes →

Continue reading
A chart showing the computation used to train notable AI systems, measured in total floating-point operations (FLOP) and highlighting two distinct eras. In the first era from 1950 to 2010, the training computation doubled approximately every 21 months. With the rise of deep learning since 2010, it has been doubling approximately every 6 months. The y-axis ranges from 100 FLOP to 100 septillion FLOP. Several systems are highlighted, from early systems such as Theseus and the Perceptron Mark 1 to recent systems such as GPT-4 and Gemini 1.0 Ultra.

Since 2010, the training computation of notable AI systems has doubled every six months

Artificial intelligence has advanced rapidly over the past 15 years, fueled by the success of deep learning.

A key reason for the success of deep learning systems has been their ability to keep improving with a staggering increase in the inputs used to train them — especially computation.

Before deep learning took off around 2010, the amount of computation used to train notable AI systems doubled about every 21 months. But, as you can see in the chart, this has accelerated significantly with the rise of deep learning, now doubling roughly every six months.

As one example of this pace, compared to AlexNet, the system that represented a breakthrough in computer vision in 2012, Google’s system “Gemini 1.0 Ultra” just 11 years later used 100 million times more training computation.

To put this in perspective, training Gemini 1.0 required roughly the same amount of computation as 50,000 high-end graphics cards working nonstop for an entire year.

Read more about how scaling up inputs has made AI more capable in our new article by Veronika Samborska

Continue reading
A flow diagram showing the total number of international migrants by their birthplace and residence in 2020. The left side presents the continents that migrants moved from, with the following data: Asia has 115 million migrants, Europe has 63 million, Africa has 41 million, North America has 30 million, South America has 18 million, and Oceania has a small number that’s not specified. 

The right side illustrates the continents migrants moved to, with Asia receiving 81 million migrants, Europe gaining 85 million, Africa receiving 23 million, North America attracting 58 million, South America getting 11 million, and Oceania receiving a small number. Flow lines connect the two sides, indicating the movement patterns of migrants. 

The diagram is titled "Most people who leave their country stay on the same continent." The data source is credited to the UN Department of Economic and Social Affairs from 2020, and further information can be found at OurWorldinData.org/migration. The licensing is indicated as CC BY.

Most migrants stay in the continent where they were born

Moving between continents is less common than moving to another country within the same region. For most people, international migration means crossing a nearby border, rather than a very long distance or even an ocean.

Consider Asia, the world's most populous continent.

When an Asian emigrant leaves their home country, they can either move to another Asian country or head to one of the other five continents.

Data from the United Nations Department of Economic and Social Affairs shows that six out of ten Asian emigrants remain within Asia. In other words, more Asian emigrants move to other Asian countries than to all other continents combined.

European and North American emigrants show an even stronger tendency to stay in their continent, at 70% and 87%, respectively. This share is smaller in Africa and South America, at around half.

While this data aims to include illegal migrants, experts acknowledge the challenges in fully measuring these populations.

Read our full article on how far migrants travel from their home countries

Continue reading

Get Daily Data Insights delivered to your inbox

Receive an email from us when we publish a Daily Data Insight (every weekday).

By subscribing you are agreeing to the terms of our privacy policy.

Explore our data

Featured data from our collection of 13,216 interactive charts.

See all our data

What share of children die before their fifth birthday?

What could be more tragic than the death of a young child? Child mortality, the death of children under the age of five, is still extremely common in our world today.

The historical data makes clear that it doesn’t have to be this way: it is possible for societies to protect their children and reduce child mortality to very low rates. For child mortality to reach low levels, many things have to go right at the same time: good healthcare, good nutrition, clean water and sanitation, maternal health, and high living standards. We can, therefore, think of child mortality as a proxy indicator of a country’s living conditions.

The chart shows our long-run data on child mortality, which allows you to see how child mortality has changed in countries around the world.

Explore and learn more about this data

Share of population living in extreme povertyWorld Bank

Life expectancy at birthLong-run estimates collated from multiple sources by Our World in Data

Per capita CO₂ emissionsLong-run estimates from the Global Carbon Budget

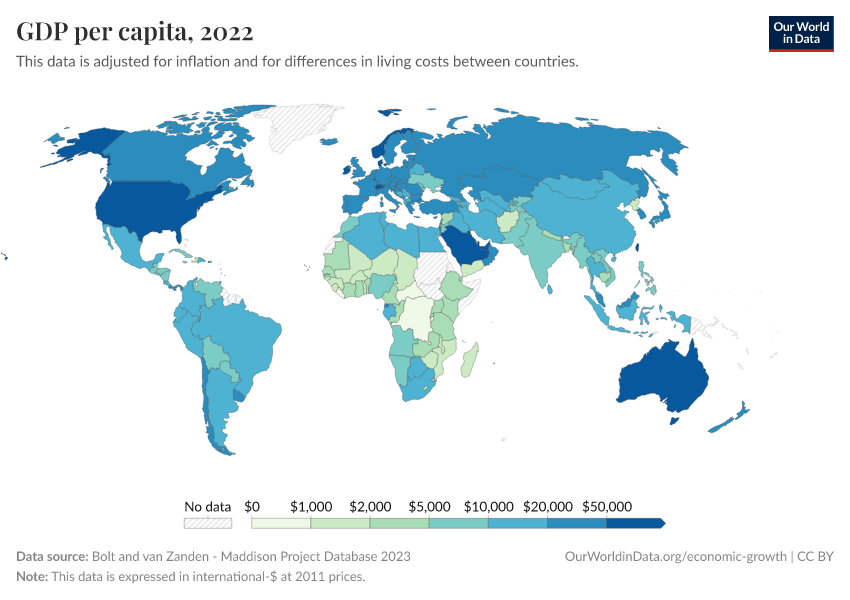
GDP per capitaLong-run estimates from the Maddison Project Database

Share of people that are undernourishedFAO

Literacy rateLong-run estimates collated from multiple sources by Our World in Data

Share of the population with access to electricityWorld Bank

Data explorers

See all our Data Explorers

Interactive visualization tools to explore a wide range of related indicators.

Subscribe to our newsletters

Receive our latest work by email.
By subscribing you are agreeing to the terms of our privacy policy.

All our topics

All our data, research, and writing — topic by topic.

Population and Demographic Change

Health

Energy and Environment

Food and Agriculture

Poverty and Economic Development

Education and Knowledge

Innovation and Technological Change

Living Conditions, Community, and Wellbeing

Human Rights and Democracy

Violence and War