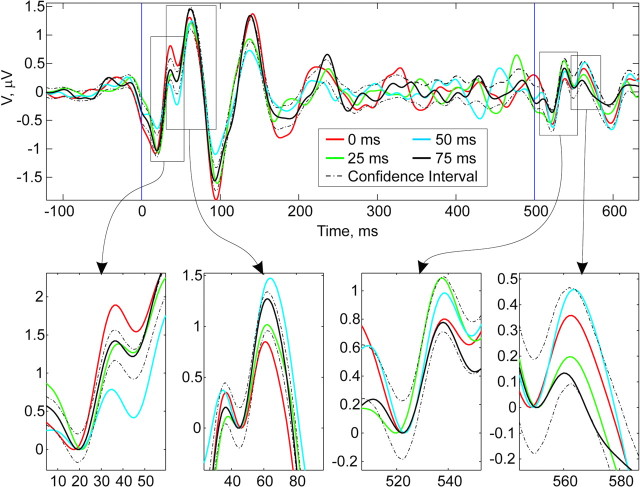
Figure 3.
Grand average results from 20 subjects. Solid lines represent averages at 0 msec (red), 25 msec (green), 50 msec (blue), and 75 msec (black). Dashed lines indicate bootstrapped confidence intervals (p = 0.025). Insets demonstrate increases and decreases in amplitude of P30 at 0 and 50 msec, respectively, and a comparable decrease and increase in P50 amplitude at 0 and 50 msec, respectively. Inset waveforms are aligned as detailed in Materials and Methods. No significant effects of first stimulus phase are seen in P30 and P50 measured at the second stimulus 500 msec later.

