Abstract
Synchronization between CA1 pyramidal neurons was studied using dual-cell patch-clamp techniques simultaneous with an extracellular measurement of network activity. We explored various linear and nonlinear methods to detect weak synchronization in this network, using cross-correlation, mutual information in one and two dimensions, and phase correlation in both broad and narrow band. The linear and nonlinear methods demonstrated different patterns of sensitivity to detect synchrony in this network, depending on the dynamical state of the network. Bursts in 4-amino-pyridine (4AP) were highly synchronous events. Unexpectedly, seizure-like events in 4AP were desynchronous events, both in comparison with interictal periods preceding the seizure without bursts (cut Schaffer collateral tract) and in comparison with bursts preceding the seizures (intact Schaffer collateral tract). The finding that seizure-like events are associated with desynchronization in such networks is consistent with recent theoretical work, suggesting that asynchrony is necessary to maintain a high level of activity in neuronal networks for sustained periods of time and that synchrony may disrupt such activity.
Keywords: seizures, bursts, synchrony, correlation, phase, mutual information, potassium, 4-amino-pyridine
Jackson (1890) proposed that epileptic seizures are caused by an excessive discharge of neurons. In 1954, Penfield and Jasper proposed that the high voltages recorded from epileptic cortex must represent “hypersynchrony” of individual neurons. Since then, it has been generally assumed that “large populations of neurons are activated synchronously during an epileptic seizure” (Kandel et al., 1991).
Nevertheless, there has been little experimental study of the interactions between single neurons necessary to characterize synchronization during seizures. In an extracellular study of human neurons within epileptic cortex (interictal), synchronous firing between single units was “rarely seen” (Wyler et al., 1982). In anin vitro model of hippocampal seizures, qualitative synchronization of GABAergic CA1 interneuronal networks was observed during tetanus-induced seizures and afterdischarges (Perez Velazquez and Carlen, 1999). To our knowledge, there has been no study quantifying the structure of the synchronization between elements of an epileptic network as seizures spontaneously initiate and terminate.
Our tools to detect synchrony in coupled systems are now quite sophisticated. Traditionally, synchrony has been detected through correlation of amplitudes in the time domain using cross-correlation or through correlation of frequencies in the frequency domain using coherence. Each of these linear methods, cross-correlation and coherence, generates significant but spurious indications of synchrony when finite data from uncoupled systems share frequency content. Such spurious findings can be controlled through the use of an estimation of the variance of covariation for uncoupled systems with autocorrelated time series (Bartlett, 1946; Box and Jenkins, 1976) or though prewhitening data (Chatfield, 1989; Ljung and Glad, 1994).
In the past decade, we have come to realize that nonlinear systems can synchronize in very complex ways (Rulkov et al., 1995) and that nonlinear methods of detecting such synchrony may be required (Pecora et al., 1995; Schiff et al., 1996). Phase synchronization may be detected for nonlinear coupled systems when amplitudes are not synchronized (Rosenblum et al., 1996), and phase synchronization has been applied to neuronal systems (Tass et al., 1998; Rodriguez et al., 1999). Such applications of phase have generally been performed by heavily bandpass filtering data and comparing the phases in a “narrow band” (NB). There is little known about the comparison of linear versus nonlinear methods for detecting neuronal synchrony (Schiff et al., 1996).
We first sought to compare various synchrony detection methods in a neuronal network under conditions of weak synchronization. We then applied these tools to an examination of the synchrony that arises in a model that generates both brief burst firing events and more sustained seizure-like events. Our findings were unexpected, revealing that the degree of synchronization during seizure-like events was decreased compared with baseline interictal periods, in contrast to briefer burst-firing events, where synchronization was increased. Synchronization increased as seizures turned off. These findings are consistent with recent theoretical work (Gutkin et al., 2001) suggesting that asynchrony is necessary to maintain a high level of activity in neuronal networks for sustained periods of time and that synchrony may disrupt such activity.
MATERIALS AND METHODS
Experimental preparation. Sprague Dawley rats 10–20 d old were deeply anesthetized with diethyl-ether and decapitated. The brains were removed and placed into chilled artificial CSF (ACSF). Slices 350 μm thick were cut using a tissue chopper and perfused with ACSF containing (in mm): 130 NaCl, 1.2 MgSO4, 3.5 KCl, 1.2 CaCl2, 10 dextrose, 2.5 NaH2PO4, 24 NaHCO3. Slices were aerated with 95% O2–5% CO2 at 7.2 pH in an interface holding chamber until used. For experiments, single slices were transferred to a submersion chamber (Warner Instruments) mounted on a fixed stage microscope (Ziess Instruments, Axioskop).
Weak synchronization in CA1 was created by elevating potassium from 3.5 to 5.5 mm. Strong synchronization, sufficient to generate reliable seizures in CA1, was created by infusing 100–200 μm 4-amino-pyridine (4AP) at normal potassium concentrations. For 4AP experiments in which CA1 seizures were to be isolated from smaller bursts that propagated into the CA1 from CA3, the Schaffer collateral fibers were cut with an eyebrow knife. Such study of seizures in isolation from burst activity is aided by using 4AP rather than high [K+]o to generate the seizure-like events (Barbarosie and Avoli, 1997). We observed similar events with or without low Mg in the perfusate.
Dual simultaneous whole-cell patch-clamp recordings in CA1 were made with differential infrared contrast microscopy (Sakmann and Neher, 1995). Patch electrodes were made from borosilicate micropipettes pulled to 5–7 MΩ and filled with (in mm): 0.1 CaCl, 1.1 EGTA, 2 MgATP, 10 HEPES, 130 potassium gluconate (in potassium experiments), or 130 KCl (in slices bathed with 4AP), 5% biotin, and titrated to pH 7.2 with KOH. Cells selected for patching were between 30 and 200 μm of each other. To prevent spiking, cells in potassium experiments were either voltage clamped (at holding potentials between −50 and −90 mV) or hyperpolarized under current clamp (<100 pA). Experiments in 4AP were performed using current clamp without hyperpolarization, and spikes were prevented by adding 100 μm QX-314 to the electrode solution (Connors, 1982). In 4AP experiments with bursts and seizures, an extracellular electrode was placed in the vicinity of the patched cells to provide a measure of the network ensemble activity. In addition, to bring out synchronous behavior that was both inhibitory and excitatory, recording electrodes in 4AP experiments contained 130 mmchloride to set the chloride reversal potential near 0 mV, making all inhibitory synaptic input depolarizing rather than hyperpolarizing or neutral shunting (Prida and Sanchez-Andres, 1999). In preliminary experiments (data not shown) (in low Mg/4AP), we observed similar depolarizing seizure-like events using patch electrodes without elevated chloride.
Membrane potential was amplified and low-pass filtered at 3 kHz using an Axoclamp 2A amplifier (Axon Instruments), digitized at 10 kHz using a Digidata 1200A analog-to-digital converter (Axon Instruments), and stored using pClamp software (Axon instruments). Before analysis, each window of data analyzed was linearly detrended to improve spectral estimation, detrending the entire window for short windows (<100 msec), and serially detrending for longer data segments. After detrending, the data were bandpass filtered from 1 to 500 Hz and notch filtered at 60 Hz and its harmonics (120, 180,… , 480 Hz).
Power spectral density. Power spectral density (PSD) was calculated after applying a Hanning window and bandpass filtering the data, and total power was calculated by summing the absolute magnitude of the squared Fourier components in frequency bands from 1 to 500 Hz.
Cross-correlation. The sample cross-correlation (CC) between two channels is:
where X1(t) andX2(t) are the two time series of length N, with sample means μ1and μ2, and sample standard deviations ς1 and ς2 (Bendat and Piersol, 1986). This sample CC is equivalent through the Wiener–Khinchine Theorem to the inverse Fourier transform of the product of Fourier transform first time series, X1(ω), times the complex conjugate of the Fourier transform of the second time series, X (ω):
where ⇔ indicates a Fourier transform pair (Press et al., 1992). This formula for cross-correlation was used for computational efficiency.
Because finite length autocorrelated time series will have spurious cross-correlation even if uncoupled, the Bartlett estimator (Bartlett, 1946; Box and Jenkins, 1976) was used to calculate the expected variance of the CC at a given lag l as:
where CCi,i are the autocorrelation values of channel i at lags τ.CC1,2(τ) values were considered significant if they were greater than the twice the expected standard deviation (2 · for lags <100 mS. This confidence represents the probability <0.05 that such aCC1,2(τ) value would be generated from uncoupled time series by chance.
Mutual information. Mutual information (MI) is a measure of how much information is known about the distribution of the values of time series B by knowing how it varies with the distribution of time series A. The information capacity, I, of a single voltage trace, VA(t), is:
where N bins were used to partition the data, andPVA(i) is the probability that the voltage values of time seriesVA will fall within bin i(Shannon and Weaver, 1964). The MI from two channels can be calculated as:
This measure of MI is an estimate that must be less than the true amount of information in the system. This systematic bias can be compensated for by estimating the errors introduced by the partitioning into bins. The corrected MI is:
where BX,BY,BX,Y are the number of bins that have points in them from the A data set,B data set, and the combined data set AB, andN is the number of points in each time series (Roulston, 1999).
Unfortunately, we still lack an analytical means to estimate the variance of these bias-corrected MI values. To estimate the variance and test whether a given MI is significantly different from the uncoupled state, we therefore use a bootstrap statistic. Mutual information at short lags (<100 mS) were compared with mutual information calculated between the channels with randomly selected long lags (>4 sec). These “shift surrogate data” sets were generated by time shifting one data set relative to the other and wrapping the extra values around to the beginning of the data set. Shift surrogates have an advantage in that they preserve the statistical structure of the original time series but destroy the correlations between them. Twenty different time shift lags were chosen randomly with the restriction that time shifts be >4 sec. We considered the MI detected between the two channels significant if the value was greater than two SDs from the mean MI calculated on 20 shift surrogates.
Mutual information in two dimensions. Mutual information can be calculated in more than one dimension. If two data sets are each multivariate in two dimensions (i,j for one data set andk,l for the other) or are univariate but embedded in two dimensions by time-delay embedding (Takens, 1981; Abarbanel, 1996), the MI of the combined system must be calculated in four dimensions. If the systems and their coupling are nonlinear, then MI in higher dimension may reveal the coupling with more sensitivity than the standard univariate approach. Mutual information in two dimensions (MI2D) is calculated as:
For time-delay embedding, delays were chosen on the basis of the decay of mutual information between a signal and a time-shifted version of itself (Frazer and Swinney, 1986).
Phase correlation: broad band. Similar to the correlation between amplitudes measured with CC, phase correlation (PC) measures the correlation between phases. A growing body of work suggests that PC can detect weak correlations in nonlinear neuronal systems to which CC may be insensitive (Tass et al., 1998; Varela et al., 2001).
Our signals are not simple sines and cosines, where the assignment of phase would be straightforward. To assign a phase to each time point of the data, the signal is first passed through a Hilbert transform:
The values of the Hilbert transform become the imaginary part or phase of a new combined signal, X(t) +iH(τ). Such a complex signal can be expressed as an amplitude A(t) and phase ϕ(t), asA(t)eφ(t)where φ(t) = arctan (H(t)/X(t)) (Bendat and Piersol, 1986).
To quantify phase correlation, mutual information was calculated between the phase angles of the two data sets:
whereP(φ ,φ ) is the joint probability that channel A has phase angle φ while channel B has phase angle φ . As above, one time series can be time shifted and a surrogate MI calculated. The phase correlation between the data sets is significant if the MI for the unshifted phase angles is greater than two SDs from the mean calculated from 20 time shift surrogates.
To visually display phase differences between channels i andj, histograms of phase difference,pφi,j(θ),
were calculated modulus 2π. If the signals are uncoupled, such histograms will be flat from uniformly random associations of phase, and if coupled, such histograms will be peaked.
Phase correlation: narrow band. The above description of PC used the Hilbert transform to assign a phase to the original signal that contained all of the relevant frequencies between 0.1 and 500 Hz. The phase assigned was therefore broad band (BB). Nevertheless, phase can be assigned to narrowly bandpass-filtered data, and PC has been used in narrow band analysis in several applications of PC to neural systems (Tass et al., 1998; Varela et al., 2001). Because systems may demonstrate synchronization only in specific frequency bands, for such systems narrow band phase is the preferred method of analysis (DeShazer et al., 2001). Following DeShazer et al. (2001), we created narrow band data by filtering in the Fourier domain with a Gaussian spectral filter with adjustable mean frequency and adjustable variance. There is a balance between the length of the data set and how narrow the bandpass Gaussian filtering can be. A guideline we have found useful is to choose the SD, ς, of the Gaussian filter, such that N · ς/r > 10, where N is the length of the data set and r is the acquisition rate.
Burst detection. Burst-firing events were detected by filtering extracellular recordings between 0.1 and 10 Hz and selecting events by threshold detection. Bursts were required to have minimum and maximum durations of 10 msec and 1 sec, but bursts were generally <100 msec and not observed to last longer than 300 msec. The 1 sec upper limit in duration served to effectively discriminate all seizure-like events from the shorter bursts. A minimum interval was imposed between burst offset and onset of the next burst of 200 msec. Bursts within 5 sec before or 20 sec after a seizure were excluded. All burst onset times were checked by visual inspection and corrected manually if indicated.
Seizure detection. Seizures had complex and variable waveforms, with high-frequency activity superimposed on a DC potential shift, and lasted several seconds. The variability precluded reliable automated onset detection, and all seizure onsets were set by visual inspection as the earliest detectable change associated with the event.
RESULTS
Detection of weak synchronization
The slice CA1 network is minimally coupled in ACSF containing physiological levels of potassium near 3.5 mm. By raising potassium to 5.5 mm, we introduced weak synchronization between neurons in CA1, without generating bursts or seizures. These two potassium levels were used to test the limits of our ability to detect synchronization between neurons using linear (CC) and nonlinear (MI, MI2D, PC) methods.
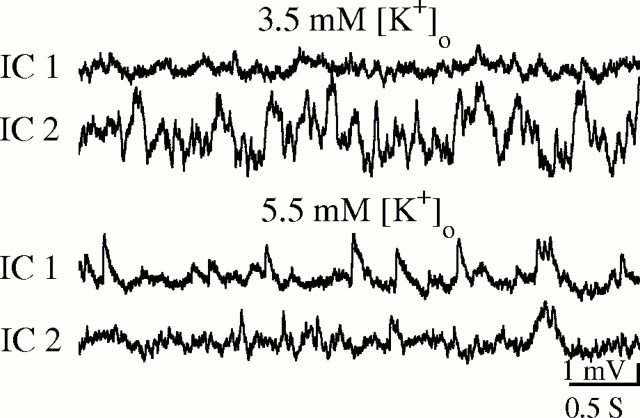
In 18 pairs of pyramidal neurons from the CA1, we compared the synchronization in 3.5 mm[K+]o with the synchronization after raising the [K+]o to 5.5 mm. For each [K+]o level, 40 sec epochs were selected to be artifact free (free of action potentials and baseline shifts), detrended with a 0.5 sec moving average window, and bandpass filtered (1–500 Hz). A sample of data in normal and high potassium is shown in Figure 1.
Fig. 1.
Samples of paired intracellular (IC) records from low 3.5 mm and high 5.5 mm [K+]o.
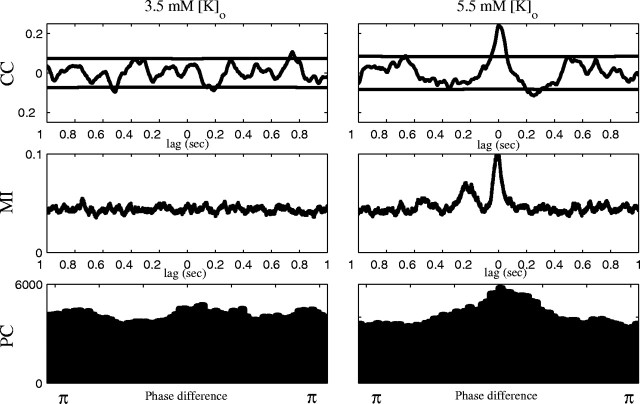
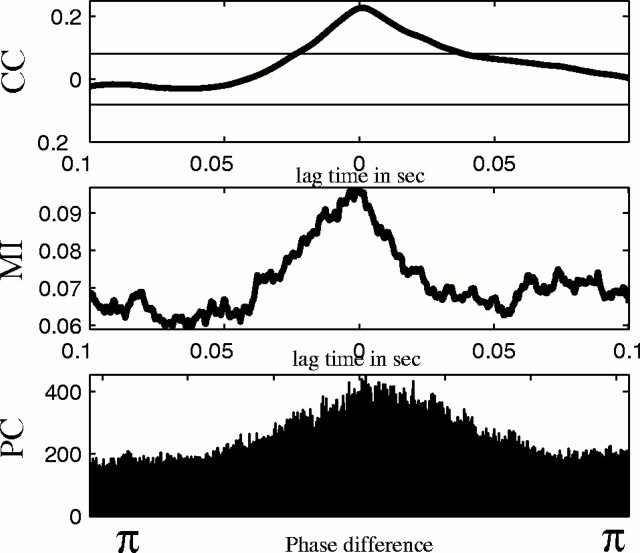
Significantly positive CC (within ±100 msec lag) was found in only 1 of 18 pairs of cells in normal [K+]o, whereas 6 of 18 pairs showed significant CC in high [K+]o (Table1). In all six pairs showing increased CC, none demonstrated an increase in total spectral power that might have confounded these results. An example of a pair of cells demonstrating an increase in CC in elevated but not normal [K+]o is displayed in Figure 2.
Table 1.
Significant synchronization between neuron pairs in normal and high K
| CC | MI | MI2D | PC-BB | PC-NB | Totals | |
|---|---|---|---|---|---|---|
| Norm K | 1 | 0 | 0 | 1 | 8 | 18 |
| High K | 6 | 3 | 4 | 4 | 3 | 18 |
Fig. 2.
Cross-correlation (CC), mutual information (MI), and broad band phase correlation (PC) from pairs of cells in low versus high [K+]o. Heavy black lines in CC demonstrate the Bartlett estimator for significance.
MI was less sensitive than CC. No pairs of cells showed significant MI in normal [K+]o, and only 3 of 18 pairs showed significant MI in high [K+]o. CC detected the coupling in each case where MI was significant (Table 1).
MI2D was slightly more sensitive than MI, detecting significant interaction between 4 of 18 pairs of cells in high [K+]o (Table 1). CC detected the coupling in each case where MI2D was significant (three of the four pairs were detected by MI).
PC in broad band (PC-BB) seemed comparable to MI2D, identifying the coupling in the same four pairs that showed significant MI2D. In addition, PC-BB identified significant interaction in 1 of 18 pairs of neurons in normal [K+]o, which was not corroborated by CC (Table 1).
Phase correlation was also tested in narrow frequency bands (PC-NB). Although only 3 of 18 pairs of cells were significantly coupled in high [K+]o in narrow band, 8 of 18 pairs of cells demonstrated apparent narrow band phase coupling in normal [K+]o (Table 1). Only 1 of these 8 pairs of cells demonstrated corroboration with CC, and as [K+]owas increased, this was the only measure that demonstrated an apparent decrease in correlation (in contrast to the five other methods). We are thus cautious in interpreting these PC-NB results.
Figure 3 illustrates, for a high [K+]o sample that demonstrated significant PC-BB, that narrow band PC can fail to show any region of significant coupling. In this plot, the results of at statistic performed on the difference between the data and the mean of 20 shift surrogates are plotted below, and all frequencies failed to reach significance.
Fig. 3.
Phase correlation in narrow bands of frequency centered on frequencies from 1 to 100 Hz. Surrogate shifted data results with error bars and single points for experimental data (above) and the results of a Student's t test applied to each frequency range below. For this sample, no narrow band frequency range revealed the significant synchronization evident in broad band phase shown in Figure 4.
We illustrate the comparison between broad band and narrow band PC results for these data in Figure 4. In the expanded scale (top half) of Figure 4 are shown the comparison of the phase differences in broad band and narrow bands 6.6 ± 1 and 12 ± 1 Hz. These two narrow band frequency ranges corresponded to two of the tall peaks in the tstatistic of Figure 3. Note in the two raw data tracings in thetopmost panel of Figure 4 that there is a region of clear correlation in amplitudes nearly halfway into the tracing, where the compound synaptic potentials rise and fall together over a period of ∼0.2 sec. The broad band phase difference in the tracing in thesecond panel shows clear phase locking (the trace of differences is flat in this region). No narrow band filter, such as the two shown, captures a phase difference that represents this coupled region well (panels 3–6). Similar results were found for narrow bands twice as wide (data not shown). Indeed, for unimodal events rising from baseline as seen in these synaptic events, Fourier analysis requires an ensemble of sines and cosines, variably shifted in phase, to superimpose and form a basis for such features. Such features are represented as broad band signals, and indeed, we find that broad band phase is required to detect synchronization. The bottom panels show the comparisons between broad and narrow band PC for a longer sample of these data, along with histograms of phase differences for the entire data set shown at the right. In comparison with shift surrogates, only the broad band phase differences were significant.
Fig. 4.

Panels at expanded (above) and compressed (below) time scales showing raw data (top panel), broad band phase difference (second panel), narrow band filtered data at 6.6 ± 1 Hz (third panel) and its phase difference (fourth panel), and narrow band filtered data at 12 ± 1 Hz (fifth panel) and its respective phase difference (bottom panels). Note clear broad band phase locking in the second panel, occurring at the same time as the synchronized synaptic current region near thecenter of the top panel. To theright of the compressed phase difference panels are seen cumulative histograms of the phase difference values. Statistics reveal that only the broad band phase difference histograms are significant compared with shift surrogate results.
Phase locking can also be tested between different narrow band frequency ranges by multiplying the phase angles by ratios of integers n:m: 1:1, 1:2, 1:3, 2:3, 2:1, 3:1, and 3:2. When this was done for the data in Figure 4, PC remained strongest in broad band.
In Figure 5, however, we examine a sample of data for which broad band PC appeared insensitive, yet narrow band PC suggested structure for the 19 Hz band but not for the 22 Hz band (see figure legend for detailed analysis of these tracings).
Fig. 5.
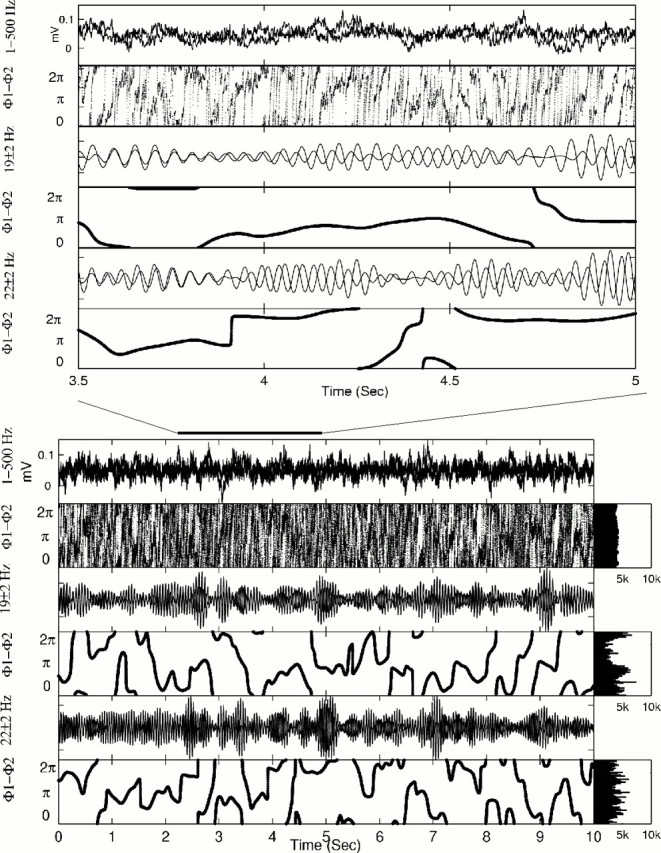
Example displayed as in Figure 4, but showing no significant broad band phase synchronization, yet apparent significant phase correlations for 19 ± 2 Hz. Here, there are no clear features of the scale of the nearly 0.2 sec synaptic current event as was seen in Figure 4. The two narrow band filters, centered on 19 and 22 Hz, reveal different results. In the bottom panels, the histogram to the right of the 19 Hz tracings shows strong peaking just under π radians of phase difference. At expanded time scale, the middle two tracings of the top panels show that there is indeed a region between 4 and 4.5 sec where the phase difference hovers near π. Note that the phase slips before 4 and after 4.5 sec (fourth panel) are reflected in the filtered tracings (third panel). The higher frequency data centered at 22 Hz do not display as much apparent locking near π, and this is reflected in the relatively flat lowest histogram to the right of thebottom set of panels. The broad band histogram is also flat.
It is possible that narrow band PC reveals subtle couplings beyond the limits of detection with other methods. Nevertheless, the lack of corroboration with other linear or nonlinear methods, and the apparent discrepant decrease in synchronization seen as [K+]o is increased, raise the possibility that this method may be generating spurious results. Although a multiple comparison statistic for narrow band results would be useful, we have not yet worked out an adequate test given the nonindependence of the measure for neighboring frequencies. Furthermore, because we have no way of knowing the absolute degree of coupling in these experiments, we have no way of verifying the PC-NB results. We will therefore not use this method in our examination of seizures that follows.
Synchronization of bursts
Networks of the hippocampus in vitro generate brief (<100 msec) population burst firing events at higher levels of [K+]o than used above (Rutecki et al., 1985), under the influence of pharmacological compounds that block inhibitory GABA transmission (bicuculline, picrotoxin) or when subject to 4AP. To reliably generate seizure events as well as bursts, and to be able to separate seizures from bursts by isolating CA1 mechanically, we chose 4AP to generate both bursts and seizure-like events (Barbarosie and Avoli, 1997). These bursts share some physiological similarities with in situepileptic interictal spikes (Pedley and Traub, 1990), although we are cautious in drawing too close a comparison.
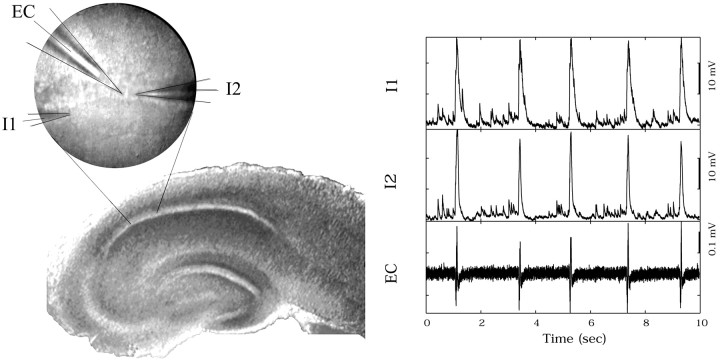
Forty-six pairs of neurons were recorded from 31 hippocampal slices taken from eight rats. Pairs of pyramidal neurons were whole-cell patch clamped in the CA1c near the boarder of CA1 and CA2, where the cell body layer was the densest. Pairs of neurons were selected within 200 μm of each other, averaging ∼60 μm. In 18 slices a pair of cells were patch clamped, and then one electrode was removed and another cell was patched. In two slices this was done twice. Certain cells therefore participated in more than one paired recording, and in total 76 cells were used for 46 pairs. More than 8000 bursts were recorded, with typical interburst intervals ∼1 sec and a range of 0.5–5 sec. Bursts occurring 5 sec before or within 20 sec after a seizure were excluded from analysis. A photograph illustrating two patch-clamp intracellular (IC) electrodes and an extracellular (EC) electrode from a typical experiment is shown in Figure 6, along with a sample of the recordings.
Fig. 6.
Photograph of dual intracellular (IC) patch electrodes and extracellular (EC) electrode. Toright are samples of burst data from this configuration.
No consistent increase or decrease in synchronization, measured by average CC, MI, and PC-BB, was observed as a function of the distance between the patched neurons (30–200 μm).
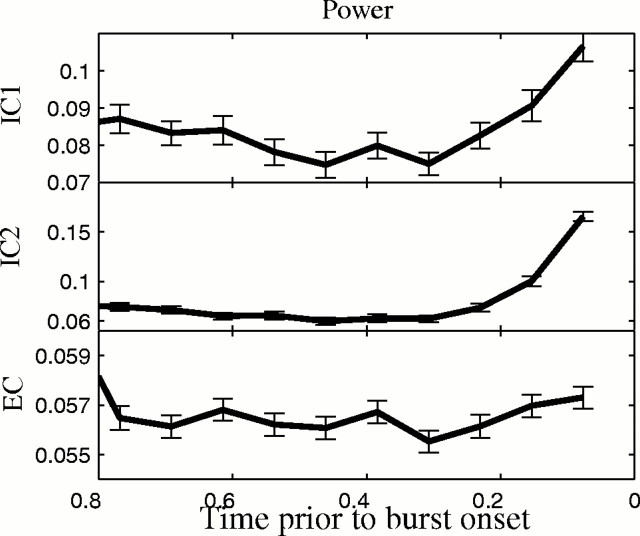
Synaptic currents increased in frequency before bursts as measured by an increase in total spectral power in 75 msec nonoverlapping windows before burst onsets. A significant increase before burst onset was seen in IC recordings from 41 of 76 neurons (54%), using single factorial within subject ANOVA (p < 0.05; df = 9) (Keppel et al., 1992). A similar increase in power was observed before burst onset using EC measurements, where 18 of 31 (58%) slices had a significant change in activity before bursts. Power measured intracellularly and extracellularly before bursts and averaged across 346 bursts in one experiment is shown in Figure7.
Fig. 7.
Spectral power from IC andEC tracings before burst onset.
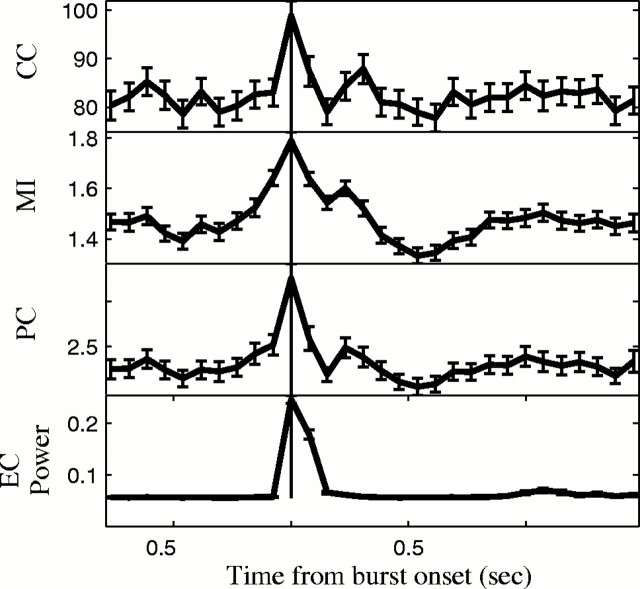
Synchronization between neurons increased before bursts in 23 of 46 pairs (49%). However, the methods that detected synchronization were different from those that detected synchrony best in the low versus high [K+]oexperiments. CC was least sensitive, demonstrating an increase in correlation in 4 of 46 pairs that was significant by ANOVA (p < 0.05; df = 9). PC-BB was slightly more sensitive, showing an increase in synchronization in 12 of 46 pairs, and MI was the most sensitive, identifying that 18 of 46 pairs increased in synchronization before burst onset. Results are shown in Table 2. Correlation surrounding the burst using CC, PC, and MI and averaged across 346 bursts in the same experiment shown in Figure 7 are shown in Figure8.
Table 2.
Significant synchronization between neuron pairs before and during bursts
| N | CC | MI | PC-BB | |
|---|---|---|---|---|
| Pre-burst | ||||
| ICxIC | 46 | 4 | 18 | 12 |
| Intra-burst | ||||
| ICxIC | 46 | 18 | 19 | 21 |
| ICxEC | 76 | 28 | ||
| (ICxEC)xEC-Power | 76 | 51 | 52 | 54 |
| (ICxIC)xEC-Power | 46 | 17 | 21 | 19 |
Fig. 8.
CC, MI,PC, and EC power surrounding burst onset indicated by heavy vertical line.
Bursts are an emergent network phenomenon. Their size represents a combination of the numbers of neurons participating in the event and the degree of synchronization between neurons causing them to constrain their firing within a brief interval of time. To characterize these two aspects of the event, we measured the size of the bursts by the total spectral power within a window 600 msec long centered at the burst onset. We then characterized the cross-correlation between the intracellular voltages within this 600 msec window by summing the absolute values of the CC coefficients for all lags between ±100 msec (there is little contribution to CC outside of these lags). We performed a similar calculation for the CC between each IC voltage time series and the EC voltage time series. The IC–IC correlation samples the strength of synchronization between pairs of neurons participating in the burst, whereas the IC–EC correlation gives an indication of the fraction of neurons participating in the burst. An increase in EC burst size thus presumably reflects an increase in number of neurons recruited into the burst or alternatively an increase in correlation between the neurons. During bursts, synchronization between neurons (IC–IC) increased in 18 of 46 pairs by CC, 19 of 46 pairs by MI, and 21 of 46 pairs by PC-BB. In addition, neurons during bursts were synchronized with the population as reflected in significant IC–EC in 28 of 76 pairs by CC.
Almost all neurons (69 of 76) showed an increase in correlation with the EC activity as burst power increased (Table 2, (ICxEC)xEC-Power). Significant correlation between the neurons that changed with EC burst power was seen in CC (51 of 76), MI (52 of 76), and PC-BB (54 of 76). Thirty-five neurons showed an increase in IC–EC synchronization with all three measures. Of the 69 neurons that showed significant correlation with the extracellular burst, 42 showed no concomitant correlation with the power measured intracellularly and extracellularly, indicating that this increase in synchronization was not an artifact from the simultaneous increase in power in IC and EC recordings.
A substantial fraction of these neuronal pairs (28 of 46) also demonstrated an increase in synchronization with each other as burst power increased (IC–IC synchronization). Significant correlation between IC synchronization and EC burst power (Table 2, (ICxIC)xEC-Power) was seen in CC (17 of 46), MI (21 of 46), and PC-BB (19 of 46). In some pairs of neurons the synchronization actually decreased with EC burst size (14 of 46).
When we examined the activity during the interburst intervals, starting at least 1 sec after a burst and ending 100 msec before the next burst, the synchronization between the intracellular activity and the extracellular activity did not correlate with EC power.
No relationship was found between the strength of the synchronization between the neurons and the distance between the neurons.
Bursts were thus found to be very much a phenomenon of synchronization. Neurons were shown to selectively increase their synchronization before bursts, both with each other and the population as a whole, and the degree of synchronization at the time of the burst was related to the size of the burst.
Synchronization of seizures
The seizure-like events that these in vitro networks produce are more prolonged and seemingly more intense than the bursts. We hypothesized that the degree of synchronization might underlie the difference between these two types of events.
Thirty pairs of neurons were recorded during seizure-like activity from 22 slices taken from eight rats. As with the burst data, some cells were used in more than one pair, and a total of 50 cells were studied.
Seizures occurred approximately once per minute, and a sample recording is shown in Figure 9. Such events lasted several seconds, more than an order of magnitude longer than the bursts. Because we loaded our electrodes with Cl−, we cannot classify the proportion of excitatory versus inhibitory transmitter that contributed to these events. Figure 9A shows recordings from a slice with intact Schaffer collateral fibers, and the appearance of multiple brief bursts along with a prolonged seizure-like event. Figure 9B shows an example from an experiment in which the Schaffer collateral tract was cut, isolating CA1 where seizure-like events were generated without contamination from bursts.
Fig. 9.
Sample dual IC and EC data from 4AP seizure-like events. EC trace is displayed with 20 Hz high-pass filtering to remove DC component. Calibration applies to mainIC and EC traces, whereasinset shows unfiltered recording with DC potential shifts intact. A was recorded from an experiment in which Schaffer collateral fibers were intact, and frequent brief (<100 msec) bursts are observed as well as the seizure-like event.B was recorded from an experiment with cut Schaffer collateral tract, and seizure-like events are here observed without contamination from bursts.
It has been reported that the 4AP model is dependent on the inhibitory activity for seizure generation (Perreault and Avoli, 1989, 1992;Lopantsev and Avoli, 1998). We confirmed this by applying 100 μm picrotoxin to the bath, stopping seizures, which returned after washout. Unlike high [K+]o in vitro seizures (Traynelis and Dingledine, 1988), which are triggered by CA3 activity and often cease when CA1 is isolated, cutting the Schaffer collateral fibers in 4AP permits seizures to continue in isolation from bursts (Barbarosie et al., 2000).
Because we wished to examine the synchronization in the pre-seizure period with and without interference from bursts, 14 pairs of neurons were recorded in slices with uncut Schaffer collaterals, and 16 pairs were recorded with cut Schaffer collaterals.
To measure the interictal synchronization, artifact-free segments 20–40 sec in length were selected from interictal periods in slices with cut Schaffer collateral tracts free of interictal bursts. Strong interictal synchronization was measured by CC, MI, and PC, between the synaptic inputs measured intracellularly in all but two slices (14 of 16) (Table 3). An example of interictal synchronization is shown in Figure10.
Table 3.
Significant interictal synchronization and seizure onset desynchronization between neuron pairs
| N | CC | MI | PC | |
|---|---|---|---|---|
| Interictal synchronization | 18 | 14 | 14 | 14 |
| Seizure onset decrease | 30 | 27 | 28 | 28 |
Fig. 10.
Interictal synchronization measured byCC, MI, and PC in 4AP.
To analyze the seizures, 150 msec nonoverlapping windows starting 3 sec before and extending 4.5 sec after seizure onset were used. To test for changes in dynamics leading up to the seizure, changes in spectral power, CC, PC, and MI were measured in the windows preceding the seizure and tested for significant trends using a within subject ANOVA. No changes in any of these measures were detected in the pre-ictal period. There was no detectable pre-seizure state for these 4AP seizures.
The intracellular records during seizures show a significant DC shift, and this nonstationarity must be removed to measure synchronization. A high-pass filter at 10 Hz was found suitable to remove all traces of this DC drift (Fig. 9, compare EC trace andinset). EC spectral power increased at the onset of the seizure but then decreased rapidly (Fig.11).
Fig. 11.
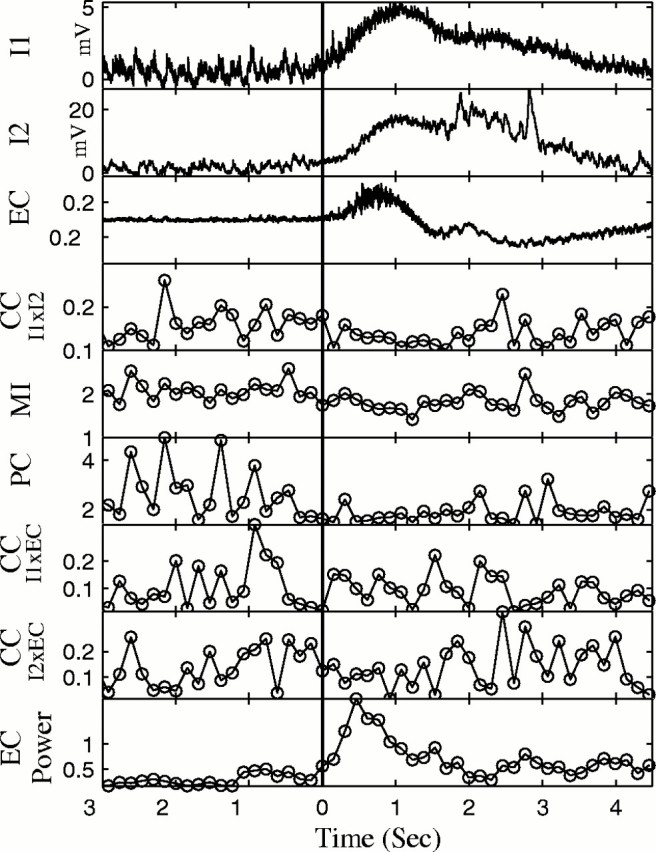
From single seizure, plot of raw IC (I1, I2) and EC data, CCof I1 versus I2, MI,PC (broad band), and CC forI1 versus EC, CC forI2 versus EC, and EC Power. Note the decrease in synchronization between neurons for each method (CC I1 vs I2,MI, and PC).
Synchronization between neurons was measured using CC, PC, and MI. To test for changes in synchronization between the neurons during the seizure, a multifactorial ANOVA was used to compare five windows ending 500 msec before the onset of the seizure with five windows starting 500 msec after the onset of the seizure (p < 0.05; df = 4). Surprisingly, there was a significant decrease in CC between the neurons in 27 of 30 pairs of neurons (Table 3). This decrease in synchronization was corroborated with the PC and MI analyses, each of which documented a significant decrease in synchronization in 28 of 30 pairs during the seizure (Table 3). An example of the desynchronization at seizure onset for one seizure is shown in Figure 11. The averages from 27 seizures from a different experiment are shown in Figure12.
Fig. 12.
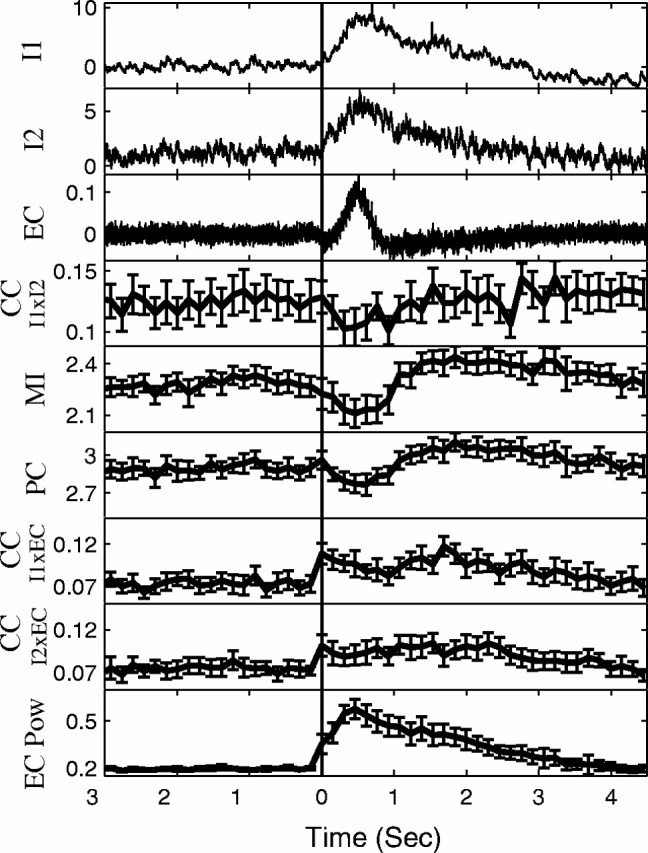
For same parameters as Figure 11, average results for 27 consecutive seizures from a different single experiment. Note consistent decrease in synchronization between neurons (CC I1 vs I2, MI, PC) at seizure onset and increase in synchronization as seizure turns off.
Unlike the correlation between the IC recordings, the correlation between the IC and EC recordings was often (25 of 50 cells) seen to be increased throughout the duration of seizures. An example of this is seen in the averaged results in Figure 12. Note further in Figure 12that although synchronization between cells decreased at seizure initiation, that synchronization increased as the seizure turned off.
To directly compare IC synchronization of bursts with seizures in the same slices, data were studied from the 14 slices in which the Schaffer collateral tract was left intact. Windows 600 msec long were centered on each of the bursts and seizure onsets, and at this long window length, a 20 Hz high-pass filter was required to remove the DC nonstationarity from the seizures. The strength of the CC, measured as the sum of the absolute values at all lags ±100 msec, was compared. The CCs of the seizure onsets were on average 66% of the mean correlation seen during the bursts. Seizure onsets were less synchronized than bursts.
DISCUSSION
We examined how various synchrony detection tools responded to weak synchronization in this neuronal system. Weak synchronization was studied in elevated [K+]o in the period of time before an extracellularly detected burst discharge and in the period of time leading up to seizure-like events. Because neurons are floridly nonlinear elements, and their synaptic connections have nonlinear transmission properties as well, we anticipated that we would easily demonstrate that nonlinear methods are more powerful than the linear tools. Quite the contrary, we found that for elevated [K+]o, linear cross-correlation was more sensitive than any other method for detecting synchronization, whereas in the pre-burst period, nonlinear methods were the best choice. None of these methods detected an increase in synchrony before the seizure-like events, suggesting no well defined pre-seizure state. Our findings suggest strongly that it is a mistake to make a priori assumptions regarding the type of synchrony detection required for a coupled neuronal system. Applying a battery of powerful tests that examine different aspects of dynamical synchronization seems a sensible approach.
With the increasing interest in using phase synchronization for the detection of synchrony, our findings highlight another open issue: relying on broad versus narrow band phase for synchrony detection. In several studies of neuronal data (Tass et al., 1998; Rodriguez et al., 1999), narrow band phase was used. Indeed, in the seminal work demonstrating that phase was a more sensitive determinant of synchronization in weakly coupled nonlinear systems (Rosenblum et al., 1996), the theoretical system that was used was one with a very strongly defined dominant frequency and phase. A similarly strong dominant set of frequencies and phase demonstrated that the synchrony between coupled lasers was best defined in narrow band (DeShazer et al., 2001). Nevertheless, our data clearly demonstrate that when faced with compound synaptic potentials, with features that emerge from the baseline time series with a unidirectional deflection from baseline, that synchronization may be best characterized in broad band. In retrospect, because such unidirectional deflections require superimposition of sines and cosines (the basis functions used to decompose such signals in Fourier analysis) at multiple frequencies, finding that detecting synchronization requires the broad band signal should have come as no surprise.
On the other hand, our findings for narrow band phase correlation were problematic. We identified several instances in low [K+]o where narrow band PC suggested coupling where all other methods failed. However, PC-NB also was the only method that suggested a discrepant decrease in synchronization as [K+]o was elevated. Although it may well be that subtle nonlinear couplings in low [K+]o were identified only with PC-NB, we have proceeded cautiously with this method and did not apply it to the seizure data.
We were careful to use an estimate of the expected cross-correlation if the time series were uncoupled, given the autocorrelation and length of our time series. Although the statistical requirements have been known for more than half a century [Bartlett (1946); see extensive discussion in Jenkins and Watts (1968)], we are hard pressed to find within the vast neuroscience literature examples in which such statistics were applied appropriately to either intracellular or extracellular multi-electrode data. The use of either the variance estimate for uncoupled cross-correlation as we have used here, or prewhitening data with a best linear filter (Chatfield, 1989; Ljung and Glad, 1994), should be routine for correlation analysis of neuronal data.
In human epilepsy several pre-seizure changes occur such as electrodecremental events (Alarcon et al., 1995), linear increases in spectral power (Litt et al., 2001), and nonlinear signal changes (Lehnertz and Elger, 1998; Martinerie et al., 1998). Despite an extensive search, we detected no pre-seizure state in our 4AP seizures.
Bursts in our experiments were found to demonstrate an increase in synchronization between neurons on fast time scales, a degree of synchrony that was not accounted for by the simultaneous increase in synaptic activity measured in the neurons. An increase in synchrony was also detected before bursts. Such gradual buildups for these synchronous events are consistent with other reports in high [K+]o (Chamberlin et al., 1990), 4AP (Perreault and Avoli, 1991), and before spontaneous neonatal bursts (Prida and Sanchez-Andres, 1999).
Completely unexpected was the finding that the seizure-like events in this preparation demonstrated a decrease in synchronization between neurons. Such a decrease in synchrony was detected when compared with the interictal baseline before the seizure, and in preparations with both bursts and seizures, in comparison with the bursts preceding the seizure. There are several lines of evidence, both theoretical and experimental, that are consistent with our findings of a synchrony decrease in such seizures.
Recent theoretical work using computational models suggests that neuronal networks might be capable of sustaining a higher level of population activity if the neurons are asynchronous (Gutkin et al., 2001). Indeed, excessive synchronization of neurons in an ensemble leads to both a communal refractory period, and a unified response from the recurrent inhibitory neurons that are ubiquitous in many regions of cortex and subcortical areas. Additional theoretical work supports the hypothesis that persistent neuronal network activity may require asynchrony (Golomb, 1998). Our findings are the first direct experimental evidence consistent with such theoretical predictions.
Other theoretical work has studied the asynchronous state in networks of strongly coupled neurons (Golomb and Hansel, 2000; van Vreeswijk, 2000). When sparsely coupled networks demonstrate inhomogeneous landscapes of connectivity, increasing coupling serves to increase asynchrony because the coupling becomes strong enough to force the inhomogeneities to dominate the dynamics (Golomb and Hansel, 2000).
In addition, there are converging lines of evidence, both theoretical (Izhikevich, 2000; van Vreeswijk, 2000) and experimental (Elson et al., 1998), that show that as neurons become more strongly coupled they may synchronize on slow time scales (such as bursts), yet remain asynchronous on faster time scales. Our results with seizures may reflect such a phenomenon, because we focused on the synaptic events at faster time scales.
Furthermore, experimental work has shown that the CA1, with direct excitatory connections between pyramidal cells <1% (Bernard and Wheal, 1994; Deuchars and Thomson, 1996), is more sparsely coupled synaptically than CA3, where such connections approach 2–5% of cells (Traub and Miles, 1991). The differences in the degree of connectivity may be intimately related to the generation of bursts in CA3, and seizures in CA1, when subject to the same epileptogenic manipulations whether elevating [K+]o (Traynelis and Dingledine, 1988) or introducing 4AP (Barbarosie and Avoli, 1997).
In addition, there is experimental work demonstrating that the increased synchronization imposed on an epileptic region from bursts may reduce the likelihood of seizures (Bragdon et al., 1992; Barbarosie and Avoli, 1997). Indeed, periodic pacing at the natural frequencies of bursts can suppress seizures in the high [K+]o hippocampal slice (Jerger and Schiff, 1995) or in the 4AP slices when the Schaffer collateral tract is severed (Barbarosie and Avoli, 1997). It is also possible that the desynchronization that we observed at the beginning of these events was related to a GABAergic process similar to the long-lasting depolarization events observed to trigger seizure-like events in entorhinal cortex (Lopantsev and Avoli, 1998).
Our synchronization was measured between synaptic currents in patch-clamped excitatory neurons that had suppressed spike-generating mechanisms. Each neuron thus served to sample the neighborhood of neurons directly connected to it from within the network. Our results suggest that as these seizure-like events initiated and built up, the correlation length within the network shrunk about the neurons, decreasing the apparent synchronization between sampled neuronal pairs. As the seizures abated, our findings are consistent with a simultaneous increase in apparent correlation length within the network. Such a decrease and increase in correlation lengths within this network may be created by the level of activity and synchronization within the inhibitory neuronal network. Examination of the previous work of Perez Velazquez and Carlen (1999) is fully consistent with this idea. In their work, dramatic synchronization was visually evident between the GABAergic interneurons and CA1 pyramidal cells as the seizure-like events matured and turned into afterdischarges before termination (Perez Velazquez et al., 1999, their Figs. 1, 6, 7). In contrast, visual inspection of their data suggests that these tetanus-induced ictal events initiated without such apparent synchronization.
If a decrease in synchronization is essential for the initiation and maintenance of epileptic seizures, and if synchrony is associated with seizure termination, then methods directed at increasing such synchronization may be useful in controlling seizures.
Footnotes
This work was supported by National Institutes of Health Grants K02MH01493, R01MH50006, and F31MH12421. We are grateful to B. Gluckman, R. Breban, L. Pecora, and B. Ermentrout for their helpful discussions.
Correspondence should be addressed Steven J. Schiff, Krasnow Institute, Mail Stop 2A1, George Mason University, Fairfax, VA 22030. E-mail:sschiff@gmu.edu.
REFERENCES
- 1.Abarbanel HDI. Analysis of observed chaotic data. Springer; New York: 1996. [Google Scholar]
- 2.Alarcon G, Binnie CD, Elwes RD, Polkey CE. Power spectrum and intracranial EEG patterns at seizure onset in partial epilepsy. Electroencephalogr Clin Neurophysiol. 1995;94:326–337. doi: 10.1016/0013-4694(94)00286-t. [DOI] [PubMed] [Google Scholar]
- 3.Barbarosie M, Avoli M. CA3-driven hippocampal–entorhinal loop controls rather than sustains in vitro limbic seizures. J Neurosci. 1997;17:9308–9314. doi: 10.1523/JNEUROSCI.17-23-09308.1997. [DOI] [PMC free article] [PubMed] [Google Scholar]
- 4.Barbarosie M, Louvel J, Kurcewicz I, Avoli M. CA3-released entorhinal seizures disclose dentate gyrus epileptogenicity and unmask a temporoammonic pathway. J Neurophysiol. 2000;83:1115–1124. doi: 10.1152/jn.2000.83.3.1115. [DOI] [PubMed] [Google Scholar]
- 5.Bartlett MS (1946) On the theoretical specification and sampling properties of autocorrelated time-series. J R Statist Soc B8:27–41.
- 6.Bendat JS, Piersol AG. Random data: analysis and measurement procedures, Ed 2. Wiley; New York: 1986. [Google Scholar]
- 7.Bernard C, Wheal HV. Model of local connectivity patterns in CA3 and CA1 areas of the hippocampus. Hippocampus. 1994;4:497–529. doi: 10.1002/hipo.450040502. [DOI] [PubMed] [Google Scholar]
- 8.Box GEP, Jenkins GM. Time series analysis: forecasting and control, Revised Ed. Holden-Day; San Francisco: 1976. [Google Scholar]
- 9.Bragdon AC, Kojima H, Wilson WA. Suppression of interictal bursting in hippocampus unleashes seizures in entorhinal cortex: a proepileptic effect of lowering [K+]o and raising [Ca2+]o. Brain Res. 1992;590:128–135. doi: 10.1016/0006-8993(92)91088-v. [DOI] [PubMed] [Google Scholar]
- 10.Chamberlin NL, Traub RD, Dingledine R. Role of EPSPs in initiation of spontaneous synchronized burst firing in rat hippocampal neurons bathed in high potassium. J Neurophysiol. 1990;64:1000–1008. doi: 10.1152/jn.1990.64.3.1000. [DOI] [PubMed] [Google Scholar]
- 11.Chatfield C. The analysis of time series: an introduction, Ed 4. Chapman and Hall; New York: 1989. [Google Scholar]
- 12.Connors BW, Prince DA. Effects of local anesthetic QX-314 on the membrane properties of hippocampal pyramidal neurons. J Pharmacol Exp Ther. 1982;220:476–481. [PubMed] [Google Scholar]
- 13.DeShazer DJ, Breban R, Ott E, Roy R. Detecting phase synchronization in a chaotic laser array. Physical Rev Lett. 2001;87:044101. doi: 10.1103/PhysRevLett.87.044101. [DOI] [PubMed] [Google Scholar]
- 14.Deuchars J, Thomson AM. CA1 pyramid-pyramid connections in rat hippocampus in vitro: dual intracellular recordings with biocytin filling. Neuroscience. 1996;74:1009–1018. doi: 10.1016/0306-4522(96)00251-5. [DOI] [PubMed] [Google Scholar]
- 15.Elson RC, Selverston AI, Huerta R, Rulkov NF, Ravinovich MI, Abarbanel HDI. Synchronous behavior of two coupled biological neurons. Physical Rev Lett. 1998;81:5692–5695. [Google Scholar]
- 16.Frazer AM, Swinney HL. Independent coordinates for strange attractors from mutual information. Phys Rev A. 1986;33:1134–1140. doi: 10.1103/physreva.33.1134. [DOI] [PubMed] [Google Scholar]
- 17.Golomb D. Models of neuronal transient synchrony during propagation of activity through neocortical circuitry. J Neurophysiol. 1998;79:1–12. doi: 10.1152/jn.1998.79.1.1. [DOI] [PubMed] [Google Scholar]
- 18.Golomb D, Hansel D. The number of synaptic inputs and the synchrony of large, sparse neuronal networks. Neural Comput. 2000;12:1095–1139. doi: 10.1162/089976600300015529. [DOI] [PubMed] [Google Scholar]
- 19.Gutkin BS, Lang CR, Colby CL, Chow CC, Ermentrout GB. Turning on and off with excitation: the role of spike-timing asynchrony and synchrony in sustained neural activity. J Comput Neurosci. 2001;11:121–134. doi: 10.1023/a:1012837415096. [DOI] [PubMed] [Google Scholar]
- 20.Izhikevich E M. Neural excitability, spiking and bursting. Int J Bifurcation Chaos. 2000;10:1171–1266. [Google Scholar]
- 21.Jenkins GM, Watts DG. Spectral analysis and its applications. Holden-Day; San Francisco: 1968. [Google Scholar]
- 22.Jerger K, Schiff SJ. Periodic pacing an in vitro epileptic focus. J Neurophysiol. 1995;73:876–879. doi: 10.1152/jn.1995.73.2.876. [DOI] [PubMed] [Google Scholar]
- 23.Kandel ER, Schwartz JH, Jessell TM. Principles of neural science, Ed 3. Appleton and Lange; Norwalk, CT: 1991. [Google Scholar]
- 24.Keppel G, Saufley WH, Tokunaga H. Introduction to design and analysis: a student's handbook, Ed 2. W. H. Freeman; New York: 1992. [Google Scholar]
- 25.Lehnertz K, Elger C. Can epileptic seizures be predicted? Evidence from nonlinear time series analysis of brain electrical activity. Physical Rev Lett. 1998;80:5019–5026. [Google Scholar]
- 26.Litt B, Esteller R, Echauz J, D'Alessandro M, Shor R, Henry T, Pennell P, Epstein C, Bakay R, Dichter M, Vachtsevanos G. Epileptic seizures may begin hours in advance of clinical onset: a report of five patients. Neuron. 2001;30:51–64. doi: 10.1016/s0896-6273(01)00262-8. [DOI] [PubMed] [Google Scholar]
- 27.Ljung L, Glad T. Modeling of dynamic systems. PTR Prentice Hall; Englewood Cliffs, NJ: 1994. [Google Scholar]
- 28.Lopantsev V, Avoli M. Participation of GABAa-mediated inhibition in ictallike discharges in the rat entorhinal cortex. J Neurophysiol. 1998;79:352–360. doi: 10.1152/jn.1998.79.1.352. [DOI] [PubMed] [Google Scholar]
- 29.Martinerie J, Adam C, Le Van Quyen M, Baulac M, Clemenceau S, Renault B, Varela FJ. Epileptic seizures can be anticipated by non-linear analysis. Nat Med. 1998;4:1173–1176. doi: 10.1038/2667. [DOI] [PubMed] [Google Scholar]
- 30.Pecora LM, Carroll TL, Heagy JF. Statistics for mathematical properties of maps between time series embeddings. Phys Rev E. 1995;52:3420–3439. doi: 10.1103/physreve.52.3420. [DOI] [PubMed] [Google Scholar]
- 31.Pedley TA, Traub RD. Physiological basis of EEG. In: Daly DD, Pedley TA, editors. Current practice of clinical electroencephalography, Ed 2. Raven; New York: 1990. pp. 107–137. [Google Scholar]
- 32.Perez Velazquez JL, Carlen PL. Synchronization of GABAergic interneuronal networks during seizure-like activity in the rat horizontal hippocampal slice. Eur J Neurosci. 1999;11:4110–4118. doi: 10.1046/j.1460-9568.1999.00837.x. [DOI] [PubMed] [Google Scholar]
- 33.Perreault P, Avoli M. Effects of low concentrations of 4-aminopyridine on CA1 pyramidal cells of the hippocampus. J Neurophysiol. 1989;61:953–970. doi: 10.1152/jn.1989.61.5.953. [DOI] [PubMed] [Google Scholar]
- 34.Perreault P, Avoli M. Physiology and pharmacology of epileptiform activity induced by 4- aminopyridine in rat hippocampal slices. J Neurophysiol. 1991;65:771–785. doi: 10.1152/jn.1991.65.4.771. [DOI] [PubMed] [Google Scholar]
- 35.Perreault P, Avoli M. 4-aminopyridine-induced epileptiform activity and a GABA-mediated long- lasting depolarization in the rat hippocampus. J Neurosci. 1992;12:104–115. doi: 10.1523/JNEUROSCI.12-01-00104.1992. [DOI] [PMC free article] [PubMed] [Google Scholar]
- 36.Press WH, Teukolsky SA, Vetterling WT, Flannery BP. Numerical recipes, Ed 2. Cambridge UP; Cambridge, MA: 1992. [Google Scholar]
- 37.Prida LM, Sanchez-Andres JV. Nonlinear frequency-dependent synchronization in the developing hippocampus. J Neurophysiol. 1999;82:202–208. doi: 10.1152/jn.1999.82.1.202. [DOI] [PubMed] [Google Scholar]
- 38.Rodriguez E, George N, Lachaux JP, Martinerie J, Renault B, Varela FJ. Perception's shadow: long-distance synchronization of human brain activity. Nature. 1999;397:430–433. doi: 10.1038/17120. [DOI] [PubMed] [Google Scholar]
- 39.Rosenblum MG, Pikovsky AS, Kurths J. Phase synchronization of chaotic oscillators. Physical Rev Lett. 1996;76:1804–1807. doi: 10.1103/PhysRevLett.76.1804. [DOI] [PubMed] [Google Scholar]
- 40.Roulston MS. Estimating the errors on measured entropy and mutual information. Physica D. 1999;125:285–294. [Google Scholar]
- 41.Rulkov NF, Sushchik MM, Tsimring LS, Abarbanel HDI. Generalized synchronization of chaos in directionally coupled chaotic systems. Phys Rev E. 1995;512:980–994. doi: 10.1103/physreve.51.980. [DOI] [PubMed] [Google Scholar]
- 42.Rutecki PA, Lebeda FJ, Johnston D. Epileptiform activity induced by changes in extracellular potassium in hippocampus. J Neurophysiol. 1985;54:1363–1374. doi: 10.1152/jn.1985.54.5.1363. [DOI] [PubMed] [Google Scholar]
- 43.Sakmann B, Neher E. Single-channel recording, Ed 2. Plenum; New York: 1995. [Google Scholar]
- 44.Schiff SJ, Chang T, Burke RE, Sauer T. Detecting dynamical interdependence and generalized synchrony through mutual prediction in a neural ensemble. Phys Rev E. 1996;54:6709–6724. doi: 10.1103/physreve.54.6708. [DOI] [PubMed] [Google Scholar]
- 45.Shannon CE, Weaver W. The mathematical theory of communication. University of Illinois; Urbana, IL: 1964. [Google Scholar]
- 46.Takens F. Detecting strange attractors in turbulence. In: Rand D, Young LS, editors. Dynamical systems and turbulence, Warwick 1980: proceedings of a symposium held at the University of Warwick 1979/80, Dold A, Eckman B Edition. Springer; New York: 1981. pp. 366–381. [Google Scholar]
- 47.Tass P, Rosenblum MG, Weule J, Kurths J, Pikovsky A, Volkmann J, Schnitzler A, Freund H-J. Detection of n:m phase locking from noisy data: application to magnetoencephalography. Physical Rev Lett. 1998;81:3291–3294. [Google Scholar]
- 48.Traub RD, Miles R. Neuronal networks of the hippocampus. Cambridge UP; New York: 1991. [Google Scholar]
- 49.Traynelis SF, Dingledine R. Potassium-induced spontaneous electrographic seizures in the rat hippocampal slice. J Neurophysiol. 1988;59:259–276. doi: 10.1152/jn.1988.59.1.259. [DOI] [PubMed] [Google Scholar]
- 50.van Vreeswijk C. Analysis of the asynchronous state in networks of strongly coupled oscillators. Physical Rev Lett. 2000;84:5110–5113. doi: 10.1103/PhysRevLett.84.5110. [DOI] [PubMed] [Google Scholar]
- 51.Varela F, Lachaux JP, Rodriguez E, Martinerie J. The brainweb: phase synchronization and large-scale integration. Nat Rev Neurosci. 2001;2:229–239. doi: 10.1038/35067550. [DOI] [PubMed] [Google Scholar]
- 52.Wyler AR, Ojemann GA, Ward AA. Neurons in human epileptic cortex: correlation between unit and EEG activity. Ann Neurol. 1982;11:301–308. doi: 10.1002/ana.410110311. [DOI] [PubMed] [Google Scholar]


