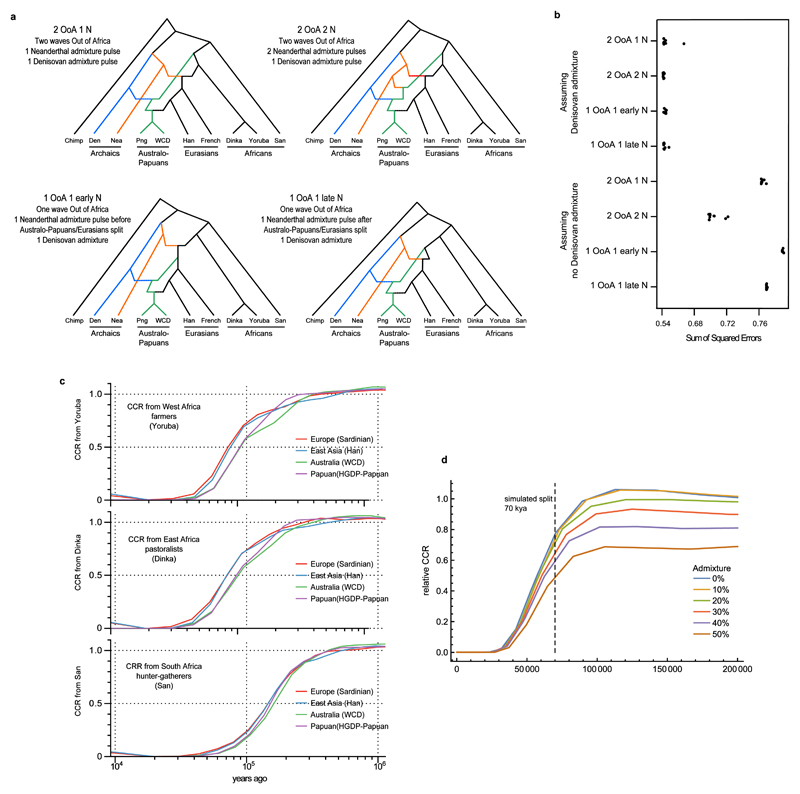
Extended Data Figure 4. Out of Africa: admixture graphs based on D-statistic and MSMC analyses.
a, Admixture graphs representing some of the topologies considered for the two waves and one wave Out of Africa models assuming Denisovan admixture. All topologies are identical except for the coloured lineages representing Australo-Papuans (green), Neanderthal (Nea, orange) and Denisovan (Den, blue). The graphs differ in (i) the number of OoA events, and (ii) the number of Neanderthal admixture pulses. Png stands for HGDP-Papuan. b, Sum of Squared Errors between the observed D-statistics and the expectations for each quartet in the graph involving the chimpanzee as an outgroup for each of the admixture graphs shown in a and the corresponding four without Denisovan admixture. Each point is the result of the optimization procedure with different starting points. See S09 for details. c, MSMC analyses. Relative cross coalescence rate (CCR) estimates from MSMC25 for pairs of individuals including one African sample (Yoruba, Dinka and San) and one other sample from Eurasia, as indicated in the legend. d, Simulation study to assess the effect of archaic admixture on the CCR rates. Relative CCR estimated for data simulated under a simple two population divergence model where one of the populations admixed at different rates with an archaic population. See S08 for details.

