Estimation of Soil Heavy Metal Content Using Hyperspectral Data


1
College of Natural Resources and Environment, South China Agricultural University, Guangzhou 510642, China
2
Department of Geography and Environmental Resources, College of Liberal Arts, Southern Illinois University Carbondale (SIUC), Carbondale, IL 62901, USA
3
Guangdong Provincial Key Laboratory of Land Use and Consolidation, South China Agricultural University, Guangzhou 510642, China
4
Guangdong Province Engineering Research Center for Land Information Technology, South China, Agricultural University, Guangzhou 510642, China
5
Key Laboratory of Construction Land Transformation, Ministry of Land and Resources, South China Agricultural University, Guangzhou 510642, China
6
College of Agriculture and Animal Husbandry, Qinghai University, Xining 810016, China
*
Author to whom correspondence should be addressed.
Remote Sens. 2019, 11(12), 1464; https://doi.org/10.3390/rs11121464
Submission received: 26 April 2019
/
Revised: 7 June 2019
/
Accepted: 17 June 2019
/
Published: 20 June 2019
(This article belongs to the Special Issue Applications of Spectroscopy in Agriculture and Vegetation Research)
Abstract
:Quickly and efficiently monitoring soil heavy metal content is crucial for protecting the natural environment and for human health. Estimating heavy metal content in soils using hyperspectral data is a cost-efficient method but challenging due to the effects of complex landscapes and soil properties. One of the challenges is how to make a lab-derived model based on soil samples applicable to mapping the contents of heavy metals in soil using air-borne or space-borne hyperspectral imagery at a regional scale. For this purpose, our study proposed a novel method using hyperspectral data from soil samples and the HuanJing-1A (HJ-1A) HyperSpectral Imager (HSI). In this method, estimation models were first developed using optimal relevant spectral variables from dry soil spectral reflectance (DSSR) data and field observations of soil heavy metal content. The relationship of the ratio of DSSR to moisture soil spectral reflectance (MSSR) with soil moisture content was then derived, which built up the linkage of DSSR with MSSR and provided the potential of applying the models developed in the laboratory to map soil heavy metal content at a regional scale using hyperspectral imagery. The optimal relevant spectral variables were obtained by combining the Boruta algorithm with a stepwise regression and variance inflation factor. This method was developed, validated, and applied to estimate the content of heavy metals in soil (As, Cd, and Hg) in Guangdong, China, and the Conghua district of Guangzhou city. The results showed that based on the validation datasets, the content of Cd could be reliably estimated and mapped by the proposed method, with relative root mean square error (RMSE) values of 17.41% for the point measurements of soil samples from Guangdong province and 17.10% for the Conghua district at the regional scale, while the content of heavy metals As and Hg in soil were relatively difficult to predict with the relative RMSE values of 32.27% and 28.72% at the soil sample level and 51.55% and 36.34% at the regional scale. Moreover, the relationship of the DSSR/MSSR ratio with soil moisture content varied greatly before the wavelength of 1029 nm and became stable after that, which linked DSSR with MSSR and provided the possibility of applying the DSSR-based models to map the soil heavy metal content at the regional scale using the HJ-1A images. In addition, it was found that overall there were only a few soil samples with the content of heavy metals exceeding the health standards in Guangdong province, while in Conghua the seriously polluted areas were mainly distributed in the cities and croplands. This study implies that the new approach provides the potential to map the content of heavy metals in soil, but the estimation model of Cd was more accurate than those of As and Hg.
1. Introduction
Soil heavy metal pollution is of great concern. In China, the last two decades of anthropogenic activities, such as industrial pollution, livestock wastewater, mine drainage, and chemical pesticides, have led to heavy metal pollution in soil. Especially in farmlands, heavy metal pollution not only destroys the normal function of soils and hinders crop growth, but also endangers human health through the food chain [1,2]. As one of the most rapidly developing areas in China, Guangdong province is facing the serious problem of soil contamination, where it has been estimated that 40% of the soils in the Pearl River Delta are polluted by heavy metals [3]. Therefore, it is very important to devise methods to accurately and timely monitor soil heavy metal content and map their spatial distributions.
The conventional method of estimating soil heavy metal content is based on a regular soil sampling design with a soil measurement depth of 0–5 cm and subsequent chemical analysis of the sampled soils in the laboratory, followed by geostatistical interpolation of the data to obtain the spatial distributions of soil heavy metal content [4,5,6]. However, this method is time-consuming and costly and cannot provide accurate estimates of soil heavy metal content over large areas [7,8]. Remote sensing technologies can rapidly lead to spatially explicit estimates of soil heavy metal content and monitor their dynamics at a regional scale with low cost. At present, because soil spectral reflectance is a cumulative property which derives from the inherent spectral behaviors of the heterogeneous combination of soil’s physical and chemical properties, hyperspectral visible and near-infrared reflectance (VNIR) spectroscopy coupled with calibration techniques has been developed to predict various soil properties and soil heavy metal content [9,10,11,12]. In contrast with traditional in situ measurements of soil heavy metal content, hyperspectral remote sensing techniques provide advantages in rapidly monitoring soil heavy metal content at a regional scale, such as near real-time detection, relatively low cost, and environmental friendliness [9,10,11,12,13,14,15,16,17]. These methods mainly use a 0–5 cm soil sampling depth, which does not result in a reliable measurement of soil heavy metal content in the studied areas because the distributions of heavy metals in soils are not homogenous from the surface (0 m) to the depth (1 m) [18,19]. Soil samples should be taken from layers deeper than 5 cm [18,19]. On the other hand, the VNIR portion of light has a limited capacity of penetration and the shortwave infrared spectrum is often needed to obtain spectral reflectance and absorption information of soil heavy metal contents from soil layers deeper than 5 cm [18,19].
The present calibration techniques of hyperspectral estimation models for the determination of heavy metal content can be divided into two categories: statistical analysis models [20,21] and machine-learning models [21,22,23]. However, these studies mainly focus on building relationships between soil heavy metal content and soil hyperspectral data, without considering the effect of soil water. Soil water has strong absorption features over the VNIR region [24], which may interfere with the generation of accurate hyperspectral estimation models. Moreover, the soils that are characterized or polluted by different heavy metals have different features of spectral reflectance and absorption over wavelengths [17,25,26]. In addition, the estimation models of soil heavy metal content are often developed based on spectral variables from hyperspectral data obtained from soil samples in the laboratory. It is very challenging to make the lab-derived models based on soil samples applicable to mapping the contents of heavy metals in soil using hyperspectral imagery at regional scales. The reasons for this include that soil is a complex system, different soils have their own characteristics of spectral reflectance and absorption, and a soil’s properties cannot be easily assessed using spectral reflectance curves, even under controlled laboratory conditions [27,28]. Thus, applying the lab-derived relationships to regional and national scales is problematic because the quality of space-borne and airborne hyperspectral data is often greatly affected by sensors, atmospheric conditions, and soil surface conditions such as vegetation cover [29,30]. Thus, there is a strong need to build up the linkage of lab-derived estimation models with the characteristics of soil properties in the field, such as soil moisture content, to make it possible to generate digital maps of soil heavy metal contents [31].
The objective of this study was to develop a novel method for estimating and mapping soil heavy metal (As, Cd, and Hg) content using hyperspectral data. In this method, in addition to developing the estimation models using the selected spectral variables derived from dry soil spectral reflectance (DSSR) in the laboratory, we explored the ratio relationship of DSSR to moisture soil spectral reflectance (MSSR) with soil moisture content, which would lead to the linkage of DSSR with MSSR for the estimation and mapping of soil heavy metal content. This method provides the potential for applying the lab-derived models to mapping the soil heavy metal contents at a regional scale. This method was examined in Guangdong, China and the Conghua district of Guangzhou city using both hyperspectral data collected in the laboratory and HuanJing-1A (HJ-1A) HyperSpectral Imager (HSI) images.
2. Materials and Methods
2.1. Study Area and Data
The study area for building the optimal hyperspectral estimation model of soil heavy metal (As, Cd, and Hg) content was located in Guangdong Province of South China, within 20.13′–25.31′N and 109.39′–117.19′E, and had an area of about 179,700 km2 (Figure 1). Guangdong has a humid subtropical monsoon climate, characterized by warm winters, hot summers, little frost or snow, and sufficient rain and sunshine, with an annual average temperature of 19–24 °C and a mean annual rainfall between 1300 mm and 2500 mm. As a commercially developed area, Guangdong has abundant naturally occurring non-ferrous metals and rare metal resources, and has become one of the most heavily contaminated areas in China. In the area, 65 training soil samples (black points in Figure 1) and 15 validation soil samples (cyan points in Figure 1) were collected and located using the global positioning system (GPS) during 22–24 June 2015 [32].
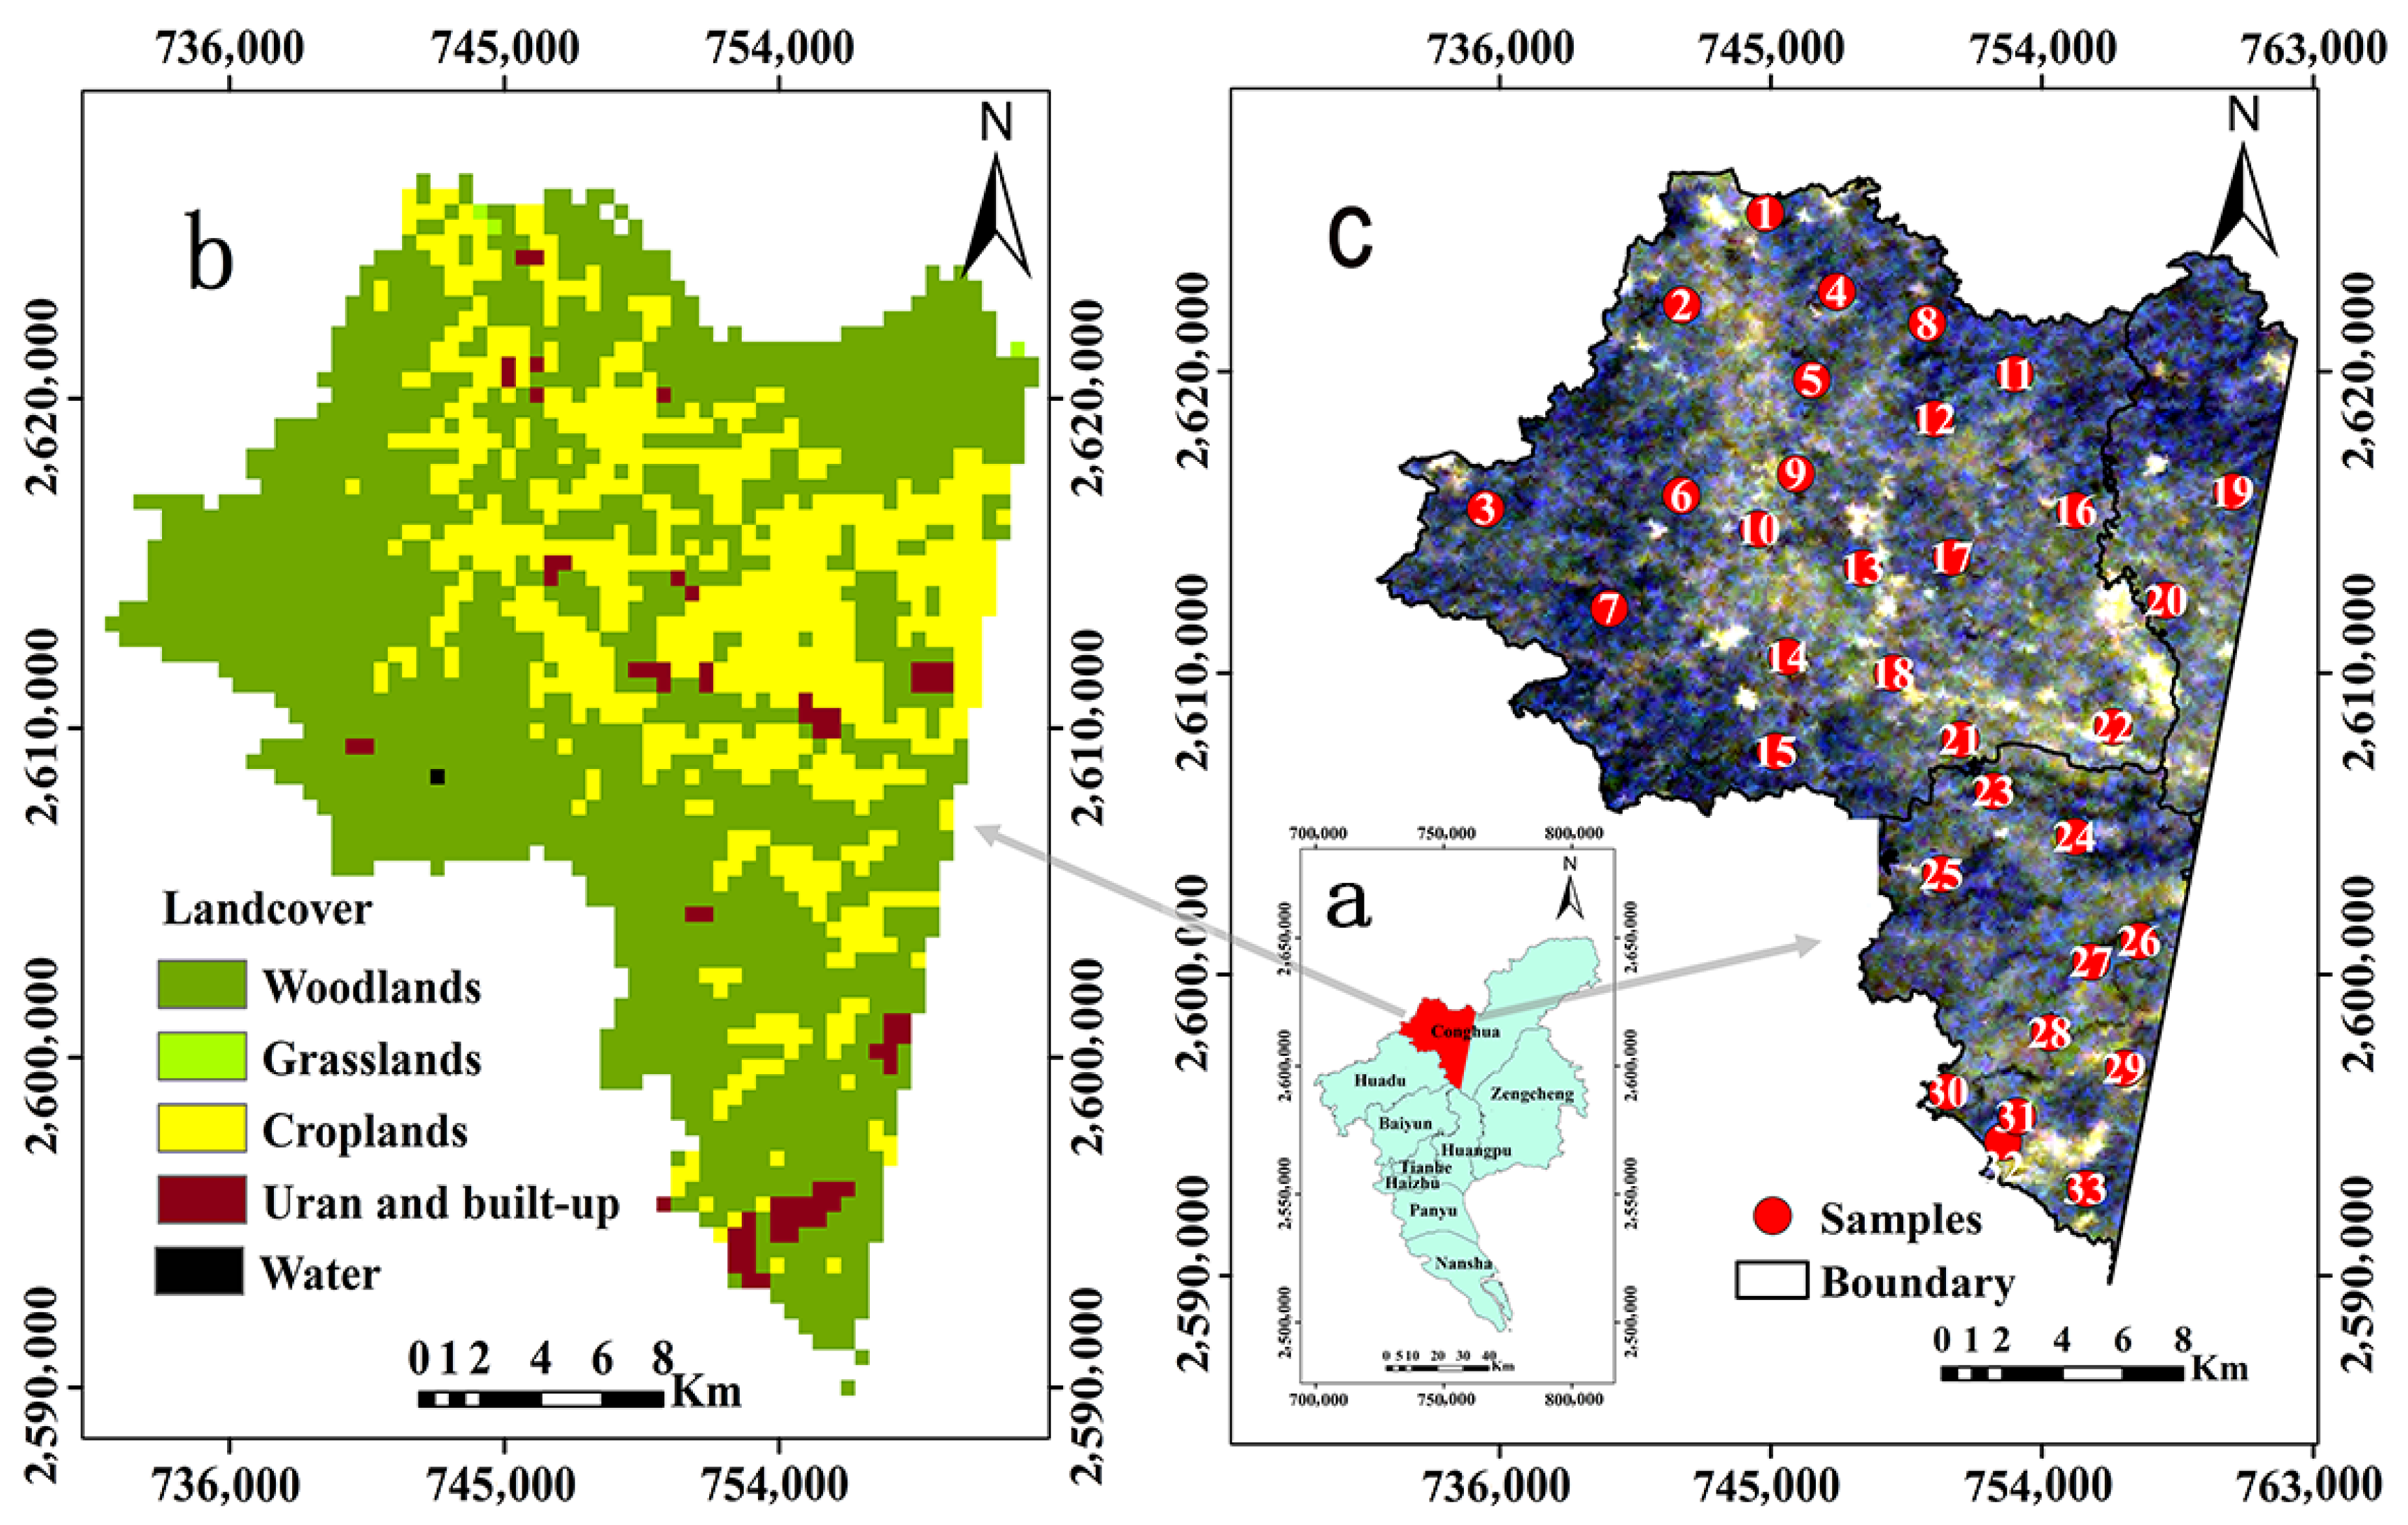
The study area for testing the optimal hyperspectral estimation models was located in the Conghua district of Guangzhou city, Guangdong (Figure 2a). The study area mainly consisted of woodlands surrounding the district, croplands distributed in the areas from the north to the central and eastern parts, and urbanized and built-up areas in the central eastern and southern parts, with grasslands and water bodies scattered (Figure 2b). There are two rivers, with one running from the northeast along the eastern portion to the south and another running from the west to the east, where it merges with the first one (Figure 2c). A total of 33 soil samples (red points in Figure 2c) were collected and located using GPS on 30 October 2017. In order to validate the application of the established models with hyperspectral satellite data, an HJ-1A image was acquired for 30 October 2017. The HJ-1A data had a total of 115 bands, covering a spectrum of 459–956 nm with a spectral resolution of 5 nm. Atmospheric correction of the HJ-1A image was conducted using the Fast Line-of-sight Atmospheric Analysis of Hypercubes (FLAASH) model. Its geometric precision correction was conducted using a quadratic polynomial calculation model and a cubic convolution interpolation method. The calibration error was within 0.5 pixels.
2.2. Soil Samples
In this study, a total of 80 soil samples were collected, based on a 50 km × 50 km sampling grid of Guangdong province with an enhanced sampling in the densely populated and potentially contaminated areas (Figure 1). Moreover, the sampling design also considered different soil types. Soil samples of about 300 g were collected at a soil layer depth of 0–20 cm. Out of the 80 soil samples, 65 samples were randomly selected and used for model development and the remaining 15 for model validation. The method to collect the soil samples was similar to the method described next. Moreover, another dataset of 33 sample plots in the Conghua district of Guangzhou, Guangdong province, was employed to assess the accuracy of the predicted soil heavy metal content. Each of the sample plots had an area of 200 m × 200 m, corresponding to the spatial resolution of the HJ-1A data. Within each of the sample plots, soil samples were collected at five points and put together. One of the five points was located at the plot center and other four points were allocated along the diagonal lines of the plot and with an equal distance between the points. The plots were located using GPS [32].
The collected soil samples were air-dried at room temperature for three days and sieved through a 2 mm polyethylene sieve to remove stones and other large debris. Then, the soil samples were ground into fine particles in an agate mortar. In the study, the soil samples were air-dried at 40 °C for 24 h to standardize the moisture level and were immediately placed in a desiccator for at least 24 h until the spectral measurements were made, without altering soil composition [33]. In order to minimize the impacts of particle size on soil spectral reflectance, the ground soil samples were passed through a 20-mesh sieve (0.84 mm). The soil samples were then oven-dried at 105 °C for 24 h. The treatments would not lead to a change in soil texture and composition. The moist and dry soil samples were weighted to measure soil moisture content.
In addition, the moisture soil samples were digested with an electric heating board acid (HCL-HNO-3-HCLO4) [34] and processed through atomic fluorescence spectrometry to determine the content of Hg and As. Flame atomic absorption spectrometry was used to acquire the Cd content. The statistics of the soil heavy metal content from the 65 soil samples is shown in Table 1. In addition, the background values of Guangdong province and national health standard values [35] are also listed in Table 1, showing that overall the sample means were much lower than the health standard values, but the coefficients of variation were large.
2.3. Spectral Measurements and Preprocessing
The soil spectral reflectance was measured using an AvaField portable spectrometer (Avantes, Inc., Apeldoorn, Holland) with a wavelength range of 340 nm to 2511 nm and a sampling interval of 0.6 nm. The optical probe was installed approximately 0.15 m above the soil samples. A 50 W halogen lamp was used to simulate sunlight with a 10º field of view (FOV) in a dark room. The moisture and dry soil samples were respectively placed in a sample dish with a diameter larger than 10 cm and a depth greater than 5 cm, and the spectral data were collected by aligning the probe perpendicular to the soil samples. In order to obtain reflectance values, the spectroradiometer was optimized using a white Spectralon (Lab-sphere, North Sutton, NH, USA) prior to the collection of spectral data [36]. When spectral data were collected, each soil sample was scanned at three different positions. At each position, five spectral curves were collected in order to eliminate the instability of the measurements. In order to reduce the noise introduced in the collection of spectral measurements, the spectral reflectance data was smoothed using the Savitzky-Golay (SG) filter with a window size of 10 [37,38]. The smoothed curves of spectral reflectance for the moisture and dry soil samples are shown in Figure 3a,b, respectively.
2.4. Methods
2.4.1. Selecting the Spectral Characteristic Indices of Dry Soil
The spectral response of soil heavy metal contents is often so subtle that it is not always distinctive enough for their detection. In order to improve the prediction accuracy, the smoothed spectral data of dry soil were processed with Continuum Removal (CR), the first derivative (FD), the logarithm of reciprocal (LR), the exponential transformation (ET), and the logarithmic transformation (LT). Overall, the transformations attempt to eliminate or reduce the effect of background noise and the change of signal intensity caused by the soil surface spectral scattering and absorption. This conclusion has been confirmed by many related studies [37,38]. However, the transformations often led to different enhancements. The CR transformation emphasized and normalized the characteristics of soil spectral reflectance and absorption so that the obtained spectral indices were compatible [39]. The FD transformation is often used to calibrate spectral reflectance curves and mitigate the effect of background on spectral reflectance. The obtained FD spectral indices were more sensitive to the content of heavy metals in the soil and provided a stronger capacity for prediction than the original spectral variables [40]. The LR and LT transformations enhanced the differences in the visible region of wavelengths and reduced the effect of different illumination conditions [41]. The ET transformation played a role in reducing the effect of noise by emphasizing large spectral reflectance values and deemphasizing small spectral reflectance values. The results are shown in Figure 4a–e. These transformations and smoothed spectral indices were used to identify the optimal relationships with soil heavy metal content. Pearson correlation coefficients with a significance level of 0.01 were used to determinate the spectral indices of dry soil that were significantly correlated with the content of heavy metals in the soil (Cd, Hg, and As).
2.4.2. Selecting the Optimal Spectral Variables from the Spectral Indexes of Dry Soil
One of the most important steps in the development of the optimal hyperspectral estimation models of the soil heavy metal contents was the determination of appropriate spectral variables to significantly reduce the error of model fitting and contribute to the improvement in estimation accuracy. Stepwise regression was most widely used for selecting the significant independent variables from a large number of variables [42]. Studies have also shown that Random Forest exhibits a superior performance compared to conventional statistical methods [43]. Designed as a wrapper around a Random Forest classification algorithm, the Boruta algorithm [44,45] is an all relevant feature or variable selection method and provides an intrinsic measure of the importance of each variable, called the Z-score. Comparing the Z-scores of the original variables to the expected Z-score from the randomly selected features generated by random permutation, only the variables that had larger Z-scores than that of all the randomly selected features were selected to build a support vector machine (SVM) classifier [46]. In this study, the integration of the Boruta algorithm with a stepwise regression and variance inflation factor (VIF) was utilized to select the significantly important and non-correlated spectral variables for estimation of the soil heavy metal (Hg, As, and Cd) content. The Boruta algorithm is briefly described as follows [46]:
(1) Extend the original training soil spectral data by adding optimal soil spectral indices, where the added attributes are randomly permutated across the samples to remove their correlations with the response. Then, the Random Forest classifier is run on the extended soil spectral data to compute the Z-scores of all the dry soil spectral variables, including the randomly selected (called shadow) soil spectral features;
(2) Find the maximum Z-score among the shadow attributes (MZSA) and use it as the threshold, and then assign a score to each soil spectral attribute that scores higher than MZSA. If the Z-score of a feature is higher than the MZSA, this feature is deemed ‘important’ and vice versa;
(3) For each variable, perform a two-sided test of equality with the MZSA, where the Bernoulli equation is used to calculate the probability of all scored attributes, as follows:
where is the scoring probability of the soil spectral features for times, , and represents the probability of scoring at each time, and is the number of soil spectral features or variables. A significant level of 0.01 was used in this study, indicating the spectral feature is significantly important;
(4) Repeat the procedure until the importance is assigned to all the attributes, or the algorithm has reached a previously set limit of Random Forest runs.
The spectral variables selected by the Boruta algorithm might be correlated with each other. That is, there are collinearities among the variables. The stepwise regression with VIF was then applied to eliminate the collinearity of the selected spectral variables. The rule for justifying collinearity among variables is as follows: if 0 < VIF < 10, the spectral variables have shown no multi-collinearity. If 10 ≤ VIF < 100, there was high multi-collinearity among the spectral variables. If VIF ≥ 100, the spectral variables have shown severe multi-collinearity.
2.4.3. Model Development and Validation for Estimating Dry Soil Heavy Metal Contents
To estimate heavy metal content in dry soils, it is critical to construct an estimation model from the optimal relevant spectral variables. In this estimation model, the heavy metal content was the dependent variable, while soil spectral responses (or its transformed indices) were the independent variables [47]. The empirical estimation model can be written as:
where the dependent variable ( is the estimated soil heavy metal content; is a constant; is the coefficient of the ith optimal relevant spectral variable; represents the optimal relevant spectral variable at wavelength . m is the total number of spectral variables. The variables for the empirical estimation model were selected by the methods described in Section 2.4.2.
The models were developed using the dataset of 65 soil samples for training and the obtained models were then validated for their predictions of soil heavy metal content using the datasets from 15 testing soil samples in Guangdong province and 33 testing soil samples in the Conghua district of Guangzhou.
2.4.4. The Spectral Relationship Model Between Dry Soil and Moist Soil
It is well known that soil moisture affects soil spectral reflectance values very much in the VNIR bands [48]. In order to eliminate soil moisture effects, we used the spectral variables from dry soil spectral reflectance (DSSR) to construct the above-described models for estimating soil heavy metal content. However, it was difficult to apply the models to monitor moisture soil heavy metal contents in the natural environment. To extend the estimation models for dry soil to moisture soil conditions, we explored the relationship of the spectral ratio of DSSR to moisture soil spectral reflectance (MSSR) with soil moisture content by comparing a linear model, a logarithm model, a power model and an exponential model. The resulting model would link DSSR with MSSR through soil moisture content and provide the potential of applying the lab-derived models to prediction of soil heavy metal contents at a regional scale.
3. Results
3.1. Selecting Spectral Indexes of Dry Soil
Pearson correlation coefficients between the soil heavy metal (As, Cd, and Hg) content and spectral indexes, including de-noised raw spectral variables and transformed spectral indices, are shown in Figure 5. The correlation analysis revealed that the spectral transformations could highlight the reflectance characteristics hidden in the soil spectral reflectance data compared to the raw spectral variables. The FD spectral indices had higher correlations with the three soil heavy metal contents than other spectral indices. Therefore, the FD spectral indices were selected as the spectral variables in this study.
3.2. Selection of Optimal Relevant Spectral Variables
Based on the FD spectral indices, the Boruta algorithm was applied to identify the optimal relevant spectral variables for the prediction of soil heavy metal (Hg, As, and Cd) content. The important Z-Scores of all spectral variables used to estimate the three soil heavy metal contents are shown in Figure 6, where purple, yellow, and green represent unimportant, tentative, and important spectral variables, respectively. The three groups of spectral variables for each of three soil heavy metal contents were automatically created and output by the Boruta algorithm.
In Figure 6a, based on the Z-scores for predicting the content of soil As, three spectral variables, band 470 nm, band 987 nm, and band 1056 nm, were confirmed to be important, 16 spectral variables were tentative, and the other 1543 spectral variables were confirmed to be unimportant. In Figure 6b, it was found that 15 spectral variables, including band 1000 nm, band 1059 nm, band 2379 nm, band 1943 nm, band 2178 nm, were important for Cd, 30 spectral variables were tentative, and the other 1522 spectral variables were unimportant. Figure 6c shows that only two spectral variables, band 453 nm and band 907 nm, were important for the prediction of soil Hg, 29 spectral variables were tentative, and the other 1536 spectral attributes could be ignored. A stepwise regression with VIF analysis was further used to eliminate the collinearity among the spectral variables selected by the Boruta algorithm. The resulting optimal relevant spectral variables for three soil heavy metal (As, Cd, and Hg) contents are shown in Table 2.
3.3. Estimation Models of Soil Heavy Metal Contents and Accuracy Assessment
The estimation models of the soil heavy metal content were developed based on the selected FD spectral variables from DSSR. To improve the accuracy of the models, the exponential and logarithmic transformation of the original soil heavy metal content were performed. The results show that the exponential transformation results of Cd and Hg contents were more correlated with the FD spectral variables than the original soil heavy metal content and their logarithmic transformation. For As, the original soil heavy metal content was more correlated with the FD spectral variables. According to Equation (1), the estimation model of As was thus built using three optimal relevant spectral variables, FD 470 nm, FD 987 nm, and FD 1056 nm (Table 2), as follows:
This is a second-order polynomial model. In addition to three optimal relevant spectral variables, their interaction and second-order components were involved in this model for the prediction of As. For Cd, the independent variables involved in the model included the optimal relevant spectral variables listed in Table 2 and their interaction and second-order components. The dependent variable was the exponential transformation of the original Cd content and the model was given as follows:
Similar to the estimation model of Cd, the exponential model for estimating Hg was expressed as:
From the models, the coefficient of determination (R2) was defined as the ratio of the sum of squares due to regression, with the total sum of squares being 0.91, 0.60, and 0.65 for Cd, As, and Hg, respectively, and thus the estimation model for Cd was potentially more reliable than the models for Hg and As. The estimates of the soil heavy metal content from the models were compared with the corresponding field observations from the 65 training soil samples by generating their surfaces using cubic spline interpolation (Figure 7). Obviously, the surface of the predicted Cd content looked very close to that of the measurements, while big differences between the estimated and measured surfaces of As and Hg were found.
The estimates of the soil heavy metal contents were further compared with the field observations from the 65 training soil samples by calculating sample means, standard deviations (Stdev), and the relative RMSE (RRMSE) (Table 3). The RRMSE was defined as the RMSE divided by the sample mean and represented with a percentage. It was found that the average estimates were very close to the sample means of the field measurements, but the estimates of Cd content were more accurate than those of As and Hg contents, based on the RRMSE values of 11.51% for Cd, 40.29% for Hg, and 45.92% for As (Table 3).
Moreover, we used 15 soil samples that were not used for the model development to validate the prediction accuracy of the models in Figure 8, in which the predicted values of the soil heavy metal contents were plotted against the measured values. The predictions of Cd content had a greater value of R2 and a smaller RRMSE value compared with those of As and Hg, implying that the model of Cd had higher prediction accuracy than As and Hg. Overestimations and underestimations occurred for the smaller and larger content values of As, respectively. The large error of Hg content was mainly caused by the serious underestimations for the larger values. On the other hand, only underestimations happened at four soil samples for Cd content.
3.4. The Spectral Ratio Model of Dry Soil to Moisture Soil
Through numerous experiments we found that the relationship of the spectral ratio of DSSR to MSSR with soil moisture content varied greatly, from a wavelength of 350 nm to 1029 nm (Figure 9). Given a wavelength or spectral band, as the soil moisture content increased, the value of the spectral ratio increased. However, the variation quickly increased at the very beginning and reached maximum values at about 500 nm and then decreased quickly as the wavelength became longer. After the wavelength of 1029 nm, the spectral ratios of DSSR to MSSR at different levels of soil moisture content started to converge and were getting close to 1, which indicated that there was little effect of soil moisture content on the ratio of DSSR to MSSR after this wavelength. Thus, after the band 1029 nm the relationship between the spectral ratios of the DSSR to MSSR and soil moisture becomes stable, implying the great potential of developing the models to accurately estimate soil heavy metal content based on spectral variables beyond the wavelength of 1029 nm and expanding the DSSR-derived models to the estimations of soil heavy metal content based on MSSR.
To obtain MSSR values, we explored the relationship between soil moisture content and the spectral ratio (SR) of DSSR to MSSR by comparing a linear model, a logarithm model, a power model, and an exponential model. The correlation coefficient and the significance level were used to select the best model and the results are shown in Figure 10 and Figure 11.
From Figure 10 and Figure 11, the exponential model was proven to be most reasonable, with higher correlations than other three models. The exponential relationship between the SR of DSSR to MSSR and soil moisture content can be expressed as:
where x denotes soil moisture content, and a and b represent model coefficients. The model coefficients varied over wavelength and are shown in Figure 12.
3.5. Regional-Scale Soil Heavy Metal Contents Retrieved from HJ-1A hyperspectral Data
To validate the reliability of the estimation models at the regional scale (Conghua district), HJ-1A data were selected to estimate soil heavy metal content. However, the spectral wavelength of HJ-1A data ranged from 459 nm to 956 nm, which had different range and spectral bands of wavelengths from those of the spectral variables involved in the above estimation models. The spectral resolution of the HJ-1A image was 5 nm, much coarser than the measured spectral interval of 0.6 nm by the AvaField portable spectrometer used. Thus, the above estimation models could not be utilized for the HJ-1A images. In order to match the spectral resolution of the HJ-1A data, the spectral data collected using the AvaField portable spectrometer were spectrally resampled with the Environment for Visualizing Images (ENVI) software. Moreover, the same methods as above were used to select the optimal spectral bands from the HJ-1A data and develop the corresponding estimation models. The selected spectral bands were band 470, band 472, band 477, band 479, band 481, band 484, band 486, band 491, and band 493. In addition, the FDs were derived based on the selected spectral bands and corresponding models of soil heavy metal content were obtained for As, Cd, and Hg, as follows:
In this study, the SMAP (soil moisture active passive) data (Level 4 Soil Moisture) dated 30 October 2017 were obtained and downscaled through cubic convolution resampling (Figure 13a). The parameters of Equation (6) for each of the selected spectral bands for HJ-1A data were obtained from Figure 12 and are shown in Table 4, which led to the SR relationship with soil moisture content for HJ-1A bands and the values of DSSR. Equations (7)–(9) were then used to estimate the contents of the soil heavy metals in the validation area.
The heavy metal contents were calculated for the validation area—Conghua using Equations (7)–(9). Figure 13b–d shows the spatial distributions of three heavy metal content estimates. Moreover, the in situ measurements of the soil heavy metal contents from five soil samples of 5–15 cm depth within each of the 33 sample plots were averaged and used as the plot observations. The estimates of the soil heavy metal contents from the models and the HJ-1A image were compared with the field observations from the 33 test plots by calculating the confidence intervals, mean estimate errors, RMSE, and RRMSE values (Table 5).
Overall, the sample means of the soil heavy metal contents were much lower than the health standards of 30 mg/kg for As and 0.3 mg/kg for Cd and Hg (Table 5 and Figure 13). The soil heavy metal content in the cities, urbanized areas, and croplands were higher than other areas. Based on the health standards, there were areas seriously polluted by soil heavy metals Hg and As in Conghua. The Hg and As polluted areas were spatially distributed mainly in the cities, urbanized areas, and croplands. There were only a few areas polluted by Cd, mainly in the cities. These were mainly due to industrial activities, urban pollution, chemical fertilizers, and other human activities. The spatial patterns of the soil heavy metal content estimates implied the reasonability of the estimation models.
All the average estimates fell into the confidence intervals at the significant level of 0.05 and the mean errors did not significantly differ from zero. However, the estimates of Cd content had a much smaller RRMSE value than those of Hg and As, implying that the estimates of Cd had the highest accuracy, then Hg and As. The RRMSE of the predictions for As was large mainly because of the great coefficient of variation. The results of Conghua at the regional scale were similar to those from the soil samples obtained for Guangdong province.
4. Discussions
Developing estimation models of soil heavy metal contents based on spectral reflectance data from soil samples and then applying them to hyperspectral image based regional scale mapping, that is, generating spatial explicit estimates, is a complex process. Its accuracy varies greatly depending on many factors, including landscape complexity, type of soil heavy metals and their chemical state/form, environmental conditions when measurements are collected, the spectral variables selected and used to develop the models, spectral resolutions and spatial resolutions of hyperspectral data, modeling methods, and sample sizes. This discussion was only focused on following aspects.
First of all, pure metals do not absorb VNIR and mid-IR radiation. When soil heavy metals hold reflectance and absorption features, they can be estimated based on their relationships with the spectral features [14]. The soil heavy metals with low content are often difficult to directly estimate using soil spectral features. However, soil heavy metals, often absorbed or bounded, are characterized by spectrally active constituents depending on environmental conditions, which make it possible to estimate their contents and derive their spatial distributions using spectral variables from remote sensing data, especially hyperspectral data [49,50]. Previous studies have shown the availability for predicting soil heavy metal content by spectroscopic reflectance [49,50]. However, how to select the spectral variables that significantly contribute to the reduction of model fitting errors and increase of estimation accuracy but are not correlated with each other is critically important [15].
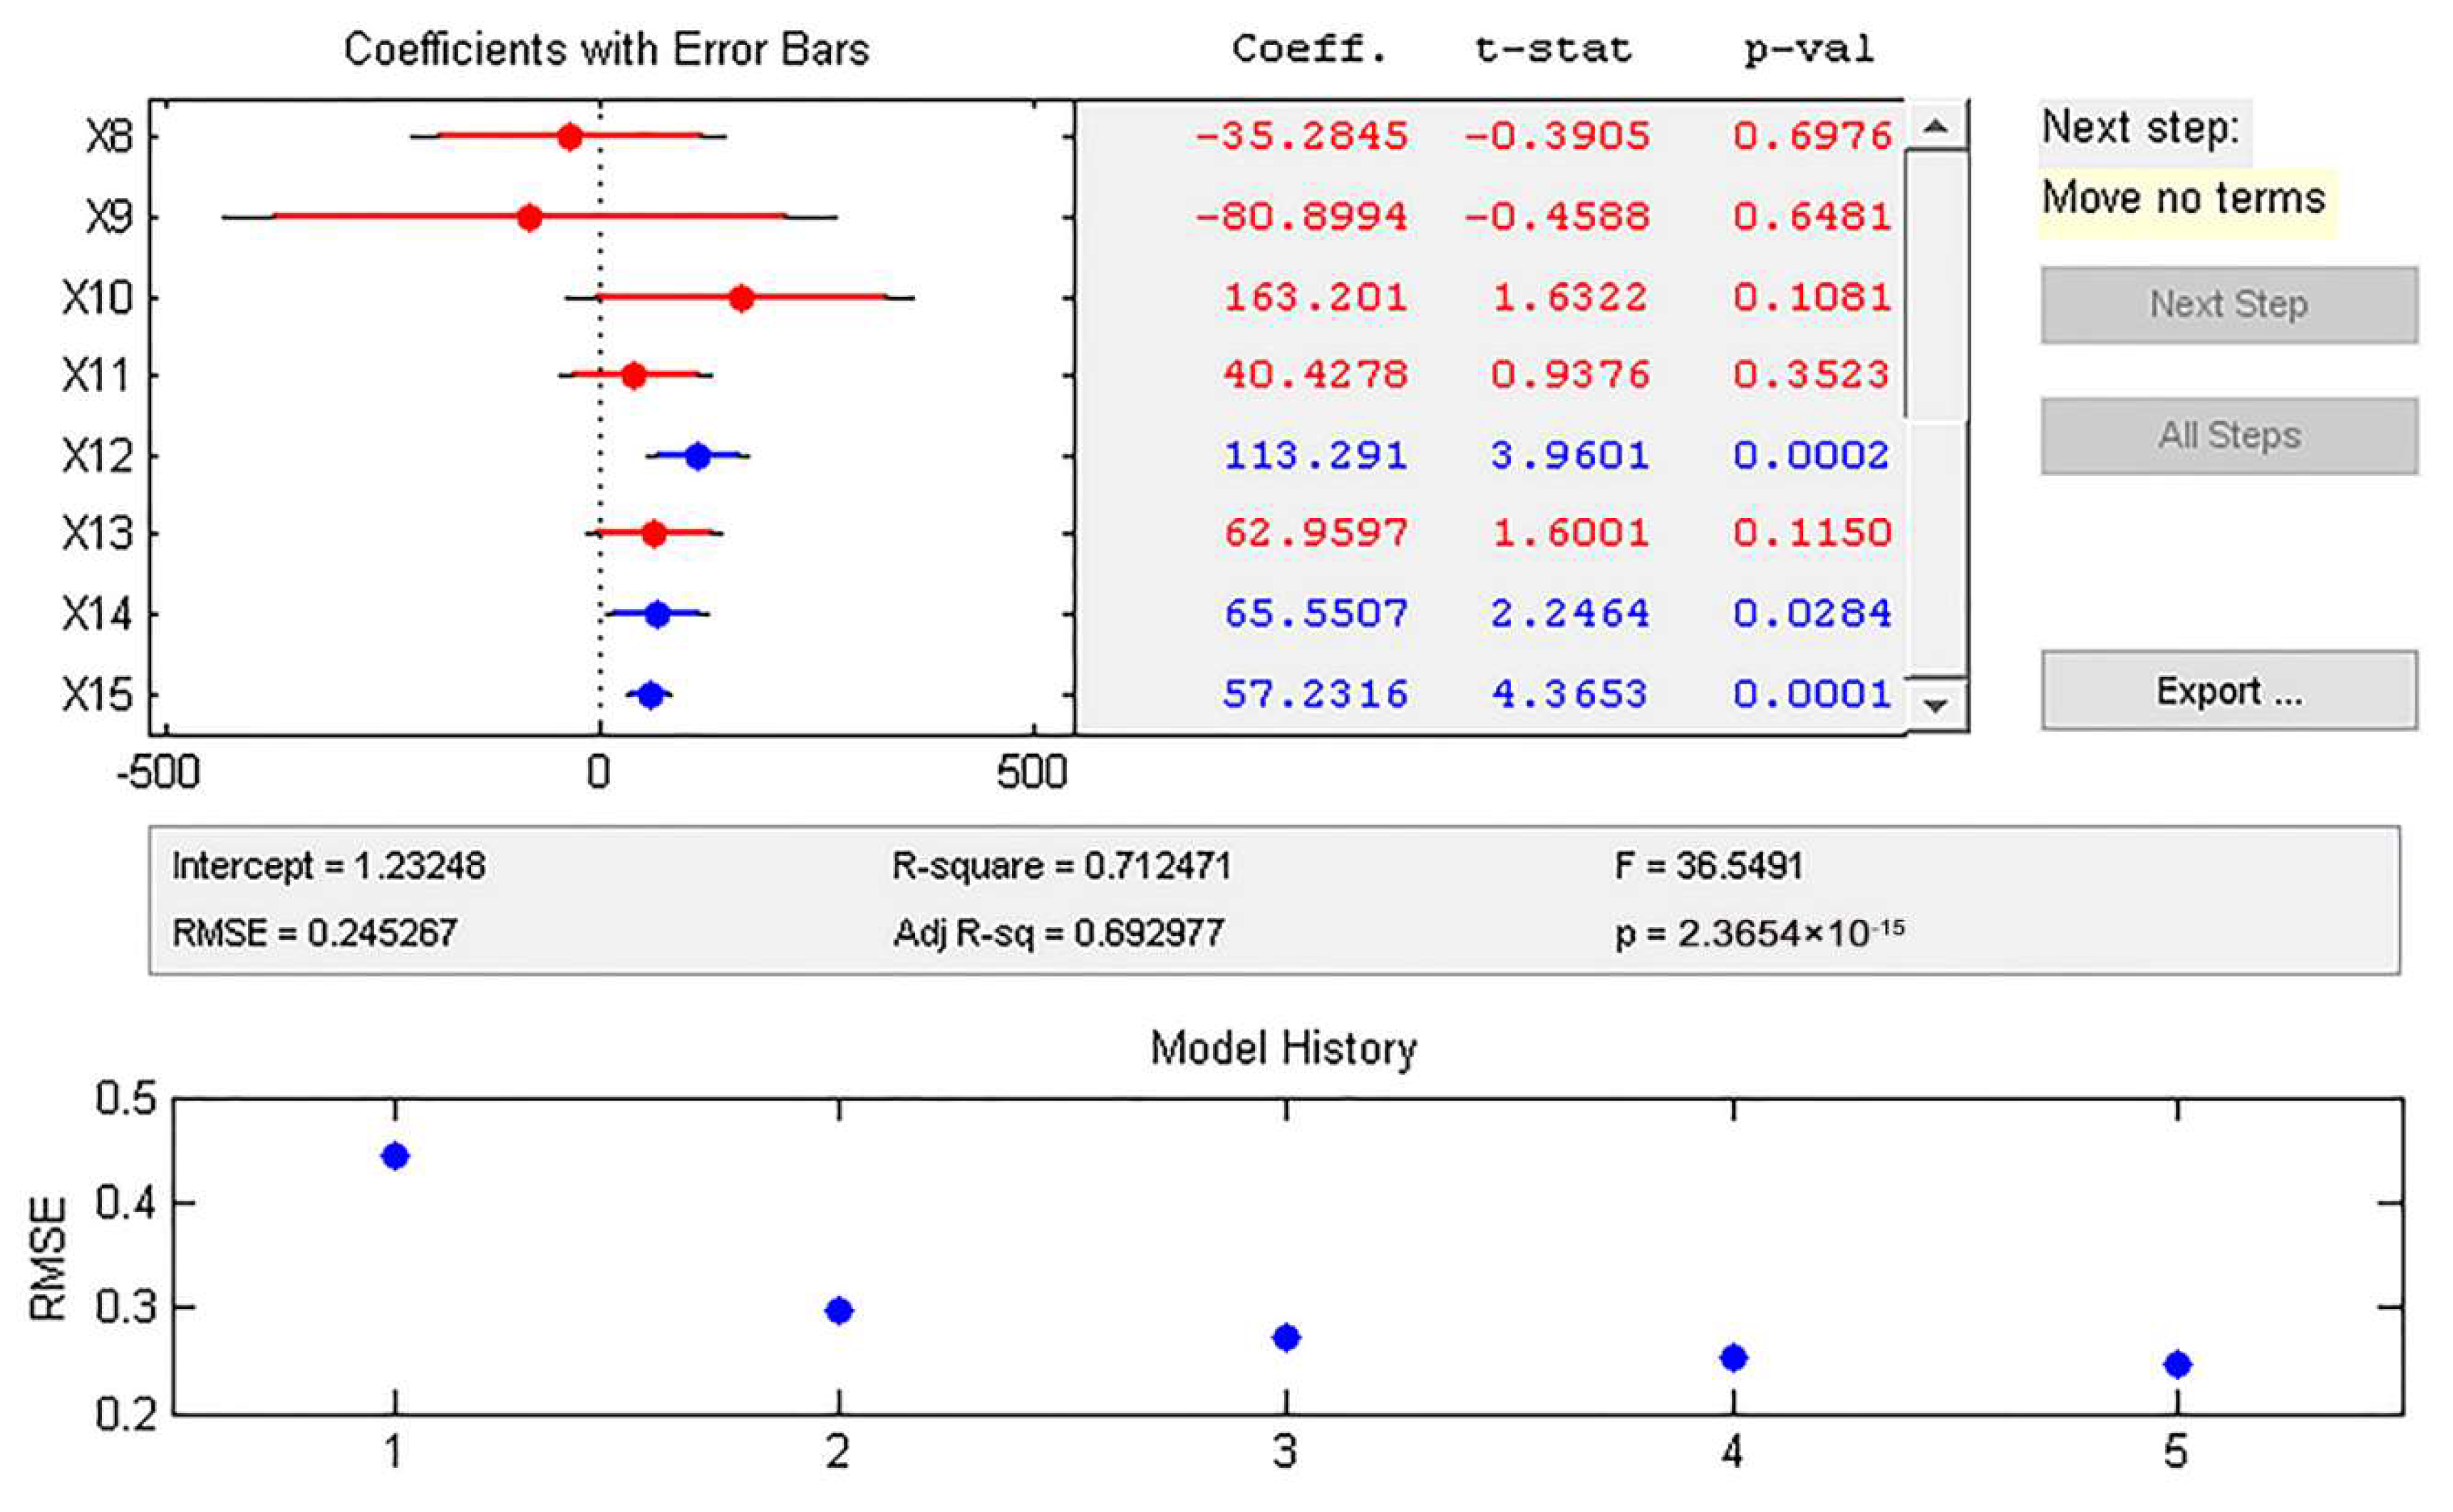
For this purpose, several methods, such as correlation analysis, VIF, and random forest are available. Studies have also shown that the Boruta algorithm exhibits superior performance with a higher accuracy and smaller error rate compared to the conventional statistical methods [32,43,51]. However, in our experiment it was also found that there was collinearity among the spectral variables selected by the Boruta algorithm. For example, the Boruta algorithm led to a total of 15 spectral variables for the estimation of soil heavy metal Cd and most of them had VIF values of greater than 10 (Table 6). We then used a stepwise regression with VIF to eliminate the collinearity among the spectral variables and identify the optimal relevant spectral variables (Table 6, Figure 14), which led to three spectral variables (FD1059, FD2178, and FD2379) that significantly contributed to the increase in the estimation accuracy and were not significantly correlated with each other. Thus, the integration of the Boruta algorithm with the stepwise regression and VIF worked well.
Secondly, the spectral reflectance properties of soils over the VNIR spectrum (350–1000 nm) are attributed to the electromagnetic energy absorption caused by the electron transition of metal ions (such as Fe2+, Fe3+, Mn2+). In the shortwave infrared spectrum (1000–2500 nm), the spectral absorptions of soils were mainly due to the extension, bending, and deformation of chemical bonds in various molecular groups (including OH-, CO-OH, Al-OH, Fe-OH, Mg-OH) of minerals, such as organic matter, layered silicate, carbonate, and sulfate. In general, different components or soil heavy metals have different characteristics of spectral absorption. For example, bands centering around 838 nm, 1930 nm, and 2148 nm are sensitive to soil lead content [26], while wavelengths centered around 460 nm, 1400 nm, 1900 nm, and 2200 nm are considered to be appropriate for studying the content of As and Cu in mining areas [17]. Liu [25] ranked the adsorption capacity of heavy metals in soils as Pt > Cd > Hg > As > Cr, which may explain why our study found that the model for estimating soil heavy metal Cd was most accurate and the model for soil heavy metal As had the worst performance. In addition, ecause of a limited wavelength range (459 nm to 956 nm) of the used HJ-1A image for the Conghua district, it was found that the estimation models at the regional scale had a lower accuracy of estimating the contents of the soil heavy metals Hg and As at the regional scale than that at the soil sample level.
Moreover, developing estimation models using the hyperspectral data from soil samples aims to apply them to map the contents of soil heavy metals at regional scales—that is, generating spatially explicit estimates based on hyperspectral imagery [12,14,16]. This requires consistent wavelength ranges and spectral resolutions of the hyperspectral data from the soil samples and used for model development, with those of the hyperspectral imagery used for mapping the soil heavy metal contents at regional scales. If the wavelength ranges and spectral resolutions are not consistent, the obtained models could not be directly applied to the mapping at regional scales. In this study, because the HJ-1A image had a much narrower range of wavelengths and a coarser spectral resolution compared with those of the hyperspectral data collected from the soil sample, the hyperspectral data were re-sampled and the estimation models were re-developed. It was found that the obtained results at the regional scale had similar estimation accuracy to those at the soil sample level. That is, the prediction model of Cd provided the most accurate estimations, then the models for Hg and As at both the soil sample level for Guangdong province and the regional scale of Conghua district. This may imply the generalization and repeatability of the proposed method. However, the test sample sizes used to validate the prediction accuracy of the obtained models at both the soil sample level and the regional scale were relatively small and further validation of the proposed method using larger sample sizes is needed in the future.
At present, almost all the studies on the development of estimation models using hyperspectral data to estimate the contents of soil heavy metals have focused on building the relationships of soil heavy metal contents with DSSR without considering the effect of soil water, which leads to lower estimation accuracy due to the inference of soil moisture. In this paper, we first built the relationship models of soil heavy metal contents with DSSR and then accounted for the relationship of the DSSR/MSSR ratio with soil moisture content. The latter could be used to derive the values of DSSR when the data of soil moisture and MSSR are available. It was found that there was great variation in the relationship for the spectral ratio of DSSR to MSSR with soil moisture content at the spectral wavelengths ranging from 340 nm to 1029 nm, and the variations converged at the spectral wavelength of 1029 nm and became stable after that. This implies that the soil moisture content would not significantly affect the spectral ratio of DSSR to MSSR after the wavelength of 1029 nm. Therefore, after the band 1029 nm, the relationship was stable and could be used to estimate the values of DSSR based on the data of MSSR and soil moisture content from hyperspectral images, and thus provided the potential of using the DSSR-derived models to estimate soil heavy metal contents with data of MSSR. This finding is novel. However, in this study, the sample sizes used to develop and validate the estimation models were relatively small, which might have affected the assessment. On the other hand, it is often very difficult to obtain spectral stability when the soil samples are measured by the AvaField portable spectrometer. This is partly because the soil composition is not homogeneous and partly because the environmental conditions when the soil samples and spectral data are collected also affect the accuracy of spectral data. Thus, the characteristics of the moist and dry soil samples used to develop the models control the transformation of MSSR data to DSSR. In the future, more soil samples should be collected to improve and assess the transformation model.
In this study, the larger RRMSE values of the As and Hg estimates were noticed and mainly caused by the overestimations and underestimations occurring for the soil samples with smaller and larger values of soil heavy metal content, respectively. The overestimations and underestimations are often observed due to the use of global modeling, such as linear regression. Global modeling captures the global trends and ignores the local variability. On the other hand, the content of heavy metals in soil are often spatially clustered and show spatial autocorrelation in addition to global trends. Thus, local variability-based modeling methods, such as geographically weighted regression and cokriging interpolation in geostatistics, would provide the potential to improve the prediction accuracy of Cd, Hg, and As contents [12,52,53].
In order to derive the estimation models of the soil heavy metal content based on the hyperspectral data from the soil samples and apply the models to Conghua district, the HJ-1A image and the SMAP data were considered to be obtained from pure pixels. This implies an assumption that the relationships only existed in the homogeneous areas. Actually, the coarse spatial resolutions of 9 km × 9 km for SMAP and 100 m × 100 m for the HJ-1A image made it difficult to identify pure pixels. Pure pixels rarely exist, while mixed pixels often dominate a study area. It is unknown whether the relationships still hold true for mixed pixels. Thus, the conclusions presented here need support from additional studies.
Finally, in this study we used 65 soil samples to develop the models and 15 soil samples to validate the models for the whole Guangdong province, and 33 soil samples to validate the models for the Conghua district. Although the sampling design was conducted based on different levels of potential pollution and soil types, the sample sizes were relatively small. The large coefficients of variation for the sample means of the soil heavy metal contents in Table 1 and Table 5 explain the great RRMSE values of the As and Hg predictions, especially As. However, the study focused on the development of the proposed method, not on the generation of the soil heavy metal content maps. Thus, the sample sizes were statistically acceptable. In the future studies, larger sample sizes should be utilized to further develop and validate the proposed method.
5. Conclusions
It is well known that estimating and mapping the contents of soil heavy metals using hyperspectral data is a quick and effective method but very challenging due to complex landscapes, soil properties, spectral variables selected, modeling methods, and model transferability, etc. For this purpose, this study attempted to overcome some of the gaps that currently exist in this field by proposing a novel method. In this method, the optimal relevant spectral variables that significantly contributed to the reduction of model fitting errors and the improvement of estimation accuracy were first selected from the spectral indices derived from DSSR, using the integration of the Boruta algorithm with a stepwise regression and VIF. The estimation models of soil heavy metal content were developed using the selected spectral variables and field observations of soil heavy metal content. The model that accounted for the relationship of the spectral ratio of DSSR to MSSR with soil moisture content was then derived. The proposed method was examined and validated to estimate and map the contents of three soil heavy metals (As, Cd, and Hg) in Guangdong, China and in Conghua district, Guangzhou city of the same province. The results showed that (1) based on the RRMSE values from the validation datasets, the estimation model of soil heavy metal Cd content offered the most accurate estimates at both the soil sample level and regional scale, and the estimation model of As performed the worst; (2) the relationship of the DSSR/MSSR ratio with soil moisture content varied greatly before the wavelength of 1029 nm and became stable after that; (3) the DSSR/MSSR ratio model built up the linkage of DSSR with MSSR through soil moisture and provided the possibility of applying the DSSR-based models to map soil heavy metal contents at a regional scale using hyperspectral imagery; and (4) based on health standards, overall there were only a few soil samples seriously polluted by the soil heavy metals in the whole Guangdong province, while in the Conghua district of Guangzhou city, the serious pollution was mainly caused by Hg and As, with distributions mainly in the urbanized areas and croplands. This study implies that the new approach provided the potential to improve the estimation accuracy of the soil heavy metal contents, but Cd content was more reliably estimated than As and Hg.
Author Contributions
Z.L. and G.W. conceived and designed the experiments; Z.L., Y.L., Y.P., L.Z., and Y.H. performed the experiments; Z.L. analyzed the data and wrote the draft of the manuscript; G.W. revised the manuscript.
Funding
This research was supported by the National Key Research and Development Program of China (“Source Identification and Contamination Characteristics of Heavy Metals in Agricultural Land and Products”, 2016YFD0800301) and the Guangzhou Science and Technology Project, China (201804020034).
Conflicts of Interest
The authors declare no conflict of interest.
References
- Tian, L.; Liu, X.; Zhang, B.; Liu, M.; Wu, L. Extraction of rice heavy metal stress signal features based on long time series leaf area index data using ensemble empirical mode decomposition. Int. J. Environ. Res. Public Health 2017, 14, 1018. [Google Scholar] [CrossRef] [PubMed]
- Liu, M.; Liu, X.; Zhang, B.; Ding, C. Regional heavy metal pollution in crops by integrating physiological function variability with spatio-temporal stability using multi-temporal thermal remote sensing. Int. J. Appl. Earth Obs. Geoinf. 2016, 51, 91–102. [Google Scholar] [CrossRef]
- Sun, H.; BI, R.; Guo, Y.; Yuan, Y.; Chai, M.; Guo, Z. Source apportionment analysis of trace metal contamination in soils of Guangdong province, China. Acta Sci. Circumstantiae 2018, 38, 704–714. [Google Scholar]
- Von Steiger, B.; Webster, R.; Schulin, R.; Lehmann, R. Mapping heavy metals in polluted soil by disjunctive kriging. Environ. Pollut. 1994, 94, 205–215. [Google Scholar] [CrossRef]
- Leenaers, H.; Okx, J.P.; Burrough, P.A. Employing elevation data for efficient mapping of soil pollution on floodplains. Soil Use Manag. 1990, 6, 105–114. [Google Scholar] [CrossRef]
- Kemper, T.; Sommer, S. Estimate of heavy metal contamination in soils after a mining accident using reflectance spectroscopy. Environ. Sci. Technol. 2002, 36, 2742–2747. [Google Scholar] [CrossRef]
- Jarmer, T.; Vohland, M.; Lilienthal, H.; Schnug, E. Estimation of some chemical properties of an agricultural soil by spectroradiometric measurements. Pedosphere 2008, 18, 163–170. [Google Scholar] [CrossRef]
- Mouazen, A.; Maleki, M.; De Baerdemaeker, J.; Ramon, H. On-line measurement of some selected soil properties using a VIS-NIR sensor. Soil Tillage Res. 2007, 93, 13–27. [Google Scholar] [CrossRef]
- Sawut, R.; Kasim, N.; Abliz, A.; Hu, L.; Yalkun, A.; Maihemuti, B.; Qingdong, S. Possibility of optimized indices for the assessment of heavy metal contents in soil around an open pit coal mine area. Int. J. Appl. Earth Obs. Geoinf. 2018, 73, 14–25. [Google Scholar] [CrossRef]
- Sun, W.; Zhang, X. Estimating soil zinc concentrations using reflectance spectroscopy. Int. J. Appl. Earth Obs. Geoinf. 2017, 58, 126–133. [Google Scholar] [CrossRef]
- Liu, M.; Liu, X.; Ding, W.; Wu, L. Monitoring stress levels on rice with heavy metal pollution from hyperspectral reflectance data using wavelet-fractal analysis. Int. J. Appl. Earth Obs. Geoinf. 2011, 13, 246–255. [Google Scholar] [CrossRef]
- Lin, X.; Su, Y.-C.; Shang, J.; Sha, J.; Li, X.; Sun, Y.-Y.; Ji, J.; Jin, B. Geographically Weighted Regression Effects on Soil Zinc Content Hyperspectral Modeling by Applying the Fractional-Order Differential. Remote Sens. 2019, 11, 636. [Google Scholar] [CrossRef]
- Dong, J.; Dai, W.; Xu, J.; Li, S. Spectral estimation model construction of heavy metals in mining reclamation areas. Int. J. Environ. Res. Public Health 2016, 13, 640. [Google Scholar] [CrossRef]
- Choe, E.; van der Meer, F.; van Ruitenbeek, F.; van der Werff, H.; de Smeth, B.; Kim, K.W. Mapping of heavy metal pollution in stream sediments using combined geochemistry, field spectroscopy, and hyperspectral remote sensing: A case study of the Rodalquilar mining area, SE Spain. Remote Sens. Environ. 2008, 112, 3222–3233. [Google Scholar] [CrossRef]
- Zhang, X.; Wen, J. Band Selection Method for Retrieving Soil Lead Content with Hyperspectral Remote Sensing Data. SPIE 2010, 7831. [Google Scholar] [CrossRef]
- Jeong, Y.; Yu, J.; Wang, L.; Shin, J.H. Spectral Responses of As and Pb Contamination in Tailings of a Hydrothermal Ore Deposit: A Case Study of Samgwang Mine, South Korea. Remote Sens. 2018, 10, 1830. [Google Scholar] [CrossRef]
- Ren, H.-Y.; Zhuang, D.; Singh, A.N.; Pan, J.; Qiu, D.; Shi, R. Estimation of As and Cu Contamination in Agricultural Soils Around a Mining Area by Reflectance Spectroscopy: A Case Study. Pedosphere 2009, 19, 719–726. [Google Scholar] [CrossRef]
- Zhang, S.; Shen, Q.; Nie, C.; Huang, Y.; Wang, D.; Hu, Q.; Ding, X.; Zhou, Y.; Chen, Y. Hyperspectral inversion of heavy metal content in reclaimed soil from a mining wasteland based on different spectral transformation and modeling methods. Spectrochim. Acta Part A Mplecular Biomol. Spectrosc. 2019, 211, 393–400. [Google Scholar] [CrossRef]
- Yu, X.; Liu, Q.; Wang, Y.; Liu, X.; Liu, X. Evaluation of MLSR and PLSR for estimating soil element contents using visible/near-infrared spectroscopy in apple orchards on the Jiaodong peninsula. Catena 2016, 137, 340–349. [Google Scholar] [CrossRef]
- Zhang, Q.; Zhang, H.; Liu, W.; Zhao, S. Inversion of heavy metals content with hyperspectral reflectance in soil of well-facilitied capital farmland construction areas. Trans. Chin. Soc. Agric. Eng. 2017, 33, 230–239. [Google Scholar]
- Tan, K.; Ye, Y.; Cao, Q.; Du, P.; Dong, J. Estimation of arsenic contamination in reclaimed agricultural soils using reflectance spectroscopy and ANFIS model. IEEE J. Sel. Top. Appl. Earth Obs. Remote Sens. 2014, 7, 2540–2546. [Google Scholar] [CrossRef]
- Ghadimi, F. Prediction of heavy metals contamination in the groundwater of Arak region using artificial neural network and multiple linear regression. J. Tethys 2015, 3, 203–215. [Google Scholar]
- Gandhimathi, A.; Meenambal, T. Spatial prediction of heavy metal pollution for soils in Coimbatore, India based on ANN and kriging model. Eur. Sci. J. ESJ 2012, 8. [Google Scholar] [CrossRef]
- Shi, T.; Chen, Y.; Liu, Y.; Wu, G. Visible and near-infrared reflectance spectroscopy—An alternative for monitoring soil contamination by heavy metals. J. Hazard. Mater. 2014, 265, 166–176. [Google Scholar] [CrossRef] [PubMed]
- Zhaochang, L.; Yongfeng, N.; Lansheng, Z.; Zhansheng, W.; Qingzhong, B.; Chongjie, Y. Translocation and transformation of heavy metals in water logged aeration zone of soil. Acta Sci. Circumstantiae 1990, 10, 160–172. [Google Scholar]
- Zhang, X.; Wen, J.; Zhao, D. SPIE Proceedings [SPIE Remote Sensing—Toulouse, France (Monday 20 September 2010)] Earth Resources and Environmental Remote Sensing/GIS Applications—Band selection method for retrieving soil lead content with hyperspectral remote sensing data. SPIE 2010, 7831, 78311K. [Google Scholar]
- Ben-Dor, E.; Patkin, K.; Banin, A.; Karnieli, A. Mapping of several soil properties using DAIS-7915 hyperspectral scanner data—A case study over clayey soils in Israel. Int. J. Remote Sens. 2002, 23, 1043–1062. [Google Scholar] [CrossRef]
- Lagacherie, P.; Baret, F.; Feret, J.B.; Netto, J.M.; Robbez-Masson, J.M. Estimation of soil clay and calcium carbonate using laboratory, field and airborne hyperspectral measurements. Remote Sens. Environ. 2008, 112, 825–835. [Google Scholar] [CrossRef]
- Hbirkou, C.; Pätzold, S.; Mahlein, A.K.; Welp, G. Airborne hyperspectral imaging of spatial soil organic carbon heterogeneity at the field-scale. Geoderma 2012, 175–176, 21–28. [Google Scholar] [CrossRef]
- Gomez, C.; Lagacherie, P.; Coulouma, G. Regional predictions of eight common soil properties and their spatial structures from hyperspectral Vis–NIR data. Geoderma 2012, 189–190, 176–185. [Google Scholar] [CrossRef]
- Gomez, C.; Rossel, R.A.V.; McBratney, A.B. Soil organic carbon prediction by hyperspectral remote sensing and field vis-NIR spectroscopy: An Australian case study. Geoderma 2008, 146, 403–411. [Google Scholar] [CrossRef]
- Liu, P.; Liu, Z.H.; Hu, Y.M.; Shi, Z.; Pan, Y.C.; Wang, L.; Wang, G.X. Integrating a Hybrid Back Propagation Neural Network and Particle Swarm Optimization for Estimating Soil Heavy Metal Contents Using Hyperspectral Data. Sustainability 2019, 11, 419. [Google Scholar] [CrossRef]
- Palacios-Orueta, A.; Ustin, S.L. Remote Sensing of Soil Properties in the Santa Monica Mountains, I. Spectr. Anal. Remote Sens. Environ. 1998, 65, 170–183. [Google Scholar] [CrossRef]
- Wang, J.; Cui, L.; Gao, W.; Shi, T.; Chen, Y.; Guo, Y. Prediction of low heavy metal concentrations in agricultural soils using visible and near-infrared reflectance spectroscopy. Geoderma 2014, 216, 1–9. [Google Scholar] [CrossRef]
- Xu, L. The zonal differentiation of soil environmental background values and critical (4) contents in Guangdong. J. South China Agric. Univ. (China) 1996, 17, 58–62. [Google Scholar]
- Shi, T.; Wang, J.; Chen, Y.; Wu, G. Improving the prediction of arsenic contents in agricultural soils by combining the reflectance spectroscopy of soils and rice plants. Int. J. Appl. Earth Obs. Geoinf. 2016, 52, 95–103. [Google Scholar] [CrossRef]
- Mashimbye, Z.E.; Cho, M.A.; Nell, J.P.; Declercq, J.P.; Van, A.; Turner, D.P. Model-Based Integrated Methods for Quantitative Estimation of Soil Salinity from Hyperspectral Remote Sensing Data: A Case Study of Selected South African Soils. Pedosphere (Beijing) 2012, 22, 640–649. [Google Scholar] [CrossRef]
- Tian, Y.; Zhang, J.; Yao, X.; Cao, W.; Zhu, Y. Laboratory assessment of three quantitative methods for estimating the organic matter content of soils in China based on visible/near-infrared reflectance spectra. Geoderma 2013, 202–203, 161–170. [Google Scholar] [CrossRef]
- He, T.; Wang, J.; Lin, Z.; Cheng, Y. Spectral Features of Soil Organic Matter. Geomat. Inf. Sci. Wuhan Univ. 2006, 31, 975–979. [Google Scholar] [CrossRef]
- Jiang, Z.; Fei, B.; Yang, Z. The effect of spectral pretreatment on the prediction of wood cellulose crystallinity by near infrared spectroscopy. Spectrosc. Spectr. Anal. 2007, 27, 435–438. [Google Scholar]
- Wang, L.; Bai, Y.L.; Lu, Y.L.; Wang, H. Effect on retrieval precision for corn N content by spectrum data transformation. Remote Sens. Technol. Appl. 2011, 26, 220–225. [Google Scholar]
- Sankaran, S.; Maja, J.M.; Buchanon, S.; Ehsani, R. Huanglongbing (citrus greening) detection using visible, near infrared and thermal imaging techniques. Sensors 2013, 13, 2117–2130. [Google Scholar] [CrossRef] [PubMed]
- Ao, Y.; Li, H.; Yang, Z.; Zhu, L. An alternative approach for machine learning seismic interpretation and its application in Daqing oilfield. In SEG Technical Program Expanded Abstracts; Society of Exploration Geophysicists: Tulsa, OK, USA, 2018; pp. 2201–2205. [Google Scholar]
- Kursa, M.B.; Rudnicki, W.R. Feature selection with the Boruta package. J. Stat. Softw. 2010, 36, 1–13. [Google Scholar] [CrossRef]
- Rudnicki, W.R.; Wrzesień, M.; Paja, W. All Relevant Feature Selection Methods and Applications. Stud. Comput. Intell. 2015, 584, 11–28. [Google Scholar]
- Suykens, J.A.; Vandewalle, J. Least squares support vector machine classifiers. Neural Process. Lett. 1999, 9, 293–300. [Google Scholar] [CrossRef]
- Kancheva, R.; Georgiev, G. Assessing Cd-induced stress from plant spectral response. SPIE 2014, 9239, 923926. [Google Scholar] [CrossRef]
- Liu, Z.; Zhao, Y. Research on the method for retrieving soil moisture using thermal inertia model. Sci. China Ser. D 2006, 49, 539–545. [Google Scholar] [CrossRef]
- Wang, F.; Gao, J.; Zha, Y. Hyperspectral sensing of heavy metals in soil and vegetation: Feasibility and challenges. ISPRS J. Photogramm. Remote Sens. 2018, 136, 73–84. [Google Scholar] [CrossRef]
- Mohamed, E.S.; Saleh, A.M.; Belal, A.B.; Allah, A. Application of near-infrared reflectance for quantitative assessment of soil properties. Egypt. J. Remote Sens. Space Sci. 2017, 21, 1–14. [Google Scholar] [CrossRef]
- Zhao, L.; Hu, Y.M.; Zhou, W.; Liu, Z.H.; Pan, Y.C.; Shi, Z.; Wang, L.; Wang, G.X. Estimation Methods for Soil Mercury Content Using Hyperspectral Remote Sensing. Sustainability 2018, 10, 2474. [Google Scholar] [CrossRef]
- Lee, J.; Alnasrallah, M.; Wong, D.; Beaird, H.; Logue, E. Impacts of scale on geographic analysis of health data: An example of obesity prevalence. ISPRS Int. J. Geo-Inf. 2014, 3, 1198–1210. [Google Scholar] [CrossRef]
- Goovaerts, P. Geostatistics for Natural Resources Evaluation; Oxford University Press, Inc.: New York, NY, USA, 1997. [Google Scholar]
Figure 1.
(a) The study area with the spatial distribution of 65 training and 15 validation soil samples, and Guangzhou city highlighted in cyan; and (b) its location in China.
Figure 1.
(a) The study area with the spatial distribution of 65 training and 15 validation soil samples, and Guangzhou city highlighted in cyan; and (b) its location in China.

Figure 2.
(a) The location of the test study area in Guangzhou city (red area shown in Figure 1a); (b) the land cover map of the study area used for testing the optimal hyperspectral estimation models; and (c) the test study area shown using a false color composite image from HuanJing-1A data, with the spatial distributions of 33 soil samples used for assessing the accuracy of estimated soil heavy metal content.

Figure 3.
The spectral reflectance curves of (a) 65 moisture soil samples and (b) corresponding dry soil samples.
Figure 3.
The spectral reflectance curves of (a) 65 moisture soil samples and (b) corresponding dry soil samples.

Figure 4.
Transformation spectral indices of dry soil: (a) continuum removal spectral curves; (b) first-order differential spectral curves; (c) reciprocal logarithmic spectral curves; (d) exponential transformation spectral curve; and (e) logarithmic transformation spectral curves.
Figure 4.
Transformation spectral indices of dry soil: (a) continuum removal spectral curves; (b) first-order differential spectral curves; (c) reciprocal logarithmic spectral curves; (d) exponential transformation spectral curve; and (e) logarithmic transformation spectral curves.


Figure 5.
Pearson correlation coefficients between the soil heavy metal content and spectral indices for (a) As; (b) Cd; and (c) Hg (p = 0.01).
Figure 5.
Pearson correlation coefficients between the soil heavy metal content and spectral indices for (a) As; (b) Cd; and (c) Hg (p = 0.01).

Figure 6.
Z-scores showing the predictive capacity of individual first derivative spectral bands for three soil heavy metal contents obtained using the Boruta algorithm, where green, yellow, and purple symbols represent important, tentative, and unimportant spectral variables, respectively, for: (a) As; (b) Cd; and (c) Hg (p = 0.01).


Figure 7.
Comparison of soil heavy metal content between the model predicted and field measured values in terms of surfaces by cubic spline interpolation based on: (a) field measured data versus (b) model predicted values for As; (c) field measured data versus (d) model predicted values for Cd; and (e) field measured data versus (f) model predicted values for Hg.

Figure 8.
Comparison of observed and predicted contents of As, Cd, and Hg based on the 15 validation soil samples.
Figure 8.
Comparison of observed and predicted contents of As, Cd, and Hg based on the 15 validation soil samples.

Figure 9.
The spectral ratio of dry soil spectral reflectance (DSSR) to moisture soil spectral reflectance (MSSR) plotted against wavelength at different levels of soil moisture.
Figure 9.
The spectral ratio of dry soil spectral reflectance (DSSR) to moisture soil spectral reflectance (MSSR) plotted against wavelength at different levels of soil moisture.

Figure 10.
The changes of correlation coefficients of the spectral ratio with soil moisture content over wavelength.
Figure 10.
The changes of correlation coefficients of the spectral ratio with soil moisture content over wavelength.

Figure 11.
The changes of p-values for correlations of the spectral ratio of DSSR to MSSR with soil moisture content over wavelength.
Figure 11.
The changes of p-values for correlations of the spectral ratio of DSSR to MSSR with soil moisture content over wavelength.

Figure 12.
(a) Parameter a and (b) parameter b of the exponential relationship model over wavelength.
Figure 12.
(a) Parameter a and (b) parameter b of the exponential relationship model over wavelength.

Figure 13.
Spatial distributions of (a) soil moisture and soil heavy metal contents in the validation area: (b) As; (c) Cd; and (d) Hg (note: health standards are 30 mg/kg for As and 0.3 mg/kg for Cd and Hg).
Figure 13.
Spatial distributions of (a) soil moisture and soil heavy metal contents in the validation area: (b) As; (c) Cd; and (d) Hg (note: health standards are 30 mg/kg for As and 0.3 mg/kg for Cd and Hg).

Figure 14.
The selection procedure of the optimal relevant spectral variables FD1059, FD2178, and FD2379, represented using X12, X14, and X15, respectively, for developing the estimation model of soil heavy metal Cd content.
Figure 14.
The selection procedure of the optimal relevant spectral variables FD1059, FD2178, and FD2379, represented using X12, X14, and X15, respectively, for developing the estimation model of soil heavy metal Cd content.


Table 1.
Statistical parameters of the measured content of heavy metals in soil in Guangdong, China (Stdev: standard deviation; CV: coefficient of variation).
Table 1.
Statistical parameters of the measured content of heavy metals in soil in Guangdong, China (Stdev: standard deviation; CV: coefficient of variation).
| Metal | Minimum (mg/kg) | Maximum (mg/kg) | Mean (mg/kg) | Standard Deviation (mg/kg) | CV (%) | Background Value [35] (mg/kg) | Health Standard (mg/kg) |
|---|---|---|---|---|---|---|---|
| Cd | 0.003 | 1.937 | 0.109 | 0.103 | 94.50 | 0.034 | 0.3 |
| Hg | 0.018 | 1.326 | 0.128 | 0.111 | 86.72 | 0.078 | 0.3 |
| As | 1.230 | 34.797 | 7.912 | 6.951 | 87.85 | 10.50 | 30 |
Table 2.
The optimal relevant spectral variables for estimation of three soil heavy metal contents.
| Soil Heavy Metals | The First Derivative Spectral Variables |
|---|---|
| As | FD 470 nm FD 987 nm FD 1056 nm |
| Cd | FD 1059 nm FD 2178 nm FD 2379 nm |
| Hg | FD 453 nm FD 907 nm |
Table 3.
The accuracy of the model fitting based on the field measurements of the soil heavy metal content from the 65 training soil samples.
Table 3.
The accuracy of the model fitting based on the field measurements of the soil heavy metal content from the 65 training soil samples.
| Heavy Metal | As | Cd | Hg | |||
|---|---|---|---|---|---|---|
| Field Data | Estimates | Field Data | Estimates | Field Data | Estimates | |
| Mean | 7.12 | 7.11 | 1.33 | 1.35 | 0.15 | 0.15 |
| Stdev | 4.26 | 3.30 | 0.74 | 0.70 | 0.13 | 0.11 |
| RRMSE (%) | 45.92 | 11.51 | 40.29 | |||
Table 4.
The values of parameters a and b for the spectral ratio (SR) model of DSSR to MSSR with soil moisture content, x (DSSR: dry soil spectral reflectance; MSSR: moisture soil spectral reflectance; ).
Table 4.
The values of parameters a and b for the spectral ratio (SR) model of DSSR to MSSR with soil moisture content, x (DSSR: dry soil spectral reflectance; MSSR: moisture soil spectral reflectance; ).
| Model Coefficients | The Central Wavelength of Selected Spectral Bands (nm) from HJ-1A Image | ||||||||
|---|---|---|---|---|---|---|---|---|---|
| 470 | 472 | 477 | 479 | 481 | 484 | 486 | 491 | 493 | |
| a | 35.79 | 36.44 | 36.47 | 37.48 | 36.87 | 39.76 | 40.18 | 40.95 | 38.29 |
| b | 1.11 | 1.10 | 1.12 | 1.09 | 1.12 | 1.07 | 1.06 | 1.03 | 1.11 |
Table 5.
Accuracy assessment of predicted soil heavy metal contents by comparing the estimates using the models and the HJ-1A data with the field observations based on 33 test sample plots (confidence intervals of As, Cd, and Hg are 6.77–13.95 mg/kg, 0.14–0.18 mg/kg, and 0.14–0.19 mg/kg, respectively; Stdev: standard deviation; CV: coefficient of variation; RMSE: root mean square error; RRMSE: relative RMSE).
| Plot # | As Content (mg/kg) | Cd Content (mg/kg) | Hg Content (mg/kg) | ||||||
|---|---|---|---|---|---|---|---|---|---|
| Observation | Estimate | Error | Observation | Estimate | Error | Observation | Estimate | Error | |
| 1 | 13.72 | 16.76 | 3.04 | 0.19 | 0.18 | −0.01 | 0.15 | 0.12 | −0.03 |
| 2 | 5.48 | 7.52 | 2.04 | 0.11 | 0.13 | 0.02 | 0.17 | 0.11 | −0.06 |
| 3 | 5.58 | 5.15 | −0.43 | 0.09 | 0.08 | −0.01 | 0.09 | 0.04 | −0.05 |
| 4 | 4.15 | 6.17 | 2.02 | 0.18 | 0.14 | −0.04 | 0.18 | 0.14 | −0.04 |
| 5 | 24.56 | 17.89 | −6.67 | 0.22 | 0.19 | −0.03 | 0.44 | 0.27 | −0.17 |
| 6 | 5.14 | 5.2 | 0.06 | 0.1 | 0.16 | 0.06 | 0.11 | 0.14 | 0.03 |
| 7 | 5.33 | 6.06 | 0.73 | 0.11 | 0.09 | −0.02 | 0.11 | 0.18 | 0.07 |
| 8 | 4.09 | 6.56 | 2.47 | 0.17 | 0.15 | −0.02 | 0.18 | 0.19 | 0.01 |
| 9 | 5.7 | 9.85 | 4.15 | 0.13 | 0.16 | 0.03 | 0.12 | 0.1 | −0.02 |
| 10 | 4.03 | 7.06 | 3.03 | 0.12 | 0.13 | 0.01 | 0.14 | 0.21 | 0.07 |
| 11 | 5.65 | 8.85 | 3.2 | 0.21 | 0.18 | −0.03 | 0.2 | 0.18 | −0.02 |
| 12 | 11.93 | 17.83 | 5.9 | 0.21 | 0.17 | −0.04 | 0.18 | 0.27 | 0.09 |
| 13 | 6.4 | 7.98 | 1.58 | 0.07 | 0.08 | 0.01 | 0.24 | 0.24 | 0 |
| 14 | 4.03 | 6.44 | 2.41 | 0.14 | 0.16 | 0.02 | 0.1 | 0.15 | 0.05 |
| 15 | 10.38 | 14.94 | 4.56 | 0.3 | 0.3 | 0 | 0.12 | 0.13 | 0.01 |
| 16 | 4.3 | 6.26 | 1.96 | 0.09 | 0.1 | 0.01 | 0.21 | 0.24 | 0.03 |
| 17 | 5.61 | 7.96 | 2.35 | 0.15 | 0.13 | −0.02 | 0.2 | 0.18 | −0.02 |
| 18 | 8.06 | 7.56 | −0.5 | 0.22 | 0.19 | −0.03 | 0.23 | 0.22 | −0.01 |
| 19 | 5.22 | 8.08 | 2.86 | 0.17 | 0.18 | 0.01 | 0.17 | 0.16 | −0.01 |
| 20 | 4.3 | 7.42 | 3.12 | 0.19 | 0.17 | −0.02 | 0.19 | 0.14 | −0.05 |
| 21 | 8.28 | 7.39 | −0.89 | 0.13 | 0.16 | 0.03 | 0.13 | 0.15 | 0.02 |
| 22 | 18.92 | 18.77 | −0.15 | 0.13 | 0.18 | 0.05 | 0.13 | 0.2 | 0.07 |
| 23 | 3.98 | 5.46 | 1.48 | 0.23 | 0.21 | −0.02 | 0.09 | 0.13 | 0.04 |
| 24 | 3.22 | 7.23 | 4.01 | 0.12 | 0.16 | 0.04 | 0.07 | 0.17 | 0.1 |
| 25 | 8.11 | 5.12 | −2.99 | 0.12 | 0.12 | 0 | 0.18 | 0.14 | −0.04 |
| 26 | 15.22 | 10.35 | −4.87 | 0.19 | 0.2 | 0.01 | 0.12 | 0.17 | 0.05 |
| 27 | 18.98 | 24.12 | 5.14 | 0.23 | 0.2 | −0.03 | 0.2 | 0.24 | 0.04 |
| 28 | 25.59 | 27.87 | 2.28 | 0.2 | 0.21 | 0.01 | 0.18 | 0.16 | −0.02 |
| 29 | 57.22 | 32.51 | −24.71 | 0.1 | 0.14 | 0.04 | 0.09 | 0.19 | 0.1 |
| 30 | 6.66 | 7.49 | 0.83 | 0.25 | 0.21 | −0.04 | 0.17 | 0.19 | 0.02 |
| 31 | 3.51 | 7.6 | 4.09 | 0.04 | 0.05 | 0.01 | 0.13 | 0.14 | 0.01 |
| 32 | 21.06 | 26.83 | 5.77 | 0.24 | 0.28 | 0.04 | 0.39 | 0.23 | −0.16 |
| 33 | 7.56 | 7.35 | −0.21 | 0.14 | 0.14 | 0 | 0.14 | 0.12 | −0.02 |
| Average (mg/kg) | 10.36 | 11.20 | 0.844 | 0.16 | 0.16 | 0.001 | 0.17 | 0.17 | 0.003 |
| STDEV (mg/kg) | 10.52 | 7.43 | 0.06 | 0.05 | 0.08 | 0.05 | |||
| CV (%) | 101.54 | 37.22 | 45.90 | ||||||
| RMSE (mg/kg) | 5.34 | 0.03 | 0.06 | ||||||
| RRMSE (%) | 51.55 | 17.1 | 36.34 | ||||||
Table 6.
The variance inflation factor (VIF) values of 15 spectral variables selected by the Boruta algorithm for estimating the content of soil heavy metal Cd.
Table 6.
The variance inflation factor (VIF) values of 15 spectral variables selected by the Boruta algorithm for estimating the content of soil heavy metal Cd.
| Spectral variables | FD367 | FD400 | FD647 | FD675 | FD693 | FD796 | FD879 | FD902 |
| VIF | 2.99 | 6.26 | 10.82 | 26.57 | 19.87 | 16.90 | 51.63 | 31.87 |
| Spectral variables | FD907 | FD1008 | FD1059 | FD1943 | FD2178 | FD2379 | ||
| VIF | 9.96 | 19.87 | 16.90 | 51.63 | 31.87 | 9.96 |
© 2019 by the authors. Licensee MDPI, Basel, Switzerland. This article is an open access article distributed under the terms and conditions of the Creative Commons Attribution (CC BY) license (http://creativecommons.org/licenses/by/4.0/).
Share and Cite
MDPI and ACS Style
Liu, Z.; Lu, Y.; Peng, Y.; Zhao, L.; Wang, G.; Hu, Y. Estimation of Soil Heavy Metal Content Using Hyperspectral Data. Remote Sens. 2019, 11, 1464. https://doi.org/10.3390/rs11121464
AMA Style
Liu Z, Lu Y, Peng Y, Zhao L, Wang G, Hu Y. Estimation of Soil Heavy Metal Content Using Hyperspectral Data. Remote Sensing. 2019; 11(12):1464. https://doi.org/10.3390/rs11121464
Chicago/Turabian StyleLiu, Zhenhua, Ying Lu, Yiping Peng, Li Zhao, Guangxing Wang, and Yueming Hu. 2019. "Estimation of Soil Heavy Metal Content Using Hyperspectral Data" Remote Sensing 11, no. 12: 1464. https://doi.org/10.3390/rs11121464
Note that from the first issue of 2016, this journal uses article numbers instead of page numbers. See further details here.