S2 Processing
This page deepens the information regarding the Sentinel-2 production’s logic baseline and algorithms and it’s targeted to all expert users looking for more details and explanation on product generation. It includes very specific information on products and is very helpful for users wishing to perform data processing.
Processing Baseline
The processing baseline indicates the version of the processing algorithm applied to the raw data to generate the products available to users. It is updated periodically to improve product quality and incorporate new algorithms or corrections. The baseline version is included in the product metadata. The Product Specification Document (PSD) provides detailed information about the structure, format, and content of Sentinel-2 products. The PSD ensures that users understand the different data levels, naming conventions, metadata structure, and the organization of the data files. Updates about the baselines and PSDs are announced via the Sentinel Online webpage.
The processing baseline Ground Image Processing Parameters (GIPP) (PROBAS- L1C, PROBA2 - L2A) are configuration files that evolve over the Mission lifetime. This evolution is done to manage the introduction of new product features or processing steps (e.g. introduction of the geometric refinement), and the correction of errors in the processing chain.
The evolutions of the processing baseline are tracked and justified in the 'Processing Baseline Status' section of the Data Quality Report that is published on a monthly basis by the Mission Performance Cluster (MPC) and available from the Sentinel Document Library.
L1C Processing Baseline
For the full list of processors' releases, please refer to the SentiBoard Processors page.
L2A Processing Baseline
For the full list of processors' releases, please refer to the SentiBoard Processors page.
Collection-1 Processing Baseline
The Copernicus Sentinel-2 Collection-1 is currently being generated using the Sentinel-2 historical archive to ensure consistent time series from Sentinel-2A and Sentinel-2B, with uniform processing baselines and enhanced calibration. This process particularly focuses on improving the geometric performance of the products and their radiometry. All historical data, from the launch of Sentinel-2A in 2015 up until December 13th, 2023 (when the latest processing baseline for Collection-1 reprocessing was released in operation), is scheduled for reprocessing.
Processing version | Acquisition dates of corresponding products | Content |
|---|---|---|
05.10 | 1 January 2022 – 13 December 2023 | Like PB 05.00 below, plus a computing optimization. Similar to PB 05.10 used in operation (starting from December 13th, 2023), see L1C operational Processing Baseline and L2A operational Processing Baseline |
05.00 | 4 July 2015 – 31 December 2021 | The improvements introduced in processing baselines up to baseline 04.00 (in operations since 25 January 2022) have been generalised to the historical archive:
Additional improvements are brought over the baseline 04.00:
|
It is highlighted that the Level-1C and Level-2A product format remains according to version 14.9 of the Product Specification Document (PSD v14.9).
L0 Algorithms
The Level-0 product is raw image data (on-board compressed) in raw Instrument Source Packet (ISP) format. It is initially processed to safeguard the integrity of the Near-Real-Time-acquired data. As summarised in Figure 1 this operation includes:
MSI telemetry analysis: concatenates acquired ISP data into granules and performs data analysis and error detection functions
Datation: the datation of the individual lines in an image enables the exact capture time of each ISP within a granule to be recorded
Low resolution image extraction: extracts the low-resolution images for quicklook generation
Satellite ancillary telemetry analysis: compares extracted satellite ancillary data from bit values and checks it relative to pre-defined admissible ranges
As highlighted previously, the Level-0 initial processing, performed to preserve the integrity of the acquired data, occurs in real-time (i.e. in parallel to data reception). By contrast, Level-0 consolidation and downstream processing activities (i.e. to Level-1) are delayed until triggered by the on-ground recovery of the ancillary data. This occurs at the end of every satellite pass. Ancillary data are ingested together with the MSI raw data at the beginning of the Level-0 consolidation processing collates and appends all necessary metadata required for archiving and onward processing to Level-1.
Level-0 viewing model initialisation: computes the viewing model for generation of the Preliminary Quicklook (PQL)
PQL processing: this step includes the PQL resampling and the computation of ancillary data for the consolidated Level-0 product
Preliminary cloud mask processing: generates the cloud mask from the PQL based on spectral criteria
PQL compression: performs the compression of the PQL
The position of these initial processes can be seen in the middle of Figure 1, up to the output block named Level-0 (Consolidated).
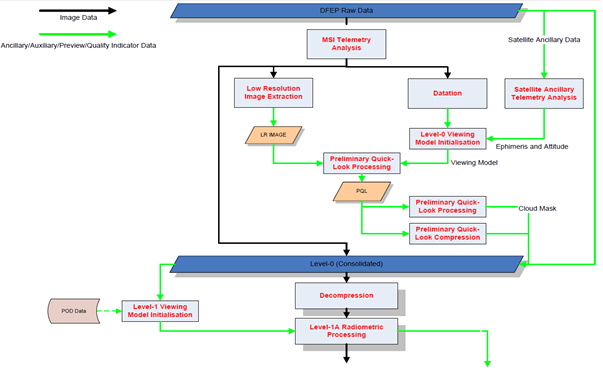
Figure 1: Level-0 Processing Workflow
L1A Algorithms
Level-1A processing includes:
Level-1 viewing model initialisation: This processing step computes the viewing model that will be used to initialize Level-1B processing. It uses the Precise Orbit Determination (POD) products.
Decompression: This processing step decompresses the ISPs.
Level-1A radiometric processing: This step includes the SWIR pixels arrangement.
Level-1A compression: This processing step uses the JPEG2000 algorithm to compress the Level-1A imagery.
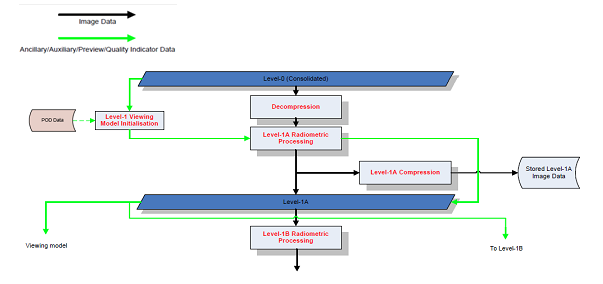
Figure 2: Level-1A Processing Overview
L1B Algorithms
The Level-1B processing aims to generate TOA calibrated radiance from input Level-1A TOA radiance data. It includes:
inverse of on-board equalization
equalization correction
dark current correction including offset and non-uniformity correction (if equalization correction activated)
blind pixels removal
cross-talk correction including optical and electronic crosstalk correction
relative response correction
SWIR rearrangement
defective pixels correction
restoration including deconvolution and denoising (optional). This correction is disabled by default in the Level-1B processing.
binning for 60 m bands (B1, B9 and B10)
no data pixels correction
radiometric offset addition to avoid truncation of negative values
masks management including saturated Level-1B masks generation, no_data mask generation, defective masks generation.
physical geometric model refinement (which is not applied at this level)
Common Geometry Grid Computation for Image-GRI Registration, defining the common monolithic geometry in which the Global Reference Images (GRI) and the reference band of the image to refine shall be resampled.
Resampling on Common Geometry Grid for Image-GRI Registration, performing the resampling on the common geometry grid for the registration between the GRI and the reference band.
Tie-Points Collection for Image-GRI Registration, including the collection of the tie-points from the two images for the registration between the GRI and the reference band.
Tie-Points Filtering for Image-GRI Registration, performing a filtering of the tie-points over several areas (sub-scenes) and a given number of trusted tie-points is required for each subscene.
Spatiotriangulation for Image-GRI Registration, refining the viewing model using the initialized viewing model and the set of Ground Control Points (GCPs) from previous steps. The output refined model ensures the registration between the GRI and the reference band.
Optional Steps in VNIR-SWIR Registration Processing:
Common Geometry Grid Computation for VNIR-SWIR Registration, defining the common geometry in which the registration will be performed.
Resampling on Common Geometry Grid for VNIR-SWIR Registration, performing the resampling on the common geometry grid for the registration between VNIR and SWIR bands.
Tie-Points Collection for VNIR-SWIR Registration, including the collection of the tie-points from the two images for the refinement of the registration between VNIR and SWIR focal planes.
Tie-Points Filtering for VNIR-SWIR Registration, performing a filtering of the tie-points over several areas (sub-scenes) and a given number of trusted tie-points are required for each subscene.
Spatiotriangulation for VNIR-SWIR Registration, refining the viewing model using the initialized viewing model and the set of ground control points from previous steps. The output of this step is a refined viewing model ensuring the registration between VNIR and SWIR focal planes.
Level-1B Compression compresses Level-1B imagery using the JPEG2000 algorithm. The Kakadu software library is used for the JP2K compression of product images.
These steps are chained and activated for each band. Each algorithm step is described below; please refer to the Level 1 ATBD for more details about the algorithms.
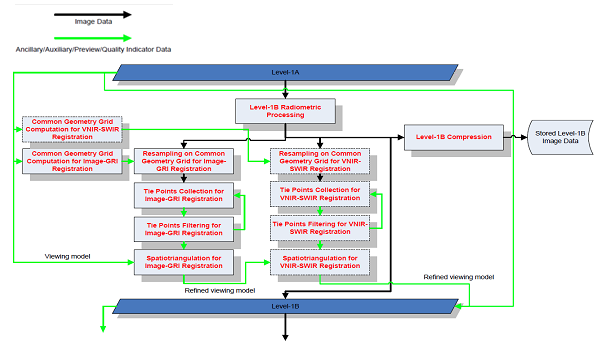
Figure 3: Level-1B Processing Overview
Radiometric Corrections
The Sentinel-2/MSI radiometric model is given by Equation 1:

Equation 1: Sentinel-2 Radiometric Model
Where:
Y(p,l,b,d) is the raw signal of pixel p corrected from the dark signal and from the pixel contextual offset (expressed in Least Significant Bit (LSB))
Z(p,l,b,d) is the equalized signal also corrected from non-linearity (expressed in LSB)
ϒ(p,b,d,Y(p,l,b,d)) is a function that compensates the non-linearity of the global response of the pixel p and its relative behaviour with respect to other pixels
DS(p,j,b,d), is the dark signal of the pixel p in channel b, for chronogram sub-cycle line number j (j is within 1 to 6)
PCmasked(p,l,b,d) is the pixel contextual offset. It aims at compensating the dark signal variation due to voltages fluctuations with temperature.
Two different functions are required for modelling ϒ (p,b,d,Y(p,l,b,d)):
a piece-wise linear (two parts: bilinear)
a cubic (polynomial of degree 3)
For VNIR channels, the baseline is to consider a polynomial function of degree 3 to have a best fit of the detector response. For SWIR channel, the bilinear is the baseline option that will be used.
Inversion of the On-board Equalization
The bilinear equalization is applied on-board to both channels (VNIR and SWIR) and per detection line before compression to reduce compression effect on detector photo-response non-uniformity.
An inversion of the on-board equalization is performed to retrieve the original detectors response Xk(i,j) and further radiometric corrections are applied such as cross-talk correction and improved equalization processing.
As output a reverse equalized image (output image is called X in the mathematical description) is obtained.
Equalization Correction
The objective of equalization is to achieve a uniform image when the observed landscape is uniform. It is performed by correcting the image of the relative response of the detectors (if equalization correction is activated).
Dark Signal Correction
The dark signal correction involves correcting an unequalised image by subtracting the dark signal (if equalization correction is activated). The dark signal DS(p,j) can be decomposed as shown in Equation 2:

Equation 2: Sentinel-2 Dark Signal
a cyclic component that does not evolve with time: DS(p,j,b,d) is the dark signal of the pixel p in channel b, for chronogram sub-cycle line number j (j is within 1 to 6 for 10 m resolution band, 1 to 3 for 20 m band, and equal 1 for 60 m band);
a residual with time: PCmasked(p,l,b,d) is the pixel contextual offset (Dark Signal Offset).
Dark Signal Non-Uniformity
Variability in the dark signal arises as a result of the different time required for integration by the individual bands. This signal varies as a function of the line number with a spatial frequency.
Defining a cycle by the integration time for 60 m bands, there are:
six different working configurations, i.e. six different dark signals, for 10 m bands
three different dark signals for 20 m bands
one dark signal for 60 m bands.
For a given line 'i' in the image, the corresponding dark signal depends on the line number inside the area. The average of 'i' observations assumes that the same radiance is observed and allows noise reduction (Equation 3).

Equation 3: Sentinel-2 Dark Signal Uniformity
Where Nm is the number of lines being summed, and j is an index within the range [1,6] corresponding to the chronogram sub-cycle line numbe (j is within [1,6] range for 10 m bands, [1,3] for 20 m bands and [1,1] for 60 m bands).
DS(p,j,b,d) is determined as an average of the dark signal along the columns and therefore is independent of the line variable.
Dark Signal Offset
The offset variation of dark signal is due to voltage fluctuations. To compensate for this signal, an offset for each line is computed using blind pixels located at the extremity of each detector module. The number of blind pixels depends on the band (32 blind pixels for 10 m bands, and 16 blind pixels for 20 m and 60 m bands). For each band, each detector module and each line of the image, the offset is computed as the average value of the signal acquired by the valid blind pixels:

Equation 4: Sentinel-2 Dark Offset Computation
Where N is the number of valid blind pixels per detector module and l the blind pixel index and Inter_Image is the raw image corrected from the application of the Non-Uniformity Dark signal.
Blind Pixel Removal
For each band and each detector module, blind pixels are removed from the image product.
Crosstalk Correction
Crosstalk correction involves correcting parasitic signal at pixel level from two distinct sources: electronic and optical crosstalk (if equalization correction is activated).
In both cases, the parasitic signal of a pixel in a given band is modelled as a linear function of the signal in the other bands acquired at the same time and at the same position across track.
Relative Response Correction
Relative response correction involves correcting the image of the relative response of the detectors (if equalization correction is activated). The correction applies respectively a bilinear and a three-degree polynomial function to the SWIR and VNIR channels.
The coefficients of the polynomial function are made from sun diffuser observations during calibration mode; the BRDF of the diffuser being characterised before launch. An estimation of the coefficients for each instrument is performed at the same time as the estimation of the absolute radiometric calibration, i.e. every three repeat cycles (30 days). Assuming that the response of the instrument is a cubic function (e.g. VNIR channels) of the radiance, Eq. (1) can be written as:

Equation 5: Sentinel-2 Equalization Correction
In case of the SWIR band Equation (3) becomes:

Equation 6: Sentinel-2 Equalization Correction
Where:
G3, G2, G1 and G0 are the parameters of the cubic model and A1, A2, Zc and Zs are the parameter of the bilinear model.
Equalization processing is performed for each non-defective pixel or non-blind pixel.
SWIR Rearrangement
Pixels of the SWIR bands (band 10, band 11 and band 12) are rearranged. For the SWIR bands, each detector module is composed of three lines for band 10 and four lines for band 11 and band 12. To make optimal use of the pixels with the best SNR for the acquisition, one pixel over three lines for band 10 and two successive pixels over four lines for band 11 and band 12 is selected for each column. In the instrument, these bands work in Time Delay Integration (TDI) mode and are re-arranged along columns on the ground. This algorithmic procedure ensures the best registration between columns of SWIR images.
For 20 m resolution bands (band 11, band 12), the shift to be applied is ± 1 pixel.
For 60 m resolution band (band 10), the shift to be applied is ± 1/3 pixel and is performed using a one-dimensional filter.
Defective Pixel Correction
Defective pixel correction involves allocating to a defective pixel, a value corresponding to the bicubic interpolated radiometry of its neighbouring pixels (if they are valid, and their value is greater than a threshold).
Defective pixels can arise as a result of:
weak response that cannot be compensated for by equalization
saturated response
temporal instability
As well as the pixel position and the type of defect, the interpolation filter is provided in a GIPP. The maximum number of allowed adjacent defective pixels is defined by a threshold provided in a GIPP as well. If the number of adjacent pixels is outside the threshold, the correction is not applied.
Holes in the spectral filters can also affect the Sentinel-2 images. The same correction as for defective pixels is applied.
Restoration
Restoration processing combines two actions:
image de-convolution - applying a bi-dimensional spatial filter to the effect of the MTF to enhance the contrast
image de-noising - performing a decomposition of the image in wavelet packets.
De-convolution processing compensates for blurring due to instrumental MTF. De-convolution is recommended when the MTF at Nyquist frequency is low, however, de-convolution processing increases the noise for high spatial frequencies, particularly over uniform areas. This phenomenon is limited by dedicated de-noising.
De-convolution is performed by Fourier Transform (FT) and the de-noising process is based on a thresholding technique of wavelets coefficients.
These restoration processes are currently disabled by default in the Level-1B processing. It is not recommended to use the restoration step because the instrument's MTF is already high enough.
Binning for 60 m Bands
For bands B1, B9 and B10, the spatial resolution is approximately 60 m along track and approximately 20 m across track. To achieve a homogeneous resolution (i.e. 60 m) both along and across track, these bands are filtered and sub-sampled in the across track direction. The filter and the sampling rate (3, by default) are provided in a GIPP by the IQP.
No Data Pixels
Pixels with no data generally correspond to missing lines within the image product. These pixels are identified in a mask provided with the product.
To correct for no data, and to insert a value, these pixels are interpolated using neighbouring valid lines. The interpolation filter is provided in a GIPP. A threshold for the maximum number of missing joined lines is defined. This threshold is provided in a GIPP. Beyond this threshold, no correction processing is applied.
Radiometric Offset
To avoid truncation of negative values, the dynamic range of both Sentinel-2A and Sentinel-2B is shifted by a band-dependent constant radiometric offset called RADIO_ADD_OFFSET and defined in a configuration file. The new pixel value is computed as following:
NewDN= CurrentDN - RADIO_ADD_OFFSET
Note that in the convention used, the offset is a negative value.
It is important to note that:
the radiometric offset will have no impact on the generation of the numerical saturation value, as it will be added up after. Moreover, there will be no saturation due to this offset as the measured levels are far from the numerical saturation for Level-1B data. Indeed, for a 12-bit integer, numerical saturation is reached for a value of 4095.
adding an offset for Level-1B would imply that this offset should be handled by the refining and should be subtracted before the Level-1C projection and TOA conversion.
Saturated Pixels
Saturated pixels are identified in a mask associated to the product. No correction is applied.
Geometric processing
After the radiometry step, and to improve the accuracy of geolocation performance, a geometric refinement can be carried out. This operation occurs before the orthorectification process for Level-1C products. It is performed on the full swath by the longest possible length in automatic mode.
Viewing model refining
The viewing model includes:
a datation model for determining the exact start date of each line ,
a tabulated orbital data, allowing to know the position of the spacecraft at the time of the line acquisition.
a tabulated attitude data, allowing to know the orientation of the spacecraft at the time of the line acquisition.
the viewing directions in the spacecraft piloting frame.
The viewing model allows to compute the viewing vector (line of sight) at the time of the pixel acquisition. By intersecting this viewing vector with an Earth model, it is possible to compute the geolocation (or direct location) of the pixel, and inversely, to determine the position of a point on the ground in the image (Image location or inverse location).
However, the attitude and orbital data are known with a given precision, due to the sensors inaccuracy: GPS, attitude sensors. Additionally, thermo-elastic effects at the scale of the orbit can also impact the accuracy of the geolocation. To improve the geolocation performance, geometric refining can be applied by adding polynomial corrections to the viewing model.
To correct the position data, a polynomial function of time is estimated. The polynomial coefficients are estimated by a mean square regression called the spatio-triangulation. The polynomial functions coefficients, correcting the attitude and orbital information used by the location functions (geolocation function and inverse location function), are computed so as to minimise the average residual values (cf. Figure 4) of a large number of Ground Control Points (GCP). To sum up, the refining outputs are the polynomial functions correcting attitude and orbital data.
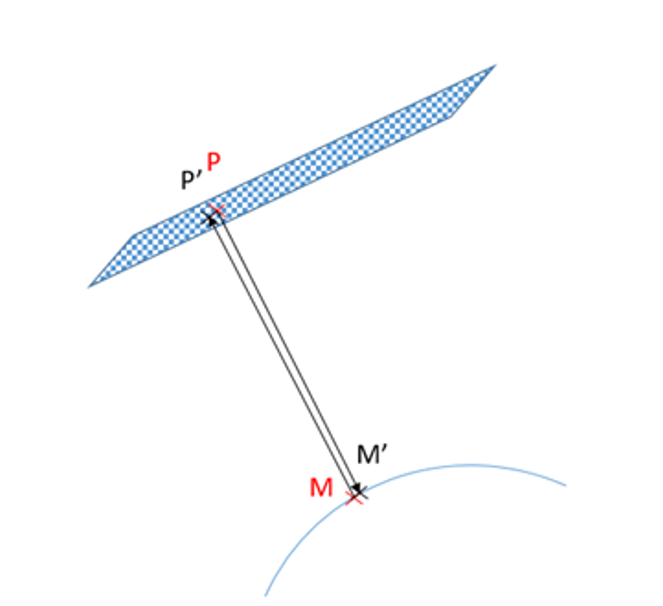
Figure 4: Illustration of residuals distance values (P-P') and (M-M')
Ground Control Points Selection
Common geometry resampling
To find the GCP necessary to the refining, a correlation is performed between the reference segment and the segment to refine. This correlation is high when images with similar spectral contents, at a similar resolution and in a similar geometry are used.
The first two conditions are guaranteed by using one reference spectral band for the correlation process. The reference cover is called the Global Reference Image (GRI).
The GRI is a set of globally acquired, cloud-free, mono-spectral (B4, red channel) Level-1B Sentinel-2 images. The GRI, illustrated in Figure 5, is composed of roughly 1000 images. The cloudy areas are constituted of a stack of overlapping images in order to limit clouds and ensure a full coverage.
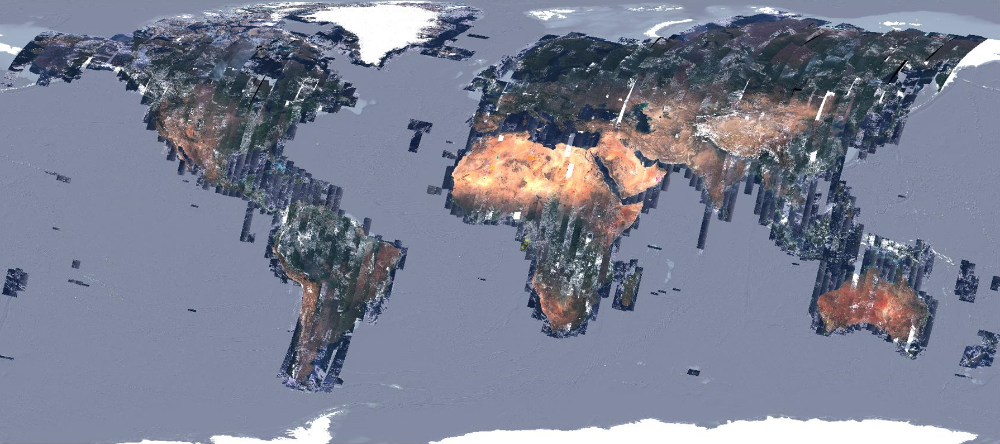
Figure 5: Overview of Sentinel-2 GRI images
Products over Svalbard, isolated islands at high latitude and Antarctica are not covered by the GRI so are not refined. Moreover, several orbits covering Greenland and Northern Canada (Nunavut and Yukon territories) could not be completed. Please also note that orbit R109 is empty because it is almost totally located over sea.
For the last condition (similar geometry), it is necessary to resample the two segments in a common virtual geometry, because of Sentinel-2 specificities: the images are split in 12 detectors and the pointing precision is at worst 2 kms.
This viewing model of the common virtual geometry is computed by:
constructing an average regular datation model over the segment to refine,
selecting the attitude and orbital data of the segment to refine
and by computing regular viewing directions, as if it were a push-broom sensor, composed of one single detector, covering the whole Sentinel-2 swath.
The two images are then resampled, using the resampling grids, an interpolation filter and the definition of interest area for each detector, as illustrated in Figure 6. Then the correlation is performed between two monolithic images composed of one single detector. This guarantees that the processing is homogeneous for all the detectors and allows detection of yaw angle. It has to be noticed that this common geometry is only used for the correlation process for finding GCP and is then discarded.
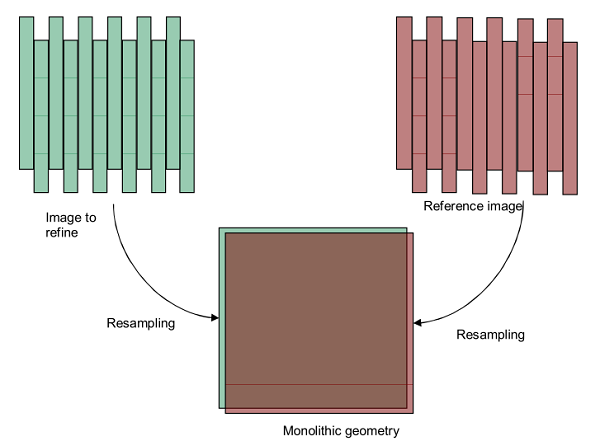
Figure 6: Resampling in a Monolithic Geometry
Tie points collection and filtering
A spatial correlation between a correlation window of reference image (vignette 1) and a research window image to refine (vignette 2) is performed for each pixel. Then, for each pixel of the vignette 2, a resemblance criterion is computed: it is the normalized covariance. The set of all criterion values make a grid of resemblance criteria. The maximum of correlation and a curvature are computed by fitting this grid of resemblance criteria to a quadratic function. The best candidate points coordinates correspond to the maximum of the quadratic function with high curvature. A threshold on the maximum correlation value and the curvature and a filter to eliminate wrong points are applied to obtain the homologous points.
This defines a set of tie points, as illustrated in Figure 7.
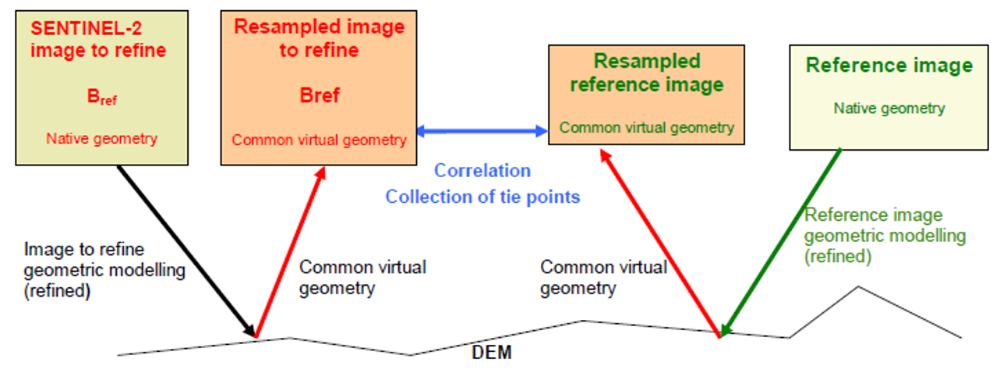
Figure 7: Tie points collection
This grid of measured differences between the two images is filtered in order to select tie points with a specific strategy: the image is divided into several areas (sub-scenes) and a given number of trusty tie points is required for each sub-scene. If the required number of points cannot be found in a given subscene, this area is densified using image matching with a lower step. If there are more tie points than the required number, a random selection is performed. The algorithm fails if it cannot get the requested number of points for a minimum number of sub-scenes.
From tie points to GCPs
Due to parallax between odd and event detectors, as shown in Figure 8, the tie-points need to be converted in native geometry.
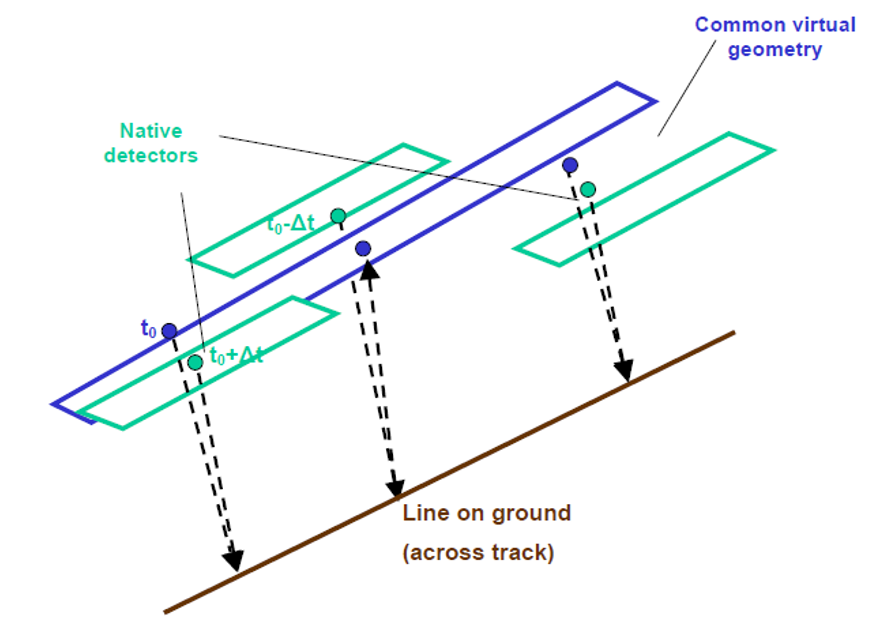
Figure 8: Line on ground seen at different dates by odd as even detectors
Then the tie-points coordinates of the reference image are converted in geometric coordinates (latitude, longitude, altitude) using the Copernicus DEM - Global and European Digital Elevation Model (COP-DEM) and the reference geometric model.
The following Figure 9 sums up the different steps, which take place for the conversion of tie points to ground control points.
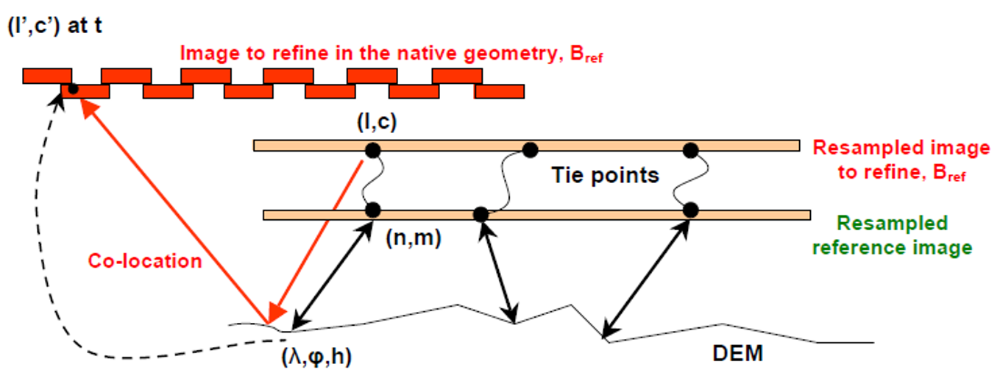
Figure 9: Tie points to GCPs conversion
Geometric refining
The geometric refining of the viewing model is done by spatio-triangulation using GCPs extracted at the previous step, with the parameters to refine and for each, the degree of the modelling polynomial function, chosen among:
Spacecraft gravity centre position: X, Y, Z in WGS and type of correction: constant or polynomial function of time.
Attitudes: roll, pitch and yaw, type of correction: constant or polynomial function of time.
Spacecraft to focal plane transformation: rotation (3 angles), translation, homothetic transformation, type of correction: constant or polynomial function.
The default setting is given below and illustrated in Figure 10:
Attitudes:
roll, pitch, yaw in spacecraft frame
correction modelled by a bias and a drift
Spacecraft gravity centre position:
X, Y, Z in WGS84
correction modelled by a second-degree polynomial function
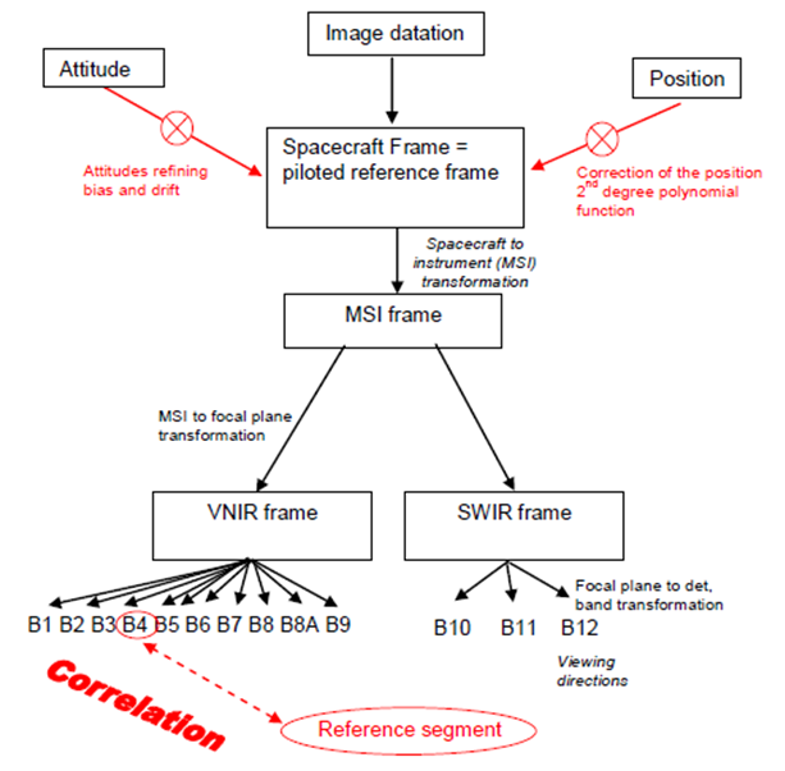
Figure 10: Viewing model and parameters to refine
L1C Algorithms
The Level-1C processing uses the Level-1B product and applies radiometric and geometric corrections (including orthorectification and spatial registration) to generate the Level-1C (TOA reflectance) product
Level-1C processing is broken down into the following steps:
Level-1C Tiles Association. This module selects predefined tiles which intersect the image footprint.
Level-1C Resampling Grid Computation. This step calculates the resampling grids, linking the image in native geometry to the target geometry (orthoimage).
Resampling on Level-1C Geometry. This processing step resamples each spectral band in the geometry of the orthoimage using the resampling grids and an interpolation filter. In addition, it calculates the TOA reflectance.
Masks Computation. This step generates the cloud, cirrus and snow/ice masks at Level-1C geometry.
Level-1C Compression. This processing step compresses Level-1C imagery using the JPEG2000 algorithm. Level-1C data is generated at the end of this step.
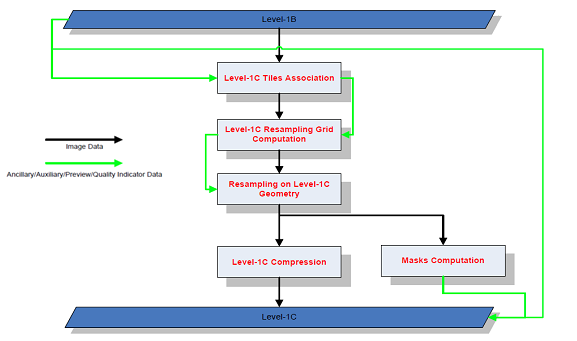
Figure 11: Level-1C Processing Overview
Ortho-image generation
The different steps of this ortho-image generation are:
Tiling module to select pre-defined tiles, which intersect the image footprint.
Computation of resampling grids, linking the image in native geometry to the target geometry (ortho-image).
Resampling of each spectral band in the geometry of the ortho-image using the resampling grids and an interpolation filter to compute the pixel radiometry.
Resampling grids computation
For Sentinel-2 orthorectification, the resampling is complex and cannot be modelled by analytic transformation. Figure 12 shows the resampling grids that have to be computed between the source geometry of the native sensor (Level-1B geometry) and the target geometry (each ortho-image tile).
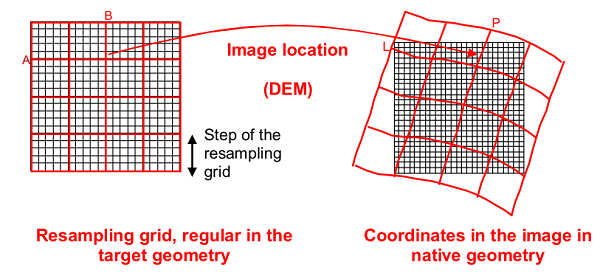
Figure 12: Resampling Grid
For each point (a,b) of the ortho-image, the coordinates (l,c) of the corresponding pixel in the native image is computed by bilinear interpolation of the 4 adjacent nodes (L, C), as shown in Figure 13.
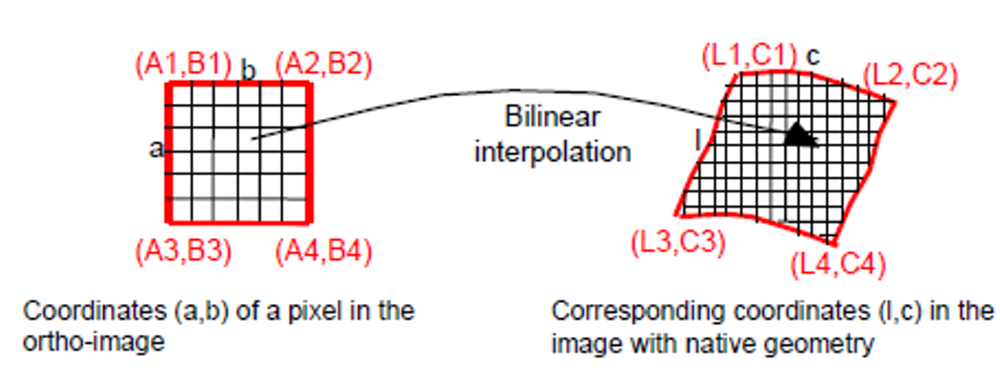
Figure 13: Resampling grid interpolation
The geometric deformations are then supposed to be linear within a mesh; this approximation is acceptable if the step of the resampling grid is “small” enough.
Resampling grids computation is based in three steps:
Transformation of the native coordinates into the DEM referential.
DEM interpolation to get each grid point altitude.
Image location computation to the source geometry by the physical model.
There is a grid for each band and each detector.
More details about the last DEM versions and how to access the data is available at Copernicus DEM - Global and European Digital Elevation Model (COP-DEM).
Radiometric Interpolation
The radiance values of the target point is computed based on the radiance of nearby pixels using cubic spline functions.
TOA Reflectance Computation
The numeric digital counts (CN) of each pixel image (i,j) and each spectral band (k) are converted in TOA reflectance (ρ). This conversion takes into account the equivalent extra-terrestrial solar spectrum (Es), the incoming solar direction defined by its zenith angle (θs) for each pixel of the image and the absolute calibration (Ak) of the instrument MSI.
The conversion equation is:

Equation 7: Top of Atmosphere conversion
Where:
CNk,NTDI is the equalized numeric digital count of the pixel (i,j) with NTDI, the number of Sentinel-2 TDI lines, after removing the Level-1B offset (RADIO _ADD_OFFSET) added during the Level-1B generation
Ak;NTDI is the absolute calibration coefficient
Es is the equivalent extra-terrestrial solar spectrum and depends on the spectral response of the Sentinel-2 bands
The component d(t) is the correction for the sun-Earth distance variation (see Equation 8). It utilises the inverse square law of irradiance, under which, the intensity (or irradiance) of light radiating from a point source is inversely proportional to the square of the distance from the source.

Equation 8: Earth Sun distance
Where:
t is the Julian Day which corresponds to the acquisition date (reference day: 01/01/1950)
t0=2
e is the eccentricity of the Earth orbit, e=0.01673
n is the Earth orbit angular velocity, n=0.0172 rad/day
The parameters Ak and Es are provided by the GIPP and are also included in the ancillary data of the Level-1 products.
The sun zenith angles are determined at this level too. A sun angle grid is computed by regularly down-sampling the target geometry (Level-1C tile). The cosine of the zenith angle θs is defined at each point of the grid using the ground coordinates and the datation of the corresponding pixel acquisition. The azimuth angle is not processed here.
For Level-1C products, the noise model is also adapted to the new range of TOA reflectance radiometric values. The parameters (Ak,Es) of the Level-1B noise model are corrected using Equation 1 by replacing CNk with the Level-1B parameters Ak1B and Es1B.
The reflectance, often between 0 and 1, is converted into integer values, in order to preserve the dynamic range of the data by applying a fixed coefficient (10000 by default) called QUANTIFICATION_VALUE.
In order to avoid truncation of negative values, the dynamic range of Level-1C products (starting with the PB 04.00 introduced the 25th of January 2022) is shifted by a band-dependent constant radiometric offset called RADIO_ADD_OFFSET.
Before storage inside L1C (in a 16 bits integer format), a quantization gain and the offset are applied to the computed TOA reflectance (ρ).
L1C_DN = ρ * QUANTIFICATION_VALUE - RADIO_ADD_OFFSET
The L1C product's metadata includes the values for the QUANTIFICATION_VALUE and RADIO_ADD_OFFSET.
Please also note that:
the radiometric offset is defined as a negative value.
the radiometric offset will have no impact on the generation of the saturation value, as it will be added up after. Moreover, there will be no saturation due to this offset as the measured levels are far from the numerical saturation level (32767) for Level-1C data.
Computation of the Masks
The last operation to obtain the final Level-1C product is computation of the masks for a tile in the Level-1C geometry.
The Level-1C masks are in in raster format (JP2000, single-bit/multi-layer raster files) and are composed of:
MSK_CLASSI (cloud, cirrus and snow)
MSK_QUALIT (lost ancillary packets, degraded ancillary packets, lost MSI packets, degraded MSI packets, defective pixels, no data, partially corrected crosstalk and saturated pixels)
MSK_DETFOO: the 12 detector footprints
The computation of these masks is explained and detailed in the Masks section.
Auxiliary Data Files (ADFs)
Auxiliary data is all other data (i.e. excluding direct measurements from the instrument and information on platform orbital dynamics) necessary for product processing and generation.
ADFs, such as the Copernicus DEM - Global and European Digital Elevation Model (DEM) or the Global Reference Image (GRI), that are used in the generation of Level-1 and Level-2A products, are verified before use to ensure the processing chain is not compromised. The GRI enables the automatic creation of Ground Control Points (GCPs) for Level-1C processing.
For Sentinel-2, auxiliary data is composed of:
On-Board Configuration Data (OBCD), comprised of on-board configuration parameters and payload and platform characterisation data
On-Ground Configuration Data (OGCD), which, for Level-1 and Level-2A products, is composed of Ground Image Processing Parameters (GIPP) and includes the DEM, the GRI, the ECMWF and CAMS auxiliary files, the International Earth Rotation and Reference Systems Service (IERS) Bulletins and the processors versions.
Each OBCD and OGCD file is identified by the type of data, applicability date, version number and the satellite to which it is applicable (Sentinel-2A, Sentinel-2B or both). Any update of one or other of the files will result in the other being updated at the same time. All auxiliary data used for Level-1B, Level-1C and Level-2A processing can be identified in the metadata accompanying the product.
Masks
Cloud Masks
The cloud mask is included in the MSK_CLASSI and contains both opaque clouds and cirrus clouds with an indicator specifying the cloud type (cirrus or opaque cloud). Three spectral bands are used to process this mask: a blue band (B1 (443 nm) or B2 (490 nm)), the band B10 (1375 nm) and a SWIR band (B11 (1610 nm) or B12 (2190 nm)).
The blue and the SWIR bands are defined in a GIPP. By default, the BLUE band is the band B1 and the SWIR band is the band B11.
The processing is performed at a spatial resolution of 60 m (the lower resolution of the three spectral bands).
The processing steps are:
Resampling the data in 60 m resolution (modification of the spatial resolution + radiometric interpolation),
Cloud detection.
The cloud detection is based on spectral criteria:
Opaque cloud mask: the same criteria as for the inventory, described in paragraph 3.1.4, are used.
Cirrus mask: the cirrus clouds are very wispy and are often transparent. They form themselves only at high altitudes (about 6 or 7 km above the Earth’s surface). These properties are used to discriminate this type of clouds from opaque clouds. Therefore, the cirrus mask processing is based on two spectral criteria. As cirrus clouds are formed only at high altitude, they are characterised by a high reflectance in the band B10 (1375 nm). As they are also semi-transparent, they are not detected by the blue threshold defined above. A pixel, which respects these two criteria, has a good probability to be a cirrus. Nevertheless, it is important to notice that it is just a probability and not a certainty. Indeed, there exists some opaque clouds which are characterised by a low reflectance in the blue band and which are detected by this cirrus mask algorithm.
The cloud mask determination method is then composed of theses following steps:
Atmospheric correction
Threshold on blue reflectance for opaque clouds detection
Threshold on B10, including a threshold modulation in accordance with ground elevation, to detect cirrus clouds.
Snow index calculation
Cloud masks refinement
Mathematical morphology
Some of them are detailed in the next paragraphs.
Atmospheric correction
Ground reflectance is not the only contributor to the signal observed by the satellite. In fact, the Rayleigh diffusion and the aerosols diffusion add a positive contribution. Consequently, by removing the diffuse atmospheric contribution, it should improve the effectiveness of the thresholds that are applied to the reflectance.
The aerosols atmospheric content is very variable in time and space, and it is almost impossible to predict it. On the other hand, Rayleigh diffusion depends on the acquisition geometry (solar and viewing angles) and is perfectly modelled by radiative transfer code. It is then proposed, as a pre-processing, to remove the effect of the Rayleigh diffusion. For that, a Look Up Table (LUT) was created. It contains the top of atmosphere reflectance due to the Rayleigh diffusion for many different acquisition geometries. The solar zenithal angle has been chosen in a range from 0° to 90° with a step of 5°, the viewing zenithal angle in a range from 0° to 20° with a step of 5° and the difference between the solar azimuthal angle and the viewing azimuthal angle in a range from 0° to 360° with a step of 10°. The reflectance due to Rayleigh diffusion has been calculated in each case with the 6S radiative transfer code and is stored in an ascii file.
B10 altitude thresholding
The B10 band is an absorption band of water vapor so, at low altitude, this band shows clouds and not ground. Indeed, the B10 band detects only things at high altitude (cirrus clouds, top of the opaque clouds and mountaintops). The cirrus cloud mask is essentially calculated with the spectral band B10. Nevertheless, mountaintops higher than about 3,000 m of altitude are, at least, as bright as cirrus clouds. So, beyond an elevation of 3,000 m, it is impossible to distinguish cirrus clouds and ground that is why the cirrus cloud mask is calculated only below 3,000 m. Moreover, at this altitude, ground has, in general, a reflectance on B10 below 0.0220.
To avoid these false detections, a modulation of the B10 threshold value is created as follows:

Figure 14: Absorption spectrum of water vapor with Sentinel-2 band B10
This modification is applied on cirrus cloud mask and opaque cloud mask.
Snow index calculation
With the spectral criteria used for opaque cloud detection algorithm, snow is most of the time identified as opaque clouds. Snow, on mountain, is as bright as opaque clouds in bands B1 and B10. To avert these false detections, a snow index can be derived from bands B4 (665 nm) and B11 (1610 nm). Indeed, snow reflectance is very low in B11 but not in B4 as shown in next figure:
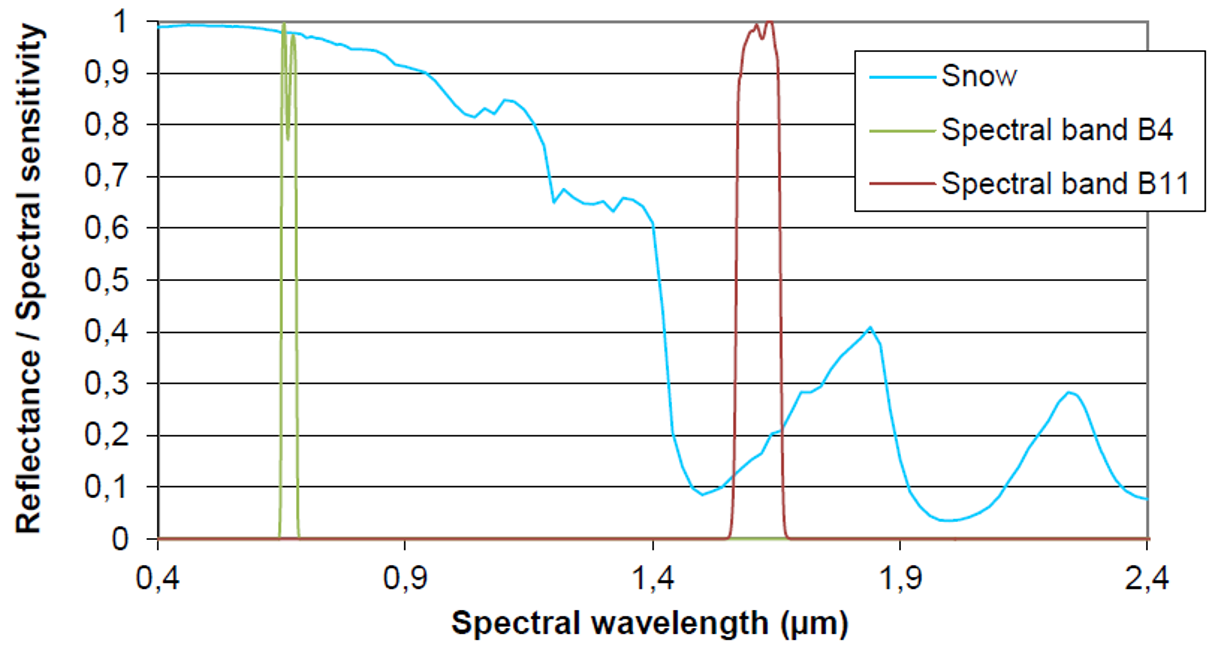
Figure 15: Evolution of threshold_B10 with ground elevation in wetlands
The snow index is defined as follows:
Snow_index = (B4) / (B11)
Then it is possible to create a snow mask with this index:
If (B1) > threshold_B1 and B10 < threshold_B10 modulatedWithGroundElevation and snow_index > threshold_snow_index:
Pixel is snow
This mask allows distinguishing snow and opaque clouds.
Cloud mask refinement
The clouds masks can be computed taking the snow masks and the threshold on B10 modulated with ground elevation as follows:
If (B1) > threshold_B1 and Pixel is not snow
Pixel is opaque
Else If (B1) < threshold_B1
(B10) > threshold_B10 modulatedWithGroundElevation
Pixel is cirrus
A pixel is declared cloudy if it satisfies the criteria defined above. A cloud image is then filled in with 0 if is a cloud free pixel, 1 if it is an opaque pixel and 2 for a cirrus pixel. Nevertheless, these criteria are not perfect. There could be false detections due to a high reflected feature in the blue band or due to a geometric error. Indeed, clouds are not spectrally registered.
To limit the impact of such errors, a filtering is performed on the cloud masks (on the opaque and on the cirrus masks separately) using an opening (morphology-based operations). This processing ensures that a pixel declared cloud free is really cloud free. The intersection of the two masks is then handled after the filtering operation. If a pixel has two labels (i.e. 1 and 2), the opaque label (1) prevails.
The percentage of cloudy pixels is calculated on the cloud mask. It corresponds to the ratio between the pixels declared cloudy (including opaque and cirrus clouds: label 1 and label 2) and the total number of pixels in the image.
The percentage of cirrus clouds is also calculated on the cloud mask. It corresponds to the ratio between the pixels declared cirrus (label 2) and the pixels declared cloudy (including cirrus and opaque clouds).
L2A Algorithms
The Level-2A processing includes a Scene Classification and an Atmospheric Correction applied to Top-Of-Atmosphere (TOA) Level-1C orthoimage products. Level-2A main output is an orthoimage atmospherically corrected, Surface Reflectance product.
Please be aware that "Surface Reflectance (SR)" is a new term that has been introduced to replace the former one: "Bottom of Atmosphere (BOA) reflectance."
The Level-2A algorithms have been developed by DLR/Telespazio, and rely on Sen2Cor [R1] processor algorithm is a combination of state-of-the-art techniques for performing atmospheric corrections which have been tailored to the Sentinel-2 environment together with a scene classification module described in [R2].
Defective, non-existent and saturated pixels are excluded from the Level-2A processing steps. The surface reflectance is performed at the resolution of the native products depending on the band resolution (10, 20 and 60 m). The Level-2A algorithms require information derived from bands with different resolutions. Some channels are resampled at 60 m for the needs of the algorithms.
The Scene Classification (SCL) algorithm allows the detection of clouds, snow and cloud shadows and generation of a classification map, which consists of three different classes for clouds (including cirrus), together with six different classifications for shadows, cloud shadows, vegetation, not vegetated, water and snow. Cloud screening is applied to the data in order to retrieve accurate atmospheric and surface parameters during the atmospheric correction step. The L2A SCL map can also be a valuable input for further processing steps or data analysis.
The SCL algorithm uses the reflective properties of scene features to establish the presence or absence of clouds in a scene. It is based on a series of threshold tests that use as input: TOA reflectance of several Sentinel-2 spectral bands, band ratios and indexes like Normalised Difference Vegetation Index (NDVI) and Normalised Difference Snow and Ice Index (NDSI). For each of these threshold tests, a level of confidence is associated. It produces at the end of the processing chain a probabilistic cloud mask quality indicator and a snow mask quality indicator. The most recent version of the SCL algorithm includes also morphological operations, usage of auxiliary data like Digital Elevation Model and Land Cover information and exploit the parallax characteristics of Sentinel-2 MSI instrument to improve its overall classification accuracy.
The aerosol type and visibility or optical thickness of the atmosphere is derived using the Dense Dark Vegetation (DDV) algorithm [R3]. This algorithm requires that the scene contains reference areas of known reflectance behaviour, preferably DDV and water bodies. The algorithm starts with a user-defined visibility (default: 40 km).
If there are not enough DDV-pixels present in the image, then the aerosol optical depth estimates present in the CAMS auxiliary file (embedded in L1C and L2A products) are used to derive the visibility of the atmosphere.
Water vapour retrieval over land is performed with the Atmospheric Pre-corrected Differential Absorption (APDA) algorithm [R4] which is applied to the two Sentinel-2 bands (B8a, and B9). Band 8a is the reference channel in an atmospheric window region. Band 9 is the measurement channel in the absorption region. The absorption depth is evaluated in the way that the radiance is calculated for an atmosphere with no water vapour assuming that the surface reflectance for the measurement channel is the same as for the reference channel. The absorption depth is then a measure of the water vapour column content.
Atmospheric correction is performed using a set of look-up tables generated via http://www.libradtran.org/. Baseline processing is the rural/continental aerosol type. Other look-up tables can also be used according to the scene geographic location and climatology.
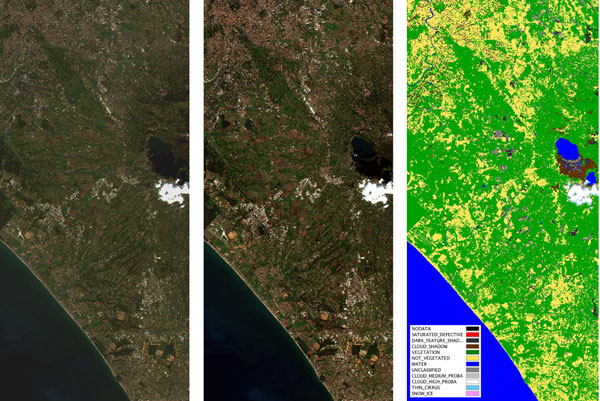
Figure 16: The figure shows from left to right: (1) Sentinel-2 Level-1C TOA reflectance input image, (2) the atmospherically corrected Level-2A Surface Reflectance image, (3) the output Scene Classification map of the Level-1C product.
[R1]: M. Main-Knorn, B. Pflug, J. Louis, V. Debaecker, U. Müller-Wilm, F. Gascon, "Sen2Cor for Sentinel-2", Proc. SPIE 10427, Image and Signal Processing for Remote Sensing XXIII, 1042704 (2017)
[R2]: Sentinel-2 Level-2A ATBD
[R3]: Kaufman, Y., Sendra, C. Algorithm for automatic atmospheric corrections to visible and near-IR satellite imagery, International Journal of Remote Sensing, Volume 9, Issue 8, 1357-1381 (1988)
[R4]: Schläpfer, D. et al., "Atmospheric precorrected differential absorption technique to retrieve columnar water vapour", Remote Sens. Environ., Vol. 65, 353366 (1998)
Scene Classification (SC)
The SC algorithm enables:
generation of a classification map which includes four different classes for clouds (including cirrus) and six different classifications for shadows, cloud shadows, vegetation, soils/deserts, water and snow
provision of associated quality indicators corresponding to a map of cloud probability and a map of snow probability.
The SC algorithm steps are presented in Figure 17. The algorithm includes:
cloud/snow detection
cirrus detection
cloud shadow detection
classification mask generation.
The SC processing is applied to Level-1C products (TOA reflectance) resampled at a spatial resolution of 60 m.
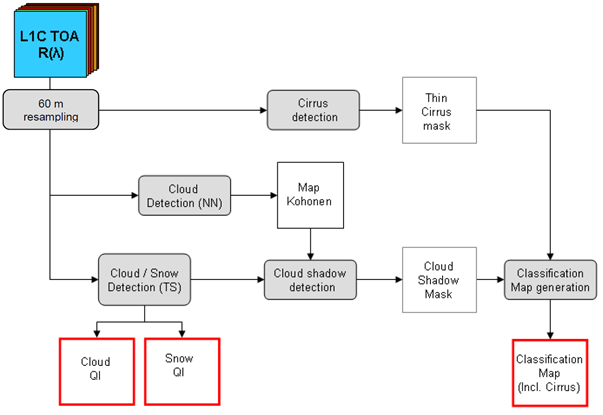
Figure 17: Level-2A Classification Processing Modules (grey) and Outputs (red)
(NN: Neural Network, TS: Threshold algorithm)
Cloud/Snow Detection
The steps of the cloud/snow detection algorithm sequence are presented in Figure 18.
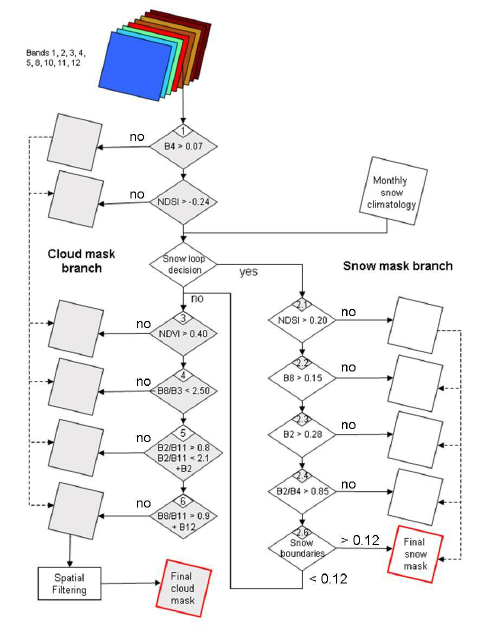
Figure 18: Level 2 Cloud/Snow Detection Algorithm Sequence
The cloud/snow detection algorithm is based on a series of threshold filtering steps:
Cirrus Cloud Detection Algorithm and cloud quality cross check
Cirrus cloud detection is based on band 10 (1.375 µm) reflectance threshold filtering tests. The cloud detection relies on strong water vapour absorption at 1.38 µm. If the pixel reflectance exceeds the clear-sky threshold (0.012) and is below the thick cloud threshold (0.035), then thin cirrus clouds are detected.
An additional test is performed with the probabilistic cloud mask obtained at the end of the cloud/snow detection step. This is because pixels classified as cirrus could have a cloud probability unequal to 0. The cloud probability of thin cirrus cloud pixels is checked:
If the cloud probability is above 0.65 then the thin cirrus cloud classification is rejected and the pixel classification is set to cloud high probability.
If the cloud probability is above 0.35 then the thin cirrus cloud classification is rejected and the pixel classification is set to cloud medium probability.
If the cloud probability is below or equal 0.35 then the thin cirrus cloud classification is accepted.
Cloud Shadow Detection Algorithm
The cloud shadow mask is built by multiplying the 'geometrically probable' cloud shadows derived from the final cloud mask, sun position and cloud height distribution, and the 'radiometrically probable' cloud shadow derived from the neural network "dark areas" classification (based on a Kohonen map algorithm).
The pixels that have a cloud shadow probability that exceeds a threshold are classified as cloud shadow pixels in the classification map.
Classification Mask Generation
The classification mask is generated along with the process of generating the cloud mask quality indicator and by merging the information obtained from cirrus cloud detection and cloud shadow detection.
The classification map is produced for each Sentinel-2 Level-2A product at 20 and 60 m resolution and byte values of the classification map are organised as shown in Table 6:
Table 6: Scene Classification Values
Label | Classification |
0 | NO_DATA |
1 | SATURATED_OR_DEFECTIVE |
2 | CAST_SHADOWS |
3 | CLOUD_SHADOWS |
4 | VEGETATION |
5 | NOT_VEGETATED |
6 | WATER |
7 | UNCLASSIFIED |
8 | CLOUD_MEDIUM_PROBABILITY |
9 | CLOUD_HIGH_PROBABILITY |
10 | THIN_CIRRUS |
11 | SNOW or ICE |
Atmospheric Correction (AC)
This algorithm allows calculation of atmospherically corrected Surface Reflectance (SR) from Top Of Atmosphere (TOA) reflectance images available in Level-1C products.
Defective, non-existent and saturated pixels are excluded from this Level-2A processing step.
Sentinel-2 Atmospheric Correction (S2AC) is based on an algorithm proposed in Atmospheric/Topographic Correction for Satellite Imagery[1]. The method performs atmospheric correction based on the LIBRADTRAN radiative transfer model [2].
The model is run once to generate a large LUT of sensor-specific functions (required for the AC: path radiance, direct and diffuse transmittances, direct and diffuse solar fluxes, and spherical albedo) that accounts for a wide variety of atmospheric conditions, solar geometries and ground elevations. This database is generated with a high spectral resolution (0.6 nm) and then resampled with Sentinel-2 spectral responses. This LUT is used as a simplified model (running faster than the full model) to invert the radiative transfer equation and to calculate the Surface Reflectance.
All gaseous and aerosol properties of the atmosphere are either derived by the algorithm itself or fixed to an a priori value.
The Aerosol Optical Thickness (AOT) can be derived from the images themselves above reference areas of known reflectance behaviour, preferably Dark Dense Vegetation (DDV) targets and water bodies. If no sufficiently dark reference areas can be found in the scene, an incremental threshold in the 2.2 µm band is applied (from 0.05 to 0.1 and 0.12) to identify reference areas with medium brightness. The visibility, and consequently the corresponding AOT, is automatically derived from a correlation of SWIR reflectance (band 12 = 2.19 µm) with the blue (band 2) and red (band 4) reflectance. The principle of the AOT retrieval method is based on Kaufman et al. (1997) with some slight differences (reduction of negative reflectance values, fixed rural/continental aerosol type, etc.).
Water vapour retrieval over land is performed using the Atmospheric Pre-corrected Differential Absorption (ADPA) algorithm which is applied to band 8a and band 9. Band 8a is the reference band in an atmospheric window region and band 9 is the measurement channel in the absorption region. Haze removal over land is an optional process.
Cirrus detection and removal is the baseline process. Haze removal can be selected instead of cirrus removal. The cirrus detection and removal is based on the exploitation of the band 10 (1.38 µm) measurements and potential correlation of the cirrus signal at this wavelength and other wavelengths in the VNIR and SWIR region.
S2AC employs Lambert's reflectance law. Topographic effects can be corrected during the surface retrieval process using an accurate Digital Elevation Model (DEM). S2AC accounts for and assumes a constant viewing angle per tile (sub-scene). The solar zenith and azimuth angles can either be treated as constant per tile or can be specified for the tile corners with a subsequent bilinear interpolation across the scene.
References
[1] R. Richter and Schläpfer, D.:Atmospheric/Topographic Correction for Satellite Imagery: ATCOR-2/3 UserGuide", DLR IB 565-01/11, Wessling, Germany, 2011.
[2] Mayer, B. and Kylling, A.: Technical note: The libRadtran software package for radiative transfer calculations - description and examples of use, Atmos. Chem. Phys., 5, 1855-1877, https://doi.org/10.5194/acp-5-1855-2005, 2005.
[3] GMES-GSEG-EOPG-TN-09-0029, SENTINEL-2 Payload Data Ground Segment (CGS), Products Definition Document (ESA), Issue 2.3 (March 2012)
[4] GMES-GSEG-EOPG-PL-10-0054, GMES SENTINEL-2 Calibration and Validation Plan for the Operational Phase (ESA document), Issue: 1.6 (December 2014)
[5] SENTINEL-2, ESA's Optical High-Resolution Mission for GMES Operational Services (ESA), SP-1322/2 (March 2012)
[6] M. Drusch, U. Del Bello, S. Carlier, O. Colin, V. Fernandez, F. Gascon, B. Hoersch, C. Isola, P. Laberinti, P. Martimort, A. Meygret, F. Spoto, O. Sy, F. Marchese, P. Bargellini, Sentinel-2: ESA's Optical High-Resolution Mission for GMES Operational Services, Remote Sensing of Environment, Volume 120, 2012 ,Pages 25-36,ISSN 0034-4257, https://doi.org/10.1016/j.rse.2011.11.026
[7] http://www.ecmwf.int/en/forecasts
POD Sentinel-2 Products Specification
Satellite Parameters for POD
The Sentinel-2 mission is supported by two identical spacecraft, Sentinel-2B and Sentinel-2C (previously Sentinel-2A), flying in the same orbital plane with a phase shift of 180º. An overall description of the satellite is available, showing the geometry of the satellite. Additionally, they are equipped with two dual frequency RUAG GPS receivers to allow Precise Orbit Determination (POD) in order to meet the accuracy requirements of the mission.
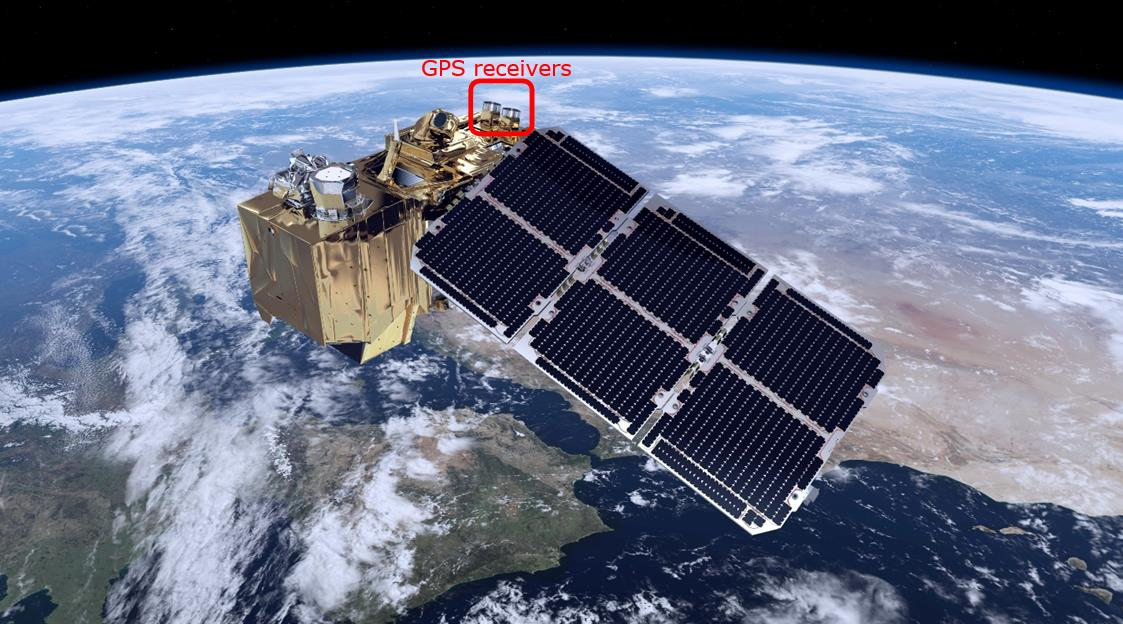
Figure 19: Drawing of Sentinel-2A satellite showing the GPS receivers [Credits: ESA]
For Precise Orbit Determination processing it is of paramount importance to know in great detail the mass history of the satellite, the evolution of its centre of gravity, the manoeuvre history and the attitude information. Moreover, for GNSS based processing, the location and orientation of the antennae are required. In the case of the manoeuvre and mass history file (including the Centre of Gravity position), available hereafter, a historical record is kept since the launch of the satellite:
Sentinel-2A Mass History file, Sentinel-2B Mass History file and Sentinel-2C Mass History file
Sentinel-2A Manoeuvre History file, Sentinel-2B Manoeuvre History file and Sentinel-2C Manoeuvre History file
For the convenience of users, another file combining information on manoeuvres and GNSS outages for the mission is provided below:
Please note that all of the files provided above contain a header that explains the format of their content.
The GPS Antenna absolute Phase Centre Offset and Variations (PCO/PCV) of both GPS receivers is located in this ANTEX file (Antenna Exhange Fromat).
Metrics
Different products are generated by the Copernicus Precise Orbit Determination Service (CPOD): POD orbit files, auxiliary files, GNSS and quaternions files, and external auxiliary data files.
The official POD products in Near Real Time (NRT) are computed using 24 hours of data. The predicted orbit files are a propagation extracted from the NRT product and therefore have the same passing metrics. This information and other modelling parameters are included in the Product Handbook. They are computed using P1/P2 code and L1/L2 phase ionosphere-free combinations. The number of used and rejected observations for each timeliness are shown here after:
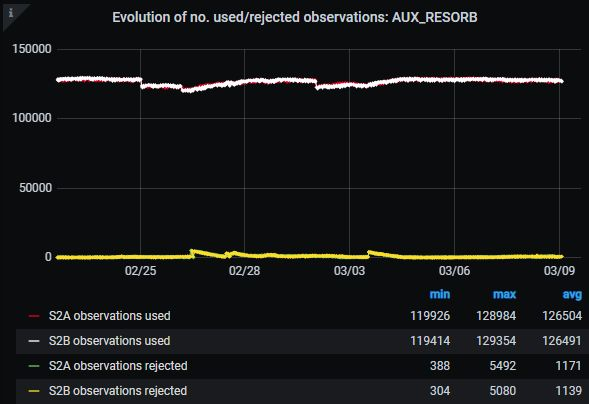
Figure 20: Number of used and rejected observations in Sentinel-2 NRT processing
The RMS of residuals obtained from the processing of pseudorange and carrier phase after applying an ANTEX correction [https://files.igs.org/pub/station/general/antex14.txt] to the GPS antenna are shown below for all generated products.
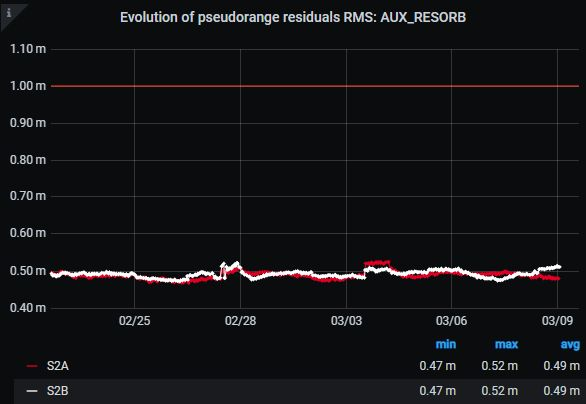
Figure 21: RMS of GNSS pseudorange residuals in Sentinel-2 NRT processing
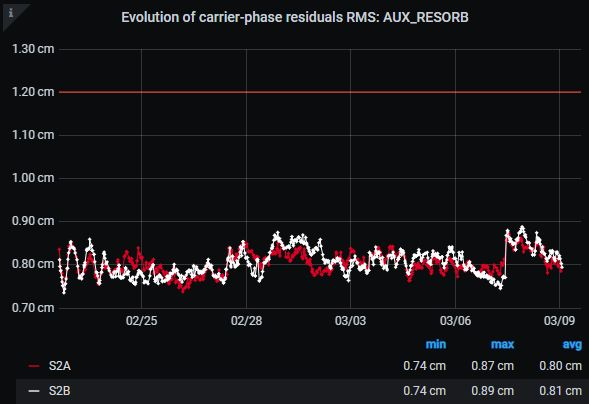
Figure 22: RMS of GNSS carrier phase residuals in Sentinel-2 NRT processing
Orbit Comparisons
The operational Sentinel-2 AUX_RESORB solutions from the CPOD Service are compared here against the combined solution (COMB), which is computed as a weighted mean of several external solutions provided by the CPOD QWG.
The AUX_RESORB file contains the Restituted Orbit State Vectors (OSVs) based in the orbit determination performed by the CPOD Service. This file is then used for generating Sentinel-2 Mission Products.
In the following figures, the position accuracy of each orbit solution is shown (in 2D or 3D RMS depending on the requirement). Each figure is presented along with the distribution of the obtained accuracy metrics, where the percentiles of these metrics are calculated for different thresholds.
The period of time for AUX_RESORB products correspond to the latest RSR report . Orbit comparisons considered as outliers (i.e., those mostly generated from periods of time with manoeuvres or data gaps) have been filtered-out from the statistics shown below.
AUX_RESORB
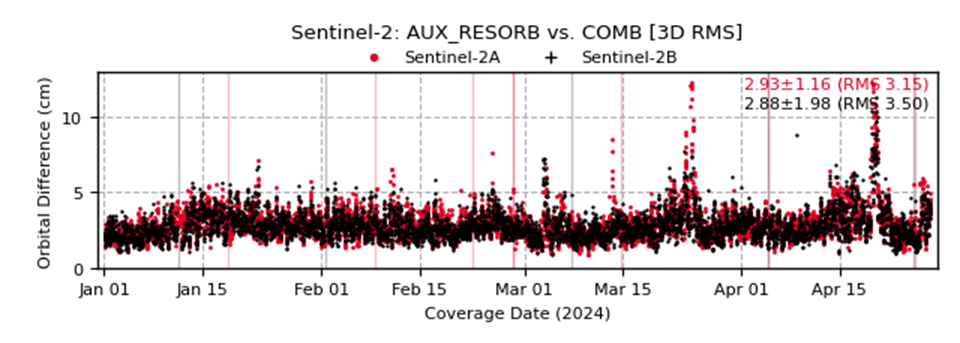
Figure 23: Sentinel-2 AUX_RESORB products – Orbit comparisons against COMB solution [3D RMS; cm] (the accuracy requirement expressed as 1-sigma, if appears, is shown with a blue line; vertical lines indicate periods of manoeuvres or data gaps
Table 7: Sentinel-2 AUX_RESORB products – Accuracy percentiles (they are calculated from the orbit comparisons against COMB solution [3D RMS])
Product Accuracy | ||
Threshold | Percentage Fulfilment | |
SENTINEL-2A | SENTINEL-2B | |
3 cm | 61.11% | 65.54% |
5 cm | 96.65% | 97.06% |
10 cm | 99.64% | 99.71% |
50 cm | 100.00% | 99.95% |
100 cm | 100.00% | 100.00% |
Global Reference Image (GRI)
Access to the Copernicus Sentinel-2 Global Reference Image (GRI)
The Copernicus Sentinel-2 Global Reference Image (GRI) was initially generated as a layer of reference composed of Sentinel-2 Level-1B (L1B) images (in sensor frame) covering the whole globe (except high latitudes areas and some small isolated islands) with highly accurate geolocation information. The images, acquired by the Sentinel-2 mission between 2015 and 2018, use the Sentinel-2 reference band (B04) and are mostly (but not entirely) cloud-free. The GRI covers most emerged land masses and has a global absolute geolocation accuracy better than 6 m.
The geometric refinement of the Copernicus Sentinel-2 imagery relies on the GRI and is part of the Sentinel-2 geometric calibration process, applied worldwide since August 2021. It has highly improved the absolute geolocation and the multi-temporal co-registration of Sentinel-2 products. Indeed, thanks to the geometric refinement using the GRI, all the products inherit the same absolute geolocation performance.
Usage of the Copernicus Sentinel-2 GRI can be extended to other missions than Sentinel-2. Several institutional and commercial missions aim to be interoperable with Sentinel-2 and therefore use the Sentinel-2 GRI as a worldwide geometric reference for calibration and validation purposes. In this framework and driven by user’s needs, it has been decided to freely give access to the scientific community to the entire GRI. Moreover, in order to facilitate the usage of the GRI, additional versions derived from the original Multi-Layer Copernicus Sentinel-2 GRI in Level-1B have been generated.
Therefore, the following four versions of the GRI are made available at the links provided in Table 8, and described in more details in the sections below:
Multi-Layer Copernicus Sentinel-2 GRI in Level-1B (L1B);
Multi-Layer Copernicus Sentinel-2 GRI in Level-1C (L1C);
Copernicus Sentinel-2 GRI as Database of GCPs in Level-1B (L1B);
Copernicus Sentinel-2 GRI as Database of GCPs in Level-1C (L1C).
Table 8: Four Copernicus Sentinel-2 GRI versions, along with download access and their corresponding documentation.
The versions of the GRI have been generated by using Sentinel-2A and Sentinel-2B data acquired between 2015 and 2018.
Copernicus Sentinel-2 GRI as Databases of GCPs in Level-1B and Level-1C
The Copernicus Sentinel-2 GRI as Databases of Ground Control Points (GCPs) in L1B and L1C are sets of L1B and L1C chip images, respectively, extracted from the Multi-Layer GRI in L1B. Chips images were produced by resampling the original L1B GRI products and centres on the image measurement; L1C chips were produced by rectifying L1B chips at constant Z, and cantered on UTM point coordinates. The GCPs are selected according to their radiometric contrast properties and perennity, making them suitable as a geometric reference. Moreover, since the Multi-Layer GRI in L1B has sometimes overlaps due to different relative orbits acquisitions or to avoid clouds presence, each GCP is consequently composed by multiple measurements. This allows having the same detail of the landscape acquired with different angles of views or on different seasons.

Figure 24: Illustration of GCPs in L1C
Both the L1B and L1C chips are provided in GEOTIFF format, mono-spectral (B4, red channel), 16 bits, 57 x 57p at 10m of resolution. The associated coordinates (sensor or ground) correspond to the center of the chip. L1C chip images are locally rectified using the 30 m Copernicus DEM in UTM projection, using a constant altitude computed at the center of the chip.
They are grouped by square degree (Lat/Long) associated with a metadata file providing quality indicators for each GCP. The coverage of the GRI as Database of GCPs corresponds to the one of the Multi-Layer GRI. It provides a worldwide coverage (except high latitude areas), including most of the islands. Figure 25 shows the density map in terms of number of GCPs within a 1°x1° square of the Copernicus Sentinel-2 GRI as Database of GCPs.
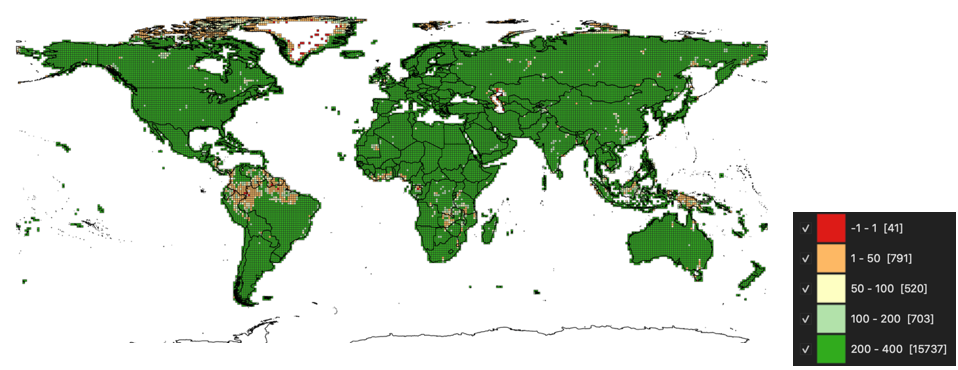
Figure 25: Density map in terms of number of points within a 1°x1° square of the Copernicus Sentinel-2 GRI as Database of GCPs.
Multi-Layer Copernicus Sentinel-2 GRI in L1C
The Multi-Layer Copernicus Sentinel-2 GRI in L1C was generated by converting the Multi-Layer GRI L1B into L1C and using the most recent Processing Baseline available at that time (PB 05.00), with the Copernicus DEM at 30 m resolution for orthorectification.
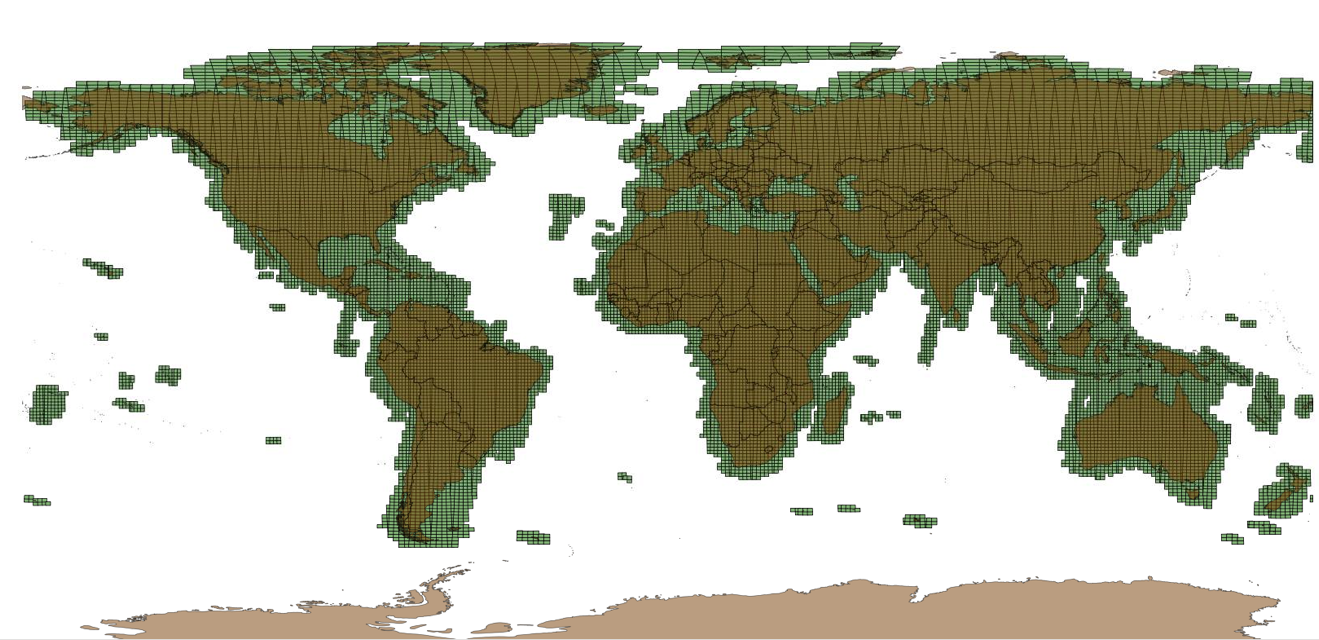
Figure 26: Extent of the Multi-Layer L1C GRI
Multi-Layer Copernicus Sentinel-2 GRI in L1B
The Multi-Layer Copernicus Sentinel-2 GRI in L1B is the first GRI version generated and is the one currently used by the ESA Ground Segment to systematically perform the geometric refinement into the Sentinel-2 processing chain, in order to improve the geometric performance of Sentinel-2 products.
Copernicus Sentinel-2 data systematically distributed by the ESA Ground Segment are geometrically refined over the Euro-Africa region since the 30th of March, 2021, and worldwide since the 23rd of August, 2021. Since then, both the Sentinel-2 data absolute geolocation and relative (multi-temporal) performance have significantly improved.
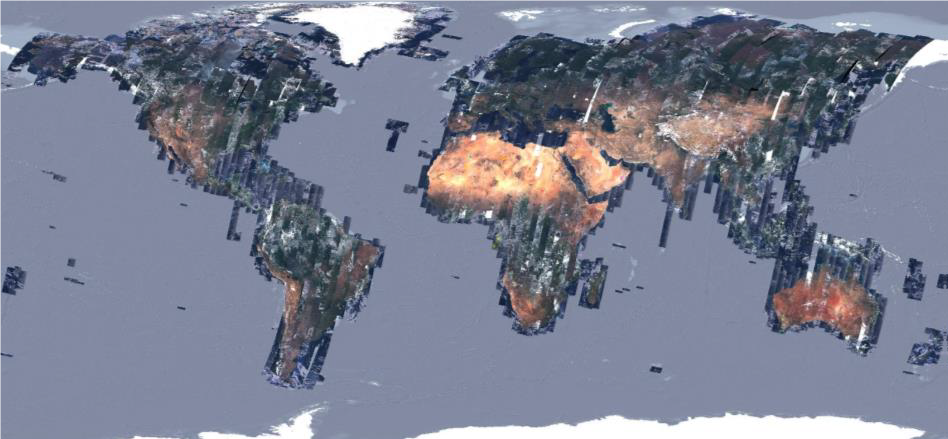
Figure 27: Extent of the Multi-Layer L1B GRI
Copernicus Sentinel-2 GRI Distribution Portal : How To Use
Copernicus Sentinel-2 GRI as Databases of GCPs in L1B and L1C
The GRI as Database of GCPs in L1B and L1C STAC versions (GCP_L1B and GCP_L1C) are part of the Copernicus Sentinel-2 Global Reference Image portal. It contains the items stored in tar.gz archives and split by latitude and then square degrees.
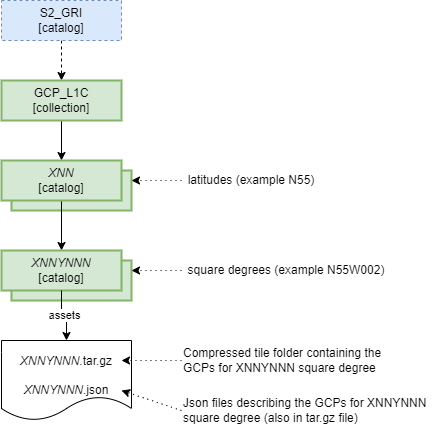
Figure 28: Example of L1C GCPs GRI Catalog Structure. Similar Catalog Structure is applied as well to the L1B GCPs
The assets for both GRI as Databases of GCPs in L1B and L1C point to:
the XNNYNNN.tar.gz archive file, i.e. the actual GRI unitary data (square degree),
the XNNYNNN.json file allowing the user to see all information regarding the GCP of square degree without having to download the complete archive file.
only for the GRI as Database of GCPs in L1B: a list of .tar.gz files containing the auxiliary data and metadata of the Database from which the GCPs have been extracted.
These data have not been included in the XNNYNNN.tar.gz files because they are heavy, and all the users may not be interested in downloading them (or all of them). As is, the users can choose if they want or not to download these files, knowing that the correspondence between each GCP and the L1B datastrip metadata file is available in XNNYNNN.json. Users can therefore identify the files to download.
The metadata for each item contain:
The footprint of the square degree tile,
The number of GCPs for the square degree.
For both the GRI as Database of GCPs in L1B and L1C, the main webpage displays the latitudes for which the GCPs are available. The examples below focus on GRI as Database of GCPs in L1C but are also valid for the GRI as Database of GCPs in L1B (Fig.29a). Clicking on one latitude opens the page allowing narrowing the selection to the square degrees for this latitude (Fig.29b).
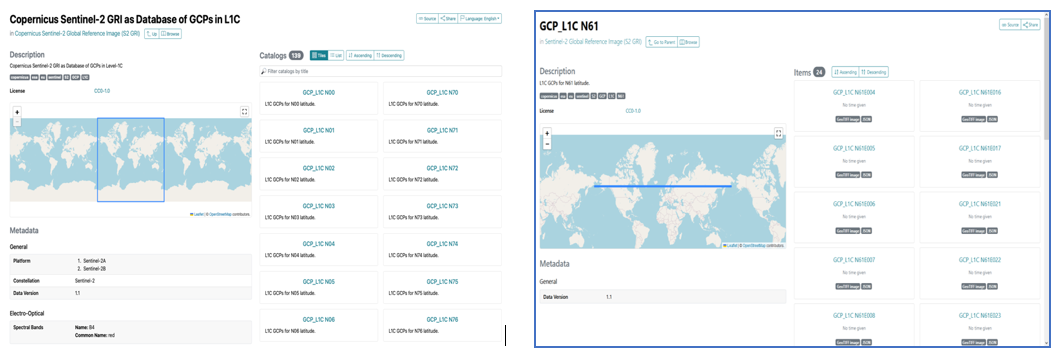
Figure 29: a) L1C GCP GRI Collection first page; b) L1C GCP GRI for Latitude N61 page
The user can then download the square degree as a tar.gz file, and the corresponding .json file providing all the information regarding the L1C GCP available in this square degree (Fig. 30).
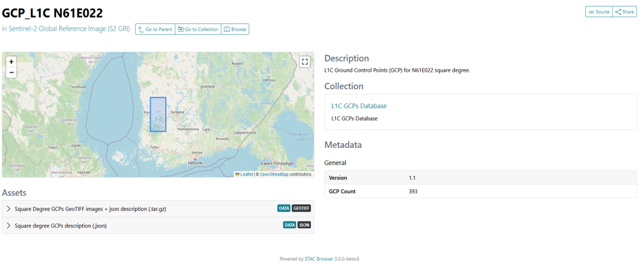
Figure 30: L1C GCP GRI for N61E022 square degree download page
Multi-Layer Copernicus Sentinel-2 GRI in L1C
The Multi-Layer L1C GRI STAC collection (GRI_L1C) is part of the Copernicus Sentinel-2 Global Reference Image portal. It contains the items stored in tar.gz archives and split by UTM zones and UTM tiles.

Figure 31: Multi-Layer L1C GRI Catalog Structure
The metadata for each item contain:
The footprint of the UTM tile,
The list of relative orbits to which the L1C tiles belong.
The main webpage of the Multi-Layer Copernicus Sentinel-2 GRI in L1C version displays all the UTM zones of the GRI. Clicking on one UTM zone opens a page allowing to select the grid zones (Fig 32a). Grid zones are UTM zones (e.g. T32) restricted to a given latitude band. Clicking on one grid zone opens a page allowing to select the tiles for download (Fig. 32b).

Figure 32: a) Multi-Layer L1C GRI T32 Grid Zone page ; b) Multi-Layer L1C GRI T32T page
Clicking on one tile opens instead a page allowing to download the L1C tiles corresponding to the displayed UTM tile. The user can then download the L1C overlapped tiles as a tar.gz file (Fig.33).
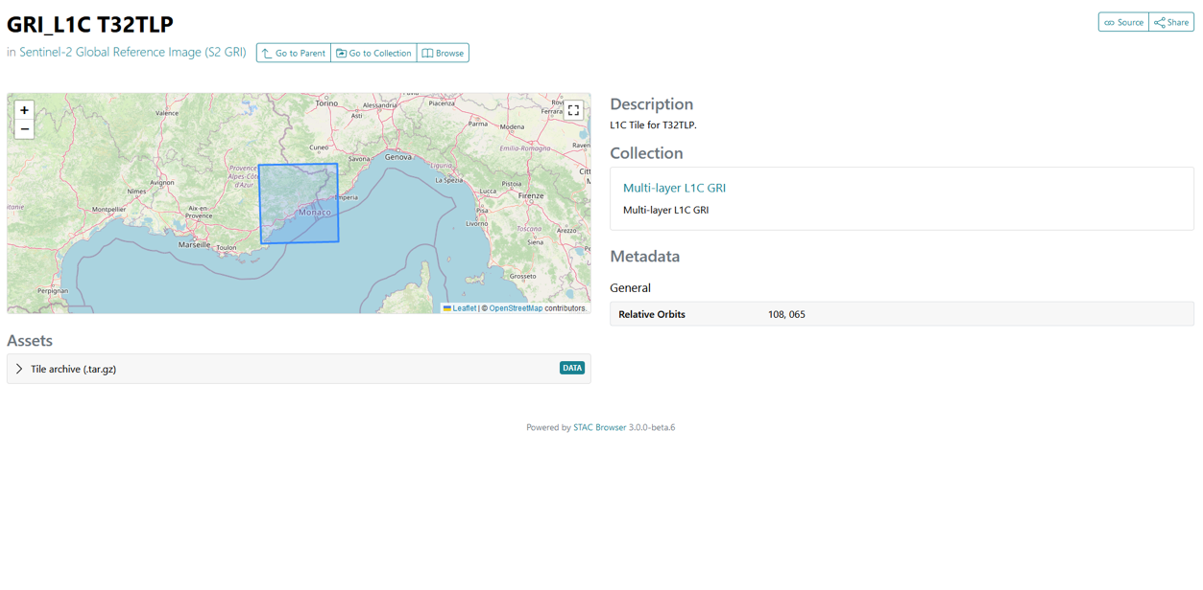
Figure 33: Multi-Layer L1C GRI T32TLP Tile download page
Multi-Layer Copernicus Sentinel-2 GRI in L1B
The Multi-Layer Copernicus Sentinel-2 GRI in L1B STAC version (GRI_L1B) is part of the Copernicus Sentinel-2 Global Reference Image portal. It contains the items stored in .TGZ archives and split by relative orbit number (from 1 to 143).
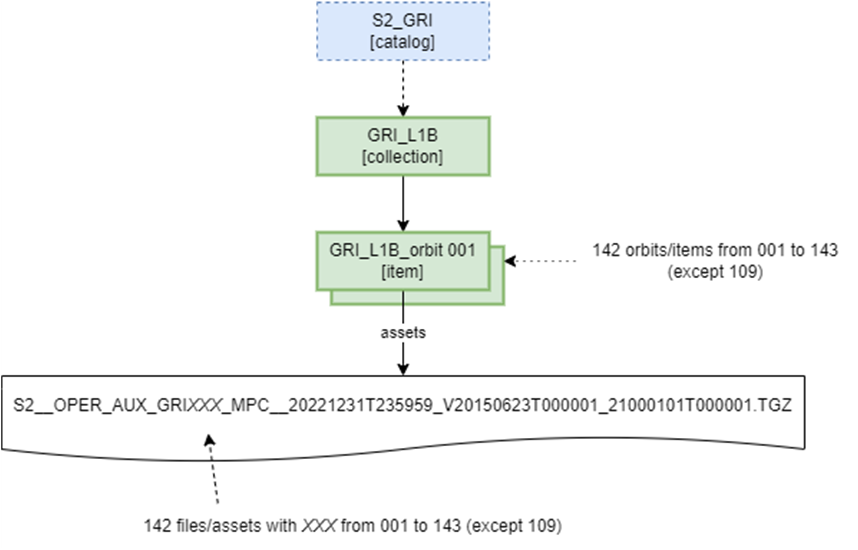
Figure 34: Multi-Layer L1B GRI Catalog Structure
The metadata for each item contains:
The footprints of the SAFE files contained in the GRI orbit,
The GRI orbit number.
The Multi-Layer Copernicus Sentinel-2 GRI in L1B version main webpage displays all the orbits of the GRI (Fig.35a). Clicking on one orbit opens the page allowing the download of the GRI orbit product. The user can then download the orbit as a TGZ file (Fig 35b).

Figure 35: a) Multi-Layer L1B GRI Collection first page; b) Multi-Layer L1B GRI orbit 11 download page
Potential limitations of the Current GRI
Operational use and user feedback of the GRI over the years, revealed some limitations of the GRI:
Coverage: the presence of clouds affects the availability of the products and their use for calibration and validation purposes.
Some granules are missing in the L1B GRI with visible gaps, as well as there are still areas with low-density GCPs.
The number of GCPs is sometimes not enough to cover the needs of the missions with a small footprint.
Based on these limitations, another version of the GRI will be made available in the future in order to provide a better reference


