Location via proxy:   [ UP ]  
[Report a bug]   [Manage cookies]                
Skip to main page content
Access keys NCBI Homepage MyNCBI Homepage Main Content Main Navigation
. 2017 Oct 24;114(43):E9115-E9124.
doi: 10.1073/pnas.1706906114. Epub 2017 Oct 9.

Visual perception as retrospective Bayesian decoding from high- to low-level features

Affiliations
Free PMC article

Visual perception as retrospective Bayesian decoding from high- to low-level features

Stephanie Ding et al. Proc Natl Acad Sci U S A. .
Free PMC article

Abstract

When a stimulus is presented, its encoding is known to progress from low- to high-level features. How these features are decoded to produce perception is less clear, and most models assume that decoding follows the same low- to high-level hierarchy of encoding. There are also theories arguing for global precedence, reversed hierarchy, or bidirectional processing, but they are descriptive without quantitative comparison with human perception. Moreover, observers often inspect different parts of a scene sequentially to form overall perception, suggesting that perceptual decoding requires working memory, yet few models consider how working-memory properties may affect decoding hierarchy. We probed decoding hierarchy by comparing absolute judgments of single orientations and relative/ordinal judgments between two sequentially presented orientations. We found that lower-level, absolute judgments failed to account for higher-level, relative/ordinal judgments. However, when ordinal judgment was used to retrospectively decode memory representations of absolute orientations, striking aspects of absolute judgments, including the correlation and forward/backward aftereffects between two reported orientations in a trial, were explained. We propose that the brain prioritizes decoding of higher-level features because they are more behaviorally relevant, and more invariant and categorical, and thus easier to specify and maintain in noisy working memory, and that more reliable higher-level decoding constrains less reliable lower-level decoding.

Keywords: Bayesian prior; adaptation theory; bidirectional tilt aftereffect; efficient coding; interreport correlation.

Conflict of interest statement

The authors declare no conflict of interest.

Figures

Fig. 1.
Fig. 1.
The 1-line and 2-line test conditions. (A) Trial sequence of the 1-line test conditions. The 50° and 53° lines were run in separate blocks. (B) Trial sequence of the 2-line test condition. The 50° and 53° lines were presented in each trial in counterbalanced, pseudorandomized order. For each condition, the marker dots appeared randomly at either horizontal or vertical initial positions, and subjects rotated them and clicked to report orientation(s). See Methods for details and the actual stimulus parameters.
Fig. 2.
Fig. 2.
A naive subject’s absolute-judgment distributions from the 1-line test conditions (Top row) and 2-line test condition (Bottom row). The distributions for the 50° and 53° stimuli are shown on the Left and Right, respectively. In each panel, the red and black arrows indicate the actual stimulus orientation and the mean of the distribution (i.e., the mean of the subject’s reported orientations), respectively. See SI Appendix, Fig. S1, for comparisons of variances and biases between all 12 subjects’ 1-line and 2-line absolute distributions. deg, degrees.
Fig. 3.
Fig. 3.
Observations from the 2-line condition and the corresponding predictions by the absolute-to-relative assumption. (A) A naive subject’s joint distribution with the reported orientation for the 53° stimulus plotted against that for the 50° stimulus in each trial of the 2-line condition (gray dots). Predictions from the subject’s 1-line absolute distributions are shown for comparison (light blue dots). The trials with correct and incorrect ordinal discrimination of the stimulus orientations are above and below the diagonal line, respectively. The red dot indicates the actual orientations. (B) The subject’s reported relative-judgment distribution (gray histogram) and that predicted from the 1-line absolute distributions (light blue histogram). They were obtained by projecting the dots in A along the negative diagonal. The red, black, and blue arrows indicate the actual orientation difference (3°), the mean of the reported orientation difference, and the mean predicted by the 1-line absolute distribution, respectively. SI Appendix, Fig. S2, shows the individual plots for the other 11 subjects. Note that 10,000 simulated samples were used to define the simulated relative distributions well but only 100 of them were randomly selected for the scatter plot of the simulated joint distribution to avoid clutter. (C) Relative-distribution SD predicted by the absolute-to-relative assumption vs. the observation for all 12 subjects. (D) Percentage of correct ordinal discrimination predicted with the 1-line (open dots) and 2-line (crosses) absolute distributions plotted against the observation for all 12 subjects. (Two of the 12 crosses happened to superimpose.) deg, degrees.
Fig. 4.
Fig. 4.
Second-report variability and orientation difference in the 2-line condition. (A) Second-report SD predicted by a sequential theory vs. the observation. The open dots and crosses are results for the 50° and 53° stimulus orientations, respectively. (B) The perceived orientation difference in the 2-line condition vs. that in the 1-line conditions for each subject. The red lines indicate the actual orientation difference of 3° between the 50° and 53° stimulus orientations. The orientation difference was exaggerated in the 2-line condition, but not in the 1-line conditions. deg, degrees.
Fig. 5.
Fig. 5.
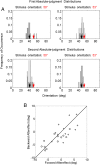
Forward/backward aftereffects between two lines in a trial. (A) The same naive subject’s first and second absolute-judgment distributions from the 2-line test condition. (They are obtained by splitting each of the distributions in the Bottom of Fig. 2; see Perceptual Decoding Cannot Be Explained by a Sequential Mechanism or by Conventional Adaptation.) The top and bottom rows represent the first and second absolute-judgment distributions, respectively; the left and right columns are for the 50° and 53° stimulus orientations, respectively. In each panel, the red and black arrows indicate the stimulus orientation and the mean of the distribution (i.e., the mean of the subject’s reported orientations), respectively. (B) The backward aftereffect plotted against the forward aftereffect for each of the 12 subjects. The open dots and crosses are results for the 50° and 53° stimulus orientations, respectively. Open dots in the third quadrant and crosses in the first quadrant indicate repulsive aftereffects. The figure show that large aftereffects were repulsive, but small ones were a mixture of repulsion and attraction. deg, degrees.
Fig. 6.
Fig. 6.
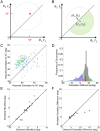
Perception as retrospective Bayesian decoding in working memory. (A and B) Schematic illustration of the theory. The x and y axes represent the first and second orientations, respectively. θ’s and r’s stand for stimulus orientations and their working-memory representations, respectively. The red dot indicates the actual orientations in a trial of the 2-line condition. The blue circle in A and the blue dot in B indicate the distribution of the two lines’ memory representations and a specific sample from it, respectively, at the report times in the 2-line condition. The area of the blue circle in A under the diagonal is the portion of incorrect ordinal discrimination based on the memory representations. For the blue-dot sample in B, the green circle indicates its likelihood function, and the Bayesian prior of ordinal relationship eliminates the shaded green portion, shifting the means of the posterior distribution to the green dot. (C) Simulated joint distribution for the subject of Fig. 3A, with the estimate for the 53° line against that for the 50° line in the 2-line condition (light green dots). The actual data are shown as gray dots (same as the gray dots in Fig. 3A). The light blue dots indicate simulated samples of memory representations (see Perception as Retrospective Bayesian Decoding in Working Memory from High to Low Levels). (D) Relative distributions obtained from the joint distributions in C by projecting them along the negative diagonal line. The gray, light blue, and light green histograms represent the relative distributions from the observation, the memory representation, and the retrospective Bayesian decoding, respectively. The black, blue, and green arrows indicate the mean of these relative distributions. The blue arrow is at the 3° and occluded by the red arrow, whereas the green arrow exaggerates the angular difference similar to the observation (black arrow). Note that 10,000 simulated samples were used to define each simulated relative distribution well, but only 100 of them were randomly selected for the corresponding scatter plot of the simulated joint distribution to avoid clutter. (E) The aftereffects predicted by the retrospective Bayesian decoding against the observations across subjects. The open dots and crosses are results for the 50° and 53° stimulus orientations, respectively. (F) The angular differences predicted by the retrospective Bayesian decoding against the observations across subjects. The simulations underestimated the angular difference for 2 of the total 12 subjects; this discrepancy can be eliminated by introducing a free parameter (see Perception as Retrospective Bayesian Decoding in Working Memory from High to Low Levels). deg, degrees.
Fig. 7.
Fig. 7.
Test of two predictions of the retrospective Bayesian decoding theory. (A) Reported orientation difference as a function of the mean SD of the absolute distributions in the 2-line condition for all 12 subjects. (B) Percentage of correct ordinal discrimination as a function of the mean SD of the absolute distributions in the 2-line condition for all 12 subjects. As predicted, the reported orientation difference increased with the SD, whereas the ordinal discrimination performance did not decrease with the SD. deg, degrees.

Similar articles

Cited by 9 articles

Publication types

LinkOut - more resources