ARTICLE IN PRESS
Pressure and Flow Comparisons Across
Vocal Pathologies
*Linda Carroll, †Ann Rooney, *,‡Thomas J. Ow, and *,‡Melin Tan, *†Bronx and ‡New York, New York
Summary: Objective. The aim of this study was to aid in the distinction among hyperadductive dysphonias by evaluating peak glottal pressure, release burst, and mid and final airflow values across repeated /pa/ syllable trains.
Methods. Sixty subjects were assessed for aerodynamic patterns during onset-offset for the /papapapapa/ task in modal
voice. Subject groups included adductory spasmodic dysphonia (AdSD), benign vocal fold lesion, primary muscle tension
dysphonia (MTD-1), secondary muscle tension dysphonia with an identifiable primary benign vocal fold lesion (MTD2), vocal fold paresis or paralysis, and normal controls.
Results. Increased peak pressure (PP) was found for AdSD and MTD-2 subjects compared with controls. Release
burst and mid airflow were not significantly different among groups. Final airflow was significantly higher for AdSD
compared with the other groups. Final airflow was significantly lower for MTD-1.
Conclusions. Significant differences in aerodynamics are seen in subjects with AdSD compared to MTD. AdSD was
characterized by higher PP and higher final airflow. MTD-1 was characterized by lower final airflow, whereas MTD-2
was characterized by higher PP. Aerodynamic evaluation may aid in differential diagnosis for those patients in whom
distinction among hyperadductive disorders is challenging.
Key Words: Spasmodic dysphonia–Muscle tension dysphonia–Laryngeal aerodynamics–Voice pressure and flow–Larynx.
BACKGROUND
In normal voice and motor control, aerodynamic measures are
characterized by a fairly steady and reliable onset-offset of the
glottal flow in the phonemic coordination from consonant to
vowel, as well as a fairly consistent strength of intraoral pressure during [p] production. During /pa/ syllable trains, there is
a buildup of intraoral pressure as the lips close for [p], leading
to a peak pressure (PP), and then a drop-off of pressure as the
lips open to begin the final portion of [p] production. As the lips
open, the airflow previously held behind the closed lips is suddenly released into the “release burst” (RB), which signals the
end portion of the [p] production. Glottal airflow then stabilizes during the [a] portion of the /pa/ syllable train. As the syllable
train is repeated, glottal airflow shuts down at the end of the [a]
as the lips close for the next [p] production. Dysphonic speech
may be marked by voicing discoordination because of mass effect,
neurologic disturbance, muscular tension, or mucus loading on
the vocal folds. Although voicing disturbances may be examined through acoustic signals, aerodynamic measures permit a
detailed examination of flow and pressure changes.
Prior studies have examined differences in aerodynamic measures among different pathologic etiologies of dysphonia.1,2
However, little research has evaluated the pressure-flow coordination at syllable transitions in dysphonic subjects. Although
peak intraoral pressures may be consistent in the dysphonic population, control of pressure-flow discoordination, particularly during
the coordination of one [pa] syllable to the next [pa] production
Accepted for publication April 6, 2017.
Presented at The Voice Foundation Annual Symposium Philadelphia, PA, June 2017.
From the *Department of Otorhinolaryngology—Head and Neck Surgery, Montefiore
Medical Center, Bronx, New York; †Department of Rehabilitation Medicine, Montefiore
Medical Center, Bronx, New York; and the ‡Department of Otorhinolaryngology—Head
and Neck Surgery, Albert Einstein College of Medicine, New York, New York.
Address correspondence and reprint requests to Melin Tan, Department of
Otorhinolaryngology—Head and Neck Surgery, Montefiore Medical Center, 3400 Bainbridge
Avenue, 3rd Floor, Bronx, NY 10536. E-mail: mtangel@montefiore.org
Journal of Voice, Vol. ■■, No. ■■, pp. ■■-■■
0892-1997
© 2017 The Voice Foundation. Published by Elsevier Inc. All rights reserved.
http://dx.doi.org/10.1016/j.jvoice.2017.04.004
in a repeated /pa/ syllable train, may yield important information on glottic function skills. This finding may be particularly
true for patients with adductory spasmodic dysphonia (AdSD)
who have reduced neuromuscular control at the glottis, when
compared to other non-neurologic causes of dysphonia. Higgins
et al reported on aerodynamic differences among AdSD, muscle
tension dysphonia (MTD), and normal subjects.3 Higgins et al
found no significant difference in the mean phonatory airflow
across the different groups, but did find a very large intersubject
variation in the mean phonatory airflow for patients with both
AdSD and MTD. The hypothesis of the present study is that a
closer examination of aerodynamic management of onset-offset
during the /pa/ syllable train may yield important information
in the diagnostic assessment of AdSD, and may provide important information in the differentiation of AdSD from other
dysphonias.
STATEMENT OF PURPOSE
The present study sought to determine whether aerodynamic characteristics could be used to differentiate AdSD from other
dysphonias. To determine differences across disorders, an institutional review board-approved study examined the
aerodynamics (glottal pressure peak, airflow, and RB) across /pa/
syllable trains for the following groups of subjects: spasmodic
dysphonia (SD), benign vocal fold lesions, primary muscle tension
dysphonia (MTD-1), secondary muscle tension dysphonia with
an identifiable primary benign vocal fold lesion (MTD-2), unilateral vocal fold paresis or paralysis (VFP), and normal
nondysphonic patients (control).
METHODS
Sixty adult subjects were enrolled on an ongoing basis at a
single institution’s voice clinic and categorized into one of
six equal groups based on a diagnosis by a single fellowshiptrained laryngologist. Subjects were enrolled until 10 subjects
were collected for each of the following groups: group 1 (AdSD,
�ARTICLE IN PRESS
2
Journal of Voice, Vol. ■■, No. ■■, 2017
TABLE 1.
Patient Demographics
Group
No. of Subjects
Sex (n)
Mean Age (y) (Range)
1
10
Female (10)
73.1 (64–89)
2
10
Female (9)
Male (1)
40.2 (21–59)
3
10
60.8 (43–75)
4
10
5
10
6
10
Female (9)
Male (1)
Female (9)
Male (1)
Female (9)
Male (1)
Female (9)
Male (1)
42.4 (17–55)
Specific Diagnosis (n)
AdSD (9)
AdSD with tremor (1)
Nodules (4)
Polyp (4)
Cyst (2)
MTD-1 (10)
68.4 (51–89)
MTD-2 with nodules (6)
MTD-2 with Polyp (4)
Unilateral paralysis (10)
36.4 (31–55)
Normal (10)
Abbreviations: AdSD, adductory spasmodic dysphonia; MTD-1, primary muscle tension dysphonia; MTD-2, secondary muscle tension dysphonia with an
identifiable primary benign vocal fold lesion.
N = 10), group 2 (benign vocal fold lesion, N = 10), group 3
(MTD-1, N = 10), group 4 (MTD-2, N = 10), and group 5 (VFP,
N = 10). Subjects were compared to group 6 (control subjects),
who were considered to be normal and denied current dysphonia (N = 10). Subject demographics are available in Table 1.
Aerodynamic measures obtained were part of the normal voice
evaluation protocol during the voice clinic. Aerodynamic measures were analyzed for repeated /pa/ syllable trains among 50
dysphonic subjects and 10 control subjects. Control subjects denied
any current dysphonia and denied knowledge of laryngeal
pathology.
Aerodynamic signals were captured and analyzed using Pentax
Medical Phonatory Aerodynamic System, model 2 (Pentax Medical,
Montvale, NJ). A tight-fitting pneumotachograph mask was held
against the subject’s face, covering the oral and nasal cavities.
Apressure tube was positioned into the oral cavity, avoiding contact
with the tongue, and in accordance with manufacturer specifications. All subjects were assessed for aerodynamics during onsetoffset for the /papapapapa/ task in a modal voice. Subjects repeated
/pa/ syllable trains at ~2 /pa/ segments per second for a total of
five to seven syllables on a single breath flow using a steady,
comfortable pitch and comfortable volume, consistent with their
conversational speaking voice. A minimum of three /pa/ syllable train tokens were obtained for analysis. Recordings were made
before any treatment.
Although measures of pressure, airflow, intensity, and fundamental frequency were obtained, only data related to pressure
and airflow were presented in this study.
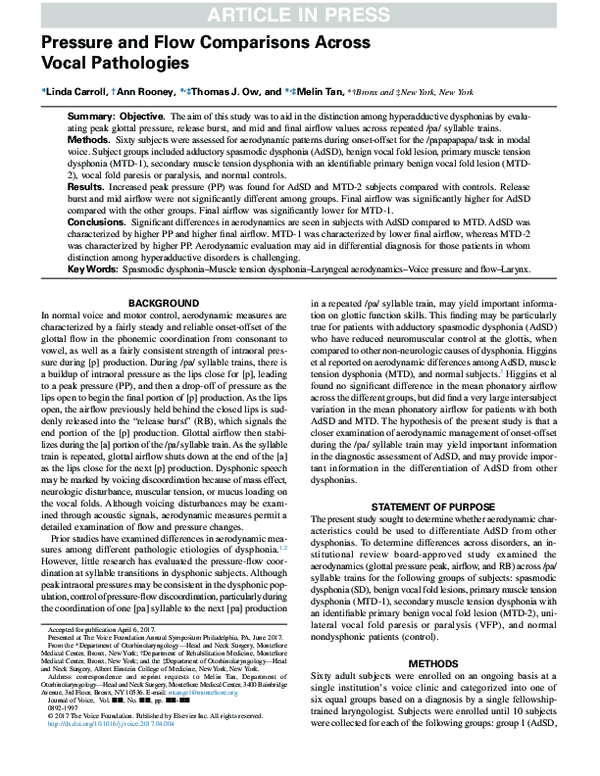
FIGURE 1. Graphic representation of the PP of the first syllable [p], the highest airflow during the RB for that [p] production, the airflow at the
MA, and the FA measured immediately before pressure increase for the subsequent [p] in a control subject. FA, final airflow for the [a] segment;
MA, middle of the [a] segment; PP, pressure peak; RB, release burst.
�ARTICLE IN PRESS
Linda Carroll, et al
3
Pressure and Flow Across Vocal Pathologies
Pressure peak and RB were determined across the /pa/ syllable task, between subjects and between groups. In addition,
values for airflow following the completion of the RB (for [p])
and airflow shutoff at the end of the vowel segment leading into
the next /pa/ syllable were examined.
Data were hand-measured for the PP of the first syllable [p]
production and the highest airflow during the RB for that [p]
production, as well as the airflow at the middle of the [a] segment
(MA) measured following the RB and at the midportion of the
[a] segment, and the final airflow for the [a] segment (FA) measured immediately before the pressure increase for the next [p].
Figure 1 shows the airflow measures with the graphical locations of the PP, RB, MA, and FA in a control subject. Data were
averaged for each subject across a minimum of three /pa/ syllable trains. The primary objective was to determine if aerodynamic
measures could differentiate between any of the five pathologic
groups and controls. Because each group contained 10 subjects
with four trials for each measure, repeated measures analysis of
variance (ANOVA) was carried out for each outcome variables
(PP, RB, MA, and FA) to determine if there was a significant
difference between the groups. Data were analyzed for normality and outliers. When the assumption of sphericity was violated,
the Box correction factor was applied and a P value of <0.05
was considered significant. To test the differences in outcomes
between specific groups, one-way ANOVA was carried out, and
Bonferroni correction was applied to adjust for multiple testing.
RESULTS
Whereas the analysis of RB and MA showed no significant difference among different groups of subjects, the analysis of PP
and FA revealed distinctions between SD, MTD-1, and MTD-2
subjects. The mean PP and FA values for each group are presented in Table 2, with ANOVA Bonferroni correct P value results.
Repeated measures ANOVA demonstrated that there was a significant difference between groups for measured PP. Similarly,
a difference was noted between groups for FA. Differences
between groups were not observed for RB or MA.
For PP and FA, post hoc analysis demonstrated significant differences between individual groups. PP was significantly different
between the control group and those with SD or MTD-2. PP
among AdSD subjects was significantly higher than MTD-1,
benign lesion, VFP, and controls.
The FA for the AdSD group was significantly higher than that
for any other group. The FA for the MTD-1 group was significantly lower than those for all the other groups (Figure 2). Subjects
with benign lesions had significantly higher FA than those with
MTD-1. Subjects with MTD-1 had significantly lower FA than
those with MTD-2, VFP, or controls.
DISCUSSION
Aerodynamic measures may be useful in the assessment of laryngeal function for patients with dysphonia and is known to
aid in the differentiation between vocal pathology and normal
voice. Prior investigation suggests a disorder-specific pattern of
glottal airflow patterns seen in the aerodynamic control across
voice disorders including benign mucosal lesions, unilateral vocal
fold paralysis, MTD-1, and vocal fold atrophy.1 Hyperadductive
voice disorders may be particularly amenable to a detailed evaluation of aerodynamics because of the impact on glottal airflow
by muscular forces (functional or organic). MTD involves the
hyperadduction of the vocal folds with characteristic changes
TABLE 2.
Mean ± Standard Deviation for Each Group and P Value From One-Way Analysis of Variance with Bonferroni Correction
for (A) Peak Pressure and (B) Final Airflow
(A)
Peak pressure (cmH2O)
Benign lesion
MTD-1
MTD-2
Vocal fold paralysis
Controls
10.099 ± 3.155
9.830 ± 4.009
11.835 ± 3.942
10.211 ± 3.477
7.623 ± 1.971
Spasmodic
Dysphonia
Benign
Lesion
MTD-1
MTD-2
Vocal Fold
Paralysis
13.069 ± 6.315
P = 0.017
P = 0.004
P = 1.000
P = 0.005
P = 0.000
10.099 ± 3.155
9.830 ± 4.009
11.835 ± 3.942
10.211 ± 3.477
P = 1.000
P = 1.000
P = 1.000
P = 1.000
P = 0.908
P = 1.000
P = 1.000
P = 0.977
P = 0.024
P = 1.000
Spasmodic
Dysphonia
Benign
Lesion
MTD-1
MTD-2
Vocal Fold
Paralysis
0.394 ± 0.223
P = 0.023
P = 0.000
P = 0.001
P = 0.000
P = 0.002
0.285 ± 0.102
0.150 ± 0.091
0.233 ± 0.136
0.215 ± 0.157
P = 0.001
P = 1.000
P = 1.000
P = 1.000
P = 0.030
P = 0.075
P = 0.020
P = 1.000
P = 1.000
P = 1.000
(B)
Final airflow (L/s)
Benign lesion
MTD-1
MTD-2
Vocal fold paralysis
Controls
0.285 ± 0.102
0.150 ± 0.091
0.233 ± 0.136
0.215 ± 0.157
0.232 ± 0.105
Note: Significant values are in bold.
Abbreviation: MTD-1, primary muscle tension dysphonia; MTD-2, secondary muscle tension dysphonia with an identifiable primary benign vocal fold lesion.
�ARTICLE IN PRESS
4
Journal of Voice, Vol. ■■, No. ■■, 2017
FIGURE 2. Individual aerodynamic sample for subjects with (A) AdSD, (B) MTD-1, and (C) MTD-2. Peak pressure is significantly elevated in
AdSD subjects. The final airflow is significantly higher for the AdSD subjects, whereas the final airflow is significantly lower for the MTD-1 subjects. AdSD, adductory spasmodic dysphonia; MTD-1, primary muscle tension dysphonia; MTD-2, secondary muscle tension dysphonia with an
identifiable primary benign vocal fold lesion.
in subglottal pressure, which, when coupled with maximum phonation time, may suggest the diagnosis of MTD.2 A detailed
examination of aerodynamic parameters might aid in the differentiation between hyperadductive disorders including AdSD,
MTD-1, and MTD-2.
With a close examination of the aerodynamics during /pa/ syllable train, there was a difference for PP and FA aerodynamics
compared to normal controls, and a significantly higher FA for
AdSD subjects as they tried to control the offset of voicing. There
were notable differences among groups with AdSD and with
MTD-1 and MTD-2. The examination of PP revealed that subjects with AdSD and MTD-2 demonstrated a significantly higher
PP than control subjects. Among AdSD patients, this reflects
greater glottic closure and pressure buildup, consistent with the
underlying disease. Those with MTD-2 may be using greater compensatory effort, consistent with typical laryngeal findings.
The final airflow for AdSD and MTD-1 subjects was significantly different from controls. Representative aerodynamic
tracings for four subjects with AdSD and four subjects with
MTD-1 are shown in Figures 3 and 4, respectively (cursors are
marked at PP and RB moments for each subject, and the output
was rescaled to permit optimum comparison across subjects).
Subjects with AdSD had an increased FA, whereas subjects with
MTD-1 had a decreased FA. Subjects with MTD-2 performed
similarly to controls for FA and were significantly different from
subjects who had MTD-1. Subjects with MTD-2 had similar FA
values compared to those with a benign lesion, and were similar
to controls. FA in subjects with benign lesion may be the primary
influence rather than compensatory muscle tension.
Based on these findings, the present study suggests that a detailed aerodynamic evaluation can aid in discerning the differential
diagnosis of AdSD vs. MTD. Close examination of PP and FA
may be a diagnostic measure to differentiate AdSD, MTD-1,
and MTD-2. Table 3 reveals a summary of the aerodynamic
TABLE 3.
Summary Table of Differentiating Aerodynamic Characteristics for AdSD, MTD-1, and MTD-2 When Compared
to Controls
Vocal
Pathology
AdSD
MTD-1
MTD-2
Peak Pressure
(cmH2O)
Final Airflow
(L/min)
Increased
Increased
Decreased
Increased
Abbreviations: AdSD, adductory spasmodic dysphonia; MTD, muscle
tension dysphonia; MTD-1, primary muscle tension dysphonia.
�ARTICLE IN PRESS
Linda Carroll, et al
Pressure and Flow Across Vocal Pathologies
AdSD Subject 6
AdSD Subject 7
Frequency
Frequency
Intensity
Intensity
Airflow
Airflow
Pressure
Pressure
AdSD Subject 8
AdSD Subject 10
Frequency
Frequency
Intensity
Intensity
Airflow
Airflow
Pressure
Pressure
FIGURE 3. Sample aerodynamic patterns for four subjects with AdSD. AdSD, adductory spasmodic dysphonia.
MTD-1 Subject 1
MTD-1 Subject 2
Frequency
Frequency
Intensity
Intensity
Airflow
Airflow
Pressure
Pressure
MTD-1 Subject 8
MTD-1 Subject 9
Frequency
Frequency
Intensity
Intensity
Airflow
Airflow
Pressure
Pressure
FIGURE 4. Sample aerodynamic patterns for four subjects with MTD-1. MTD-1, primary muscle tension dysphonia.
5
�ARTICLE IN PRESS
6
characteristics of AdSD, MTD-1, and MTD-2. AdSD is characterized by a higher PP and a higher final airflow. MTD-1 is
characterized by lower values of final airflow. MTD-2 is characterized by higher values of PP. Overall, RB values and MA
values were not valuable for differentiating vocal pathologies.
In the present study, AdSD subjects’ control of airflow during
the interphonemic environment contrasted with all other groups.
Rather than reducing airflow at the end of the [a] in preparation for a smooth transition to pressure buildup for [p], AdSD
subjects kick glottal airflow up. Additionally, as a group, they
may demonstrate difficulties with balance of flow and pressure
during voicing changes.
CONCLUSIONS
Aerodynamic coordination is a key component to ease of voice
and speech. The present study found a significant difference
between diagnostic groups for PP and final airflow during /pa/
Journal of Voice, Vol. ■■, No. ■■, 2017
syllable trains. In particular, there was a significant difference
between AdSD, MTD-1, and MTD-2 groups. AdSD was characterized by a higher PP and a higher final airflow. MTD-1 was
characterized by a lower final airflow, whereas MTD-2 was characterized by a higher PP.
Examination of aerodynamics may aid in the diagnosis for
patients in whom distinction among hyperadductive disorders
is challenging.
REFERENCES
1. Dastolfo C, Gartner-Schmidt J, Yu L, et al. Aerodynamic outcomes of four
common voice disorders: moving toward disorder-specific assessment. J Voice.
2016;30:301–307.
2. Zheng YQ, Zhang BR, Su WY, et al. Laryngeal aerodynamic analysis in
assisting with the diagnosis of muscle tension dysphonia. J Voice. 2012;
26:177–181.
3. Higgins MB, Chait DH, Schulte L. Phonatory air flow characteristics of
adductor spasmodic dysphonia and muscle tension dysphonia. J Speech Lang
Hear Res. 1999;42:101–111.
�
 Linda Carroll