TOTAL LIGHTNING IN A TLE-BEARING WINTER THUNDERSTORM
OVER THE WESTERN MEDITERRANEAN
1
2
3
3
Nicolau PINEDA , Joan MONTANYA , Oscar VAN DER VELDE and Serge SOULA
1
Meteorological Service of Catalonia, Barcelona, Spain
2
Technical University of Catalonia, Terrassa, Spain
3
Laboratoire d’aérologie, UMR UPS/CNRS 5560, Université de Toulouse, France
Contact: npineda@meteocat.com
1. INTRODUCTION
Until recently, transient luminous events
(TLEs) above winter thunderstorms had been
observed exclusively in the Sea of Japan. Now,
Ganot et al. (2007) and Greenberg et al. (2007)
have
reported
TLE
events
in
winter
thunderstorms on the eastern Mediterranean
near the coast of Israel. The Mediterranean Sea
is one of the few regions in the Northern
Hemisphere where winter thunderstorms are
rather frequent. Space-borne observations of
lightning (Christian et al., 2003) have shown that
Mediterranean Sea exhibits lightning activity in
most of the winter months.
The analysis is focused on total lightning
activity and its relation to the TLE events
observed above this winter thunderstorm.
2. DATA
2.1. Data from the SMC
The Meteorological Service of Catalonia
(SMC) operates a Vaisala Thunderstorm
Information System (TIS) since 2003. In 2007
the system was upgraded with a CP8000
processor. Moreover, a new LS8000 station was
installed in 2007. Currently, the SMC-TIS,
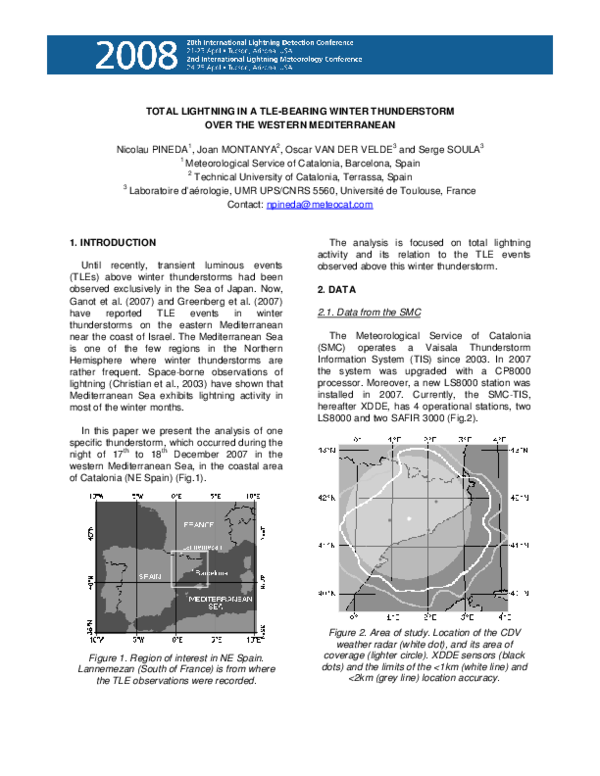
hereafter XDDE, has 4 operational stations, two
LS8000 and two SAFIR 3000 (Fig.2).
In this paper we present the analysis of one
specific thunderstorm, which occurred during the
th
th
night of 17 to 18 December 2007 in the
western Mediterranean Sea, in the coastal area
of Catalonia (NE Spain) (Fig.1).
Figure 1. Region of interest in NE Spain.
Lannemezan (South of France) is from where
the TLE observations were recorded.
Figure 2. Area of study. Location of the CDV
weather radar (white dot), and its area of
coverage (lighter circle). XDDE sensors (black
dots) and the limits of the <1km (white line) and
<2km (grey line) location accuracy.
�(Fig. 4 shows one example). From these events,
5 sprites and 2 elves were located in the area of
the study, delimited by the XDDE and the CDV
radar coverage area (Fig.2). The TLE events
analyzed are presented in Table 1.
The total lightning locations of CP8000
combine both LF and VHF data to develop
lightning location information from preliminary
breakdown to ground strokes. The addition of the
higher-frequency components of the lightning
discharge (VHF) makes it possible to reconstruct
the path (map) of the cloud discharge (VAISALA,
2004).
The SMC also operates a three C-band
weather radar network. These radars generate
volumes of data every 6 minutes, with one scan
at 0.6º at a long range (240 km) and a series of
14 scans with elevations sweeping of 0.6º at a
short range (150 km). More details of the radar
network are given in the study of Bech et al.
(2004). In this study, data from the “Creu del
Vent” radar (41.60ºN,1.40ºE, 825m ASL)
(hereafter CDV) have been used (Fig.2).
Finally, the SMC radiosonde records of the
Barcelona station (41.62ºN, 2.20ºE, 98 m ASL)
have been used to infer the isotherms heights
and to calculate instability indexes during the
analyzed period.
Besides SMC data, Cloud-to-ground lightning
data
was
taken
from
EUCLID
(http://www.euclid.org/), as the SMC CP8000 LF
processing was not fine tuned at that time, due
to its recent installation.
2.2. TLE observations
Several sensitive video cameras were
available during EuroSprite 2007 campaign
(http://www.eurosprite.net/). The images of
sprites and elves analyzed in this paper were
obtained from Lannemezan, in the south of
France (Fig.1). The camera is a Watec 902H,
with a sensitivity of 0.0003 lux at f/1.4 (Fig.3).
The pan-tilt unit and the camera were remotely
controlled by using a VNC software. The system
performed real-time automatic event detection
for reduction of the data volume. The video
images have a 20 ms frame time duration.
th
Figure 3. The Watec 902H camera with the
pan/tilt uni, located in Lannemezan.
Table 1. TLE observations from Lannemezan
nº
th
During the night of 17 to 18 2007, images of
17 sprites and 8 elves were obtained over the
western Mediterranean and the Catalan coast
2
TLE Observation
DATE
hh:mm:ss
ms
type
S7
S9
S10
S11
S12
18/12/2007
18/12/2007
18/12/2007
18/12/2007
18/12/2007
0:05:35
0:35:23
0:56:05
1:06:03
1:43:59
161-181
626-646
306-326
895-915
658-678
E3
18/12/2007
1:58:56
171-191
E7
18/12/2007
4:12:16
556-576
Sprite
Sprite
Sprite
Sprite
Sprite
Elve or
halo
Elve
�3.2. Instability Indexes
The CAPE (Convective Available Potential
Energy) calculated from the Barcelona
radiosonde (aprox. 100 km from the sprite
th
observations), on December 17 2007 12:00
-1
UTC had a value of 108 J Kg . Such value is
lower than the CAPE values of the winter
thunderstorms in the Eastern Mediterranean
analyzed by Ganot et al 2007, which were
-1
between 200 and 400 J Kg . Rigo (2004) has
analyzed the CAPE in the region of study in rainy
days (1996-2000), and has obtained a mean
-1
value for the winter months of 130 J Kg . Thus
the CAPE of the present episode does not seem
to be higher than the usual value in rainy
episodes in the winter season in the region.
While CAPE values are small in winter
thunderstorm situations, the warm sea water
relative to the cold air mass keeps replenishing
the boundary layer with heat and moisture (Van
der Velde, 2008). Moreover, it must be taken into
account that usually, CAPE values in the region
are lower than those found in the Great Plains of
the U.S. (Romero et al., 2007). This appears to
result in a smaller average size and shorter
duration of storm systems (Van der Velde,
2008).
Figure 4. Sprite image from the Lannemezan
camera. Sprite at 0:05:35 UTC.
3. ANALYSIS
3.1. Synoptic analysis
A weak low (1015 hPa) was originated in the
days before the studied episode, in the north of
the western Mediterranean, between Balearic
Islands and the gulf of Genova. The low moved
to west, and on December 18th 00:00 UTC it
was situated between Corsica and Cerdegna
(Fig.5). Such situation has lead to an advection
from the east to the Catalan coastal area,
generating wind gusts up to 40 km/h At 500 hPa,
th
during December 17 , an upper-level trough has
developed on the eastern Mediterranean, with
cold air with temperatures of –38ºC. The trough
moved to the western Mediterranean, and on
December 18th 00:00 UTC it was situated in the
vertical above Catalonia, with temperatures
around -33ºC.This combination of maritime
winds at low levels with the upper-level trough
has generated the analyzed thunderstorm.
Synoptical analysis 2007-12-18 00:00
Figure 5. Surface synoptic analysis from
th
December 18 at 00:00 UTC.
3
�Table 2. Cloud top temperature from Meteosat imagery and heights from the Barcelona
radiosonde (18/12/2007 00:00 UTC), and radar maximum reflectivity (Zmax) and
Echotop-12dBZ product heights in the vicinity of the TLE parent +CGs (P+CG)
TLE Meteosat Cloud Top Max
# time UTC
ºC
Alt(m)
S7
0:00
-49
7550
S9
0:30
-51
7990
1:00
-47
7290
S10
S11
1:00
-47
7290
S12
1:45
-47
7290
E3
2:00
-47
7290
E7
4:15
-44
6950
Cloud top P+CG
ºC
Alt(m)
-45
7100
-47
7290
-37
6140
-38
6260
-39
6370
-41
6630
-33
5660
RADAR
time UTC
0:06
0:36
0:54
1:06
1:42
2:00
4:18
TLE
dist.(km)
106
96
80
61
104
90
110
Zmax
dBZ
17.5
13.0
17.0
22.5
21.5
22.0
15.0
Echotop-12
(km)
4
3.4
3.3
3.6
4.6
4.2
3.3
3.3. Meteosat imagery
The total shield of cloud tops colder than 2
30ºC reached an area of almost 70,000 km ,
while the area colder than -50ºC reached its
2
maximum around 01:00 UTC with 216 km (table
3). According to Mohr and Zipser (1996) such
dimensions and temperatures are indicative of a
Mesoscale Convective System (MCS).
The results of the analysis done on the
Meteosat-9 (MSG-2) imagery (example in Fig.6),
is summarized in Table 2. We have found that
the coldest thundercloud tops at the moment of
the analyzed TLEs were around -50ºC, while the
cloud top temperature above the TLE parent
+CG location (hereafter P+CG) was warmer by
3-11 degrees. This result is similar to the ones
found in van der Velde et al. (2006).
Table 3. Cloud Area colder than
2
-30ºC and -50ºC in km
According to the Barcelona radiosonde on
th
December 18 at 00:00 UTC, the tropopause
was around -51ºC, which corresponds to an
altitude of 8010 meters. Maximum cloud tops
observed are close to the tropopause, while the
cloud top temperature above the P+CG location
were 500 to 2000 meters below.
Time (UTC)
0:00
0:30
T < -30ºC
63800 66000
T < -50ºC
0
90
1:00
68200
216
2:00 4:15
63000 6000
0
0
Takahashi et al. (2003), have observed
sprites above the highest cloud tops of the storm
system, thus near the most active vertical motion
is occurring. These observations differ from
summer thunderstorms observations, where the
majority of sprites are observed above large
stratiform regions and not near the convective
core (Lyons, 1996). In the TLEs analyzed here,
two different patterns were observed. Sprites S7
(0:06 UTC) and S9 (0:35 UTC) are located in the
SW cell, above the Ebro river delta, while the
rest of events are located in the NW cell, which
appeared later on, and was located over sea in
front of the Catalan coast (Fig.6). According to
the Meteosat images, the P+CG of sprites S7
and S9 occurred near the coldest cloud tops in
the SW cell, during the growing period of this
cell, which reached its maximum cloud cold area
around 01:00 UTC.
It can be seen in Table 2 that cloud tops
above TLE P+CGs have heights between 5.5
and 7.3 km approximately, and temperatures
between -33ºC and -47ºC. Takahashi et al.,
(2003), in their study of sprites in winter
thunderstorms over the Sea of Japan, have
found lower heights (between 4.2 and 6.6 km)
and warmer cloud top temperatures (ranging
from about –25º to –10ºC). On the other hand,
Ganot et al. (2007) reported more similar
thunderstorm
cloud
conditions
in
their
observations of sprites in winter thunderstorms in
the eastern Mediterranean, with cloud top
temperatures around –40ºC and higher cloud
tops (7 to 9 km).
4
�Figure 6. Thermal infrared image from Meteosat-9 of the Western Mediterranean area. The red square
indicates the region where the TLE events were observed.
In the NE cell, P+CG of sprites S10 (0:56 UTC),
S11 (1:06 UTC) and S12 (1:43 UTC) were
located above warmer cloud tops (see Table 2),
with heights lower in almost 1 km compared to
sprites S7 and S9. Elves E3 and E7 came after
the Sprites. Elve E3 (1:58 UTC) was seen just
after both cells have merged in one, and its
P+CG is located above the tail zone of the
merged cell. Finally, E7 occurred two hours later
(4:12 UTC) in a large but thin stratiform band, in
the decaying stage of the thunderstorm, when
lightning flashes were rare.
3.5. Weather radar analysis
3.4. Sea Surface Temperature
A larger precipitation structure mainly made
up of scattered stratiform radar echoes (>10
dBZ), was located north east from the first one.
This system, considering 10 dBZ contours,
exceeded 100 km in size, thus verifying the
spatial requirement for a Mesoscale Convective
System (MCS) according to Houze (1993). This
precipitation area (named NE cell in the satellite
analysis) was associated to sprites S10, S11 and
S12 (see Table 1). It was mainly stratiform with
embedded convection, with a few precipitation
cores exceeding 30 dBZ. At 1:00 UTC it was
approximately elliptical with semi-axes of 120 km
and 60 km.
The first sprites (S7 and S9 in Table 2) were
associated to a relatively small linear convective
structure approximately 35 km long considering
10 dBZ contours in the 3-D radar MAX product
(this structure was named SW cell in the satellite
analysis). Maximum intensities were about 20 to
35 dBZ. From 00:00 UTC to 1:00 this system
grew in size, enlarging the linear convective area
(with values above 30 dBZ) suggesting Quasi
Linear Convective System characteristics.
The Sea surface temperature of the
Mediterranean Sea in the area of study was
between 16 and 17ºC, as calculated with NOAA
AVHRR imagery (Chic and Font, 2004). Such
temperatures are similar those found by Ganot et
al (2007) in their sprite’s study in eastern
Mediterranean (SST 17ºC) and warmer than the
temperatures
in
TLE
bearing
winter
thunderstorms in the sea of Japan for the case
study of Suzuki et al 2006, (14ºC).
5
�radar reflectivity higher than 45 dBZ; 3) Intensity
of reflectivity exceeding 35 dBZ at the -10ºC
level, and 4) Radar-derived rain intensity higher
-1
than 26 mm h . In the analyzed case, all
conditions were accomplished.
According to the radar analysis, both SW and
NE cells have merged around 1:54 UTC, the
new cell having a size about 150 x 100 km, but
most cores had decreased in intensity. Elve E3
(1:58 UTC) occurred soon after this merging,
while elve E7 (4:12 UTC) was observed in the
splitting and dissipating stage of the
thunderstorm.
Moreover, Altaratz et al. (2001) defined some
thresholds to be exceeded before the beginning
of the lightning activity, which are: 1) A period
between the first radar echo and the first CG of
10-15 min; 2) The 40 dBZ echo top should be
above the -8ºC level; 3) The 30 dBZ echo top
should be above the -12ºC level and 4) The
radar reflectivity at the -10ºC level should be
larger than 32 dBZ at the time of the first CG. In
the analyzed episode, it was hard to determine
condition 1). Conditions 3) and 4) were reached
before the first CG stroke, while condition 2) was
reached only at the moment of the maximum CG
flash rate and not at the beginning of the activity.
Table 2 shows also the mean value of
Maximum reflectivity (Zmax) and the Echotops
2
(at 12 dBZ) in a 5 x 5 pixel box (aprox. 25 km )
around the TLE parent +CGs. Zmax values are
between 13 and 22.5 dBZ, while Echotops are
between 3.3 and 4.6 km. Analyzing the radar
images, we have seen that the majority of the
events are located near a core reflectivity area.
Figure 7 shows an example of the analyzed
cross sections.
3.6. Total lightning analysis
Analyzing the radar echo top of 20, 30 and 40
dBZ and the lightning activity (Fig 8), in our case
study we have observed the following:
th
The XDDE has recorded from December 17
20:00 UTC to December 18th 07:00 UTC 200
cloud-to-ground (CG) flashes, 322 CG strokes,
318 intracloud (IC) flashes and 110 IC isolated
VHF sources. The CG multiplicity is therefore 1.6
while the annual 2007 mean in the region is
generally 2.1. 69% of the CG flash first strokes
were of negative polarity, and therefore 31% of
positive polarity. The maximum flash rates
-1
reached 4 IC flashes min and 2.3 CG flashes
-1
min , around 01:00 UTC for both cells joined
together. Lyons (1996) has pointed out that the
sprite production is not correlated with the total
CG flash activity. In the present episode, we
have observed sprites during different CG flash
rates. In the case of the two observed elves,
both occurred when the CG flash rate was very
low.
1) Lightning activity was present when the 20
dBZ echo top was above the -20ºC level.
2) Lightning activity was present when the 30
dBZ echo top was above the -10ºC level.
3) The maximum IC and CG flash rates were not
related to the presence of reflectivity above 40
dBZ, and seemed more related to the evolution
of the 30 dBZ echo top heights.
Diendorfer et al. (ILDC 2006) has observed
the first flashes, at the Gainsberg tower (near
Salzburg, Austria) in a winter thunderstorm, few
minutes after the 20 dBZ reflectivity echo
exceeded the -20ºC level, and in our case study,
the same thresholds were reached before there
was lightning activity.
Altaratz et al. (2001) has characterized winter
thunderstorms in the eastern Mediterranean,
defining the following conditions for lightning
activity: 1) Top of clouds higher than 6.5 km at
temperatures colder than -30ºC; 2) Maximum
6
�Figure 7. Radar cross section at 01:42:20 UTC on the direction of the sprite S12 parent +CG (01:43:59
UTC), which is printed on the cross section with a vertical line as its height is unknown.
Iso -40ºC
Echotops Height (km), isotherm heights (km)
6
TOP 20
Iso -30ºC
5
4
TOP 30
Iso -20ºC
30
25
20
15
3
Iso -10ºC
10
TOP 40
2
Iso 0ºC
IC, CG (# in 6 minute periods)
IC
CG
TOP20
TOP30
TOP40
Iso 0ºC
Iso -10ºC
Iso -30ºC
Iso -40ºC
Iso -20ºC
7
5
1
0
2:00
1:30
1:00
0:30
0:00
23:30
23:00
22:30
22:00
21:30
21:00
20:30
0
Time UTC (hh:mm)
Figure 8. Radar echo top of 20 (TOP20), 30 (TOP30) and 40 (TOP40) dBZ and IC and CG flash evolution
from 17/12/2007 at 20:30 UTC to 18/12/2008 at 03:00 UTC, period that corresponds to the main lightning
activity during the thunderstorm lifetime. Isotherm heights are taken from the Barcelona radiosonde
18/12/2008 at 00:00 UTC.
7
�Table 4. TLE events and their related IC flashes registered by the XDDE.
TLE Observation
Video
IC/CG
time
frame
time
(ms)
nº
Type
(UTC)
S7
Sprite
0:05:35 161-181
S9
S10
S11
S12
E3
E7
Sprite
Sprite
Sprite
Sprite
0:35:23 626-646
0:56:05 306-326
1:06:03 895-915
1:43:59 658-678
Elve or halo 1:58:56 171-191
Elve
4:12:16 556-576
IC or
P+CG
(UTC)
(ms)
(ms)
node
0:05:35
160.0
181.9
87
CG 0:05:35
154.8
IC
IC
0:35:23
561.3
CG 0:35:23
628.7
IC
0:56:05
298.1
CG 0:56:05
300.6
IC
1:06:04
TLE
CG start IC end IC flash P.Cur. Delay (ms)
2.8
CG 1:06:03
901.6
IC
1:43:59
647.6
CG 1:43:59
654.2
IC
1:58:56
173.2
CG 1:58:56
174.3
IC
4:12:16
549.7
CG 4:12:16
570.8
(kA)
4.8
606.9
72
80.2
327.6
132
40.7
61.0
52
249.0
680.3
280
117.5
197.8
297
189.4
584.9
321
186.8
Min. Max.
-21
21
6
26
19
85
-3
17
-22
28
5
25
-166
-88
-7
13
-22
30
4
24
-27
18
-3
17
-29
26
-15
5
to the event S11 were not linked between them.
According to the delay observed this sprite was
probably linked to the CG stroke.
3.7. Analysis of the TLE and their parent +CG
and IC flashes
Table 4 presents the IC and CG activity
related to the TLE events according to the time
of occurrence of each event. IC indicates VHF
activity but it can be associated with the CG
lightning process in a same flash event. The 2
last columns show the minimum and maximum
delay between events. As the video frames have
a 20 ms time duration and IC flashes have two
times (start and end) the delays can not be
established uniquely, and a minimum and
maximum delays have been calculated.
Lyons (1996) has proposed that the spritegenerating +CG are associated with unusually
large charge transfers and continuing currents
associated with intra-cloud “spider” or “dendritic”
lightning known to accompany many +CG
events.
According to this proposal, when comparing
the time of the IC activity and the TLE
observations, it can be seen that in 5 of the 7
cases, the TLE could occur during the IC activity.
In case S9 the sprite occurred after the IC
activity and in case S11 the TLE occurred
previous to the IC. This seems to confirm that
such IC activity was not related to the TLE S11.
For each TLE we compare the lightning
activity detected by both systems. In the events
S10, S12, E3 and E7, the CG stroke occurred
between the first and last VHF sources. In the
case S7 the +CG was detected 5 milliseconds
before the first VHF source, and in the events S9
and S11, the CG occurred after the VHF
sources. Only in case S11, the delay was large
enough to doubt about the relation between VHF
sources and the CG stroke. Spatially, all events
matched except in the case S11, which confirms
that the VHF sources and the CG stroke related
Moreover, ICs associated to the TLEs have a
large number of nodes (ranging from 52 to 321)
and quite important dimensions. Calculating the
distance between the most far apart nodes, the
extension of the IC flashes associated to the TLE
observations were between 17 and 32
kilometers. Finally, it is interesting to note that IC
8
�winter thunderstorm with those analyzed in the
eastern Mediterranean by Altaratz et al. (2007)
and Ganot el al. (2007)
flashes related to Elves have more nodes than
IC flashes related to sprites.
Looking at the delays between the CG and
the sprite event, they were always lower than
values between 13 and 26 milliseconds.
According to Van der Velde et al. (2006), these
values should be typical of column sprites, and
as a matter of fact, the sprites observed were all
of this type, as illustrated in Figure 4. The elve
events exhibited lower values (< 17ms) which is
also generally observed.
The results found in this study supports the
Lyons (1996) proposal that the sprite-generating
+CG are associated with intra-cloud “dendritic”
lightning. Results also support the Lyons (1996)
proposal that sprites and elves appear to be
uniquely related to +CG events, moreover TLE
parent +CG usually have larger average peak
currents than the remaining +CG population in
the thunderstorm.
Rivas Soriano and De Pablo (2002), have
analyzed the lightning data of the Spanish
Lightning Detection Network over the sea in the
same region of study. They have found, in a
three year period (1992-1994), a mean (median)
annual value for positive CG flashes of 74.1 kA
(47.7 kA).
5. ACKNOWLEDGEMENTS
This study was supported by the Research
Training Network “Coupling of Atmospheric
Layers” (CAL), sponsored by the EU FP5
program under contract nº HPRN-CT-200200216.
The peak currents of the TLEs parent +CG
analyzed here (Table 4) have, in 5 of the 7
cases, values above the annual mean, and in 4
cases values above 100 kA .
We appreciate the contributions of Joan Bech,
Tomeu Rigo and Xavier Soler from the SMC
staff.
According to Huang et al. (1999), elves are
associated with large peak current +CG (50-200
kA). Both elves analyzed in this study have peak
currents above 180 kA.
6. REFERENCES
Altaratz, O., Levin Z., and Y. Yair , 2001: Winter
thunderstorms in Israel : A study with
lightning location systems and weather
radar. Month. Weath. Rev, 129 , 1259-1266.
4. SUMMARY
A case study of TLE observations in the
Mediterranean and its meteorological analysis
has been presented. While other studies have
given evidence of the occurrence of TLEs in the
winter
thunderstorms
in
the
eastern
Mediterranean, this study has shown that TLEs
occur in winter in other regions of the
Mediterranean Sea. Wintertime thunderstorms
develop over warm sea surfaces in other regions
such as the Sea of Japan. These storms are
usually smaller in both dynamical evolution and
vertical extent compared to large MCSs bearing
TLEs, and therefore are less common in
generating TLEs.
Bech, J., Rigo, T., Pineda, N., Segalà, S.,
Vilaclara, E., Sánchez-Diezma, R., SempereTorres, D., 2005: Implementation of the
EHIMI Software Package in the Weather
Radar Operational Chain of the Catalan
nd
Meteorological Service. 32 Conf. on Radar
Meteorology, American Meteo. Soc.
Chic O. and J. Font, 2004: Real time satellite
data
management
for
operational
th
oceanography, MAMA 5 Meeting, Malta.
Christian, H. J., R. Blakeslee, D. Boccippio, W.
Boeck, D. Buechler, K. Driscoll, S.,
Goodman, J. Hall, W. Koshak, D. Mach, and
M. Stewart, 2003: Global frequency and
The Meteosat and weather radar imagery
analysis have shown similarities of the analyzed
9
�and Continents, Month. Weath. Rev, 124,.
2417–2437.
distribution of lightning as observed from
space by the Optical Transient Detector, J.
Geophys. Res., 108, 4005.
Suzuki T., M. Hayakawa, Y. Matsudo and K.
Michimoto,
2006:
How
do
winter
thundercloud systems generate spriteinducing lightning in the Hokuriku area of
Japan?, Geophys. Res. Lett., 33, L10806.
Diendorfer G., R. Kaltenböck, M. Mair, and H.
Pichler, 2006: Characteristics of Tower
Lightning Flashes in a Winter Thunderstorm
and related Meteorological Observations,
19th Int. Lightning Detection Conf. (ILDC),
Tucson, USA.
Rivas Soriano, L., and De Pablo, F., 2002:
Maritime cloud-to-ground lightning: The
Western Mediterranean Sea, J. Geophys.
Res. 107 (D21), 4597-4608.
Ganot M., Y. Yair, C. Price, B. Ziv, Y. Sherez, E.
Greenberg, A. Devir and R. Yaniv., 2007:
First detection of transient luminous events
associated with winter thunderstorms in the
Eastern Mediterranean, Geophys. Res. Lett.,
34, L12801.
Rigo, T., 2004: Estudio de sistemas convectivos
mesoscalares en la zona mediterránea
occidental mediante el uso del radar
meteorológico. Tesis doctoral de la
Universitat de Barcelona, 202 pp.
Greenberg E., Price C., Yairb Y., Ganot M., Bór
J. and Sátori,G.,2007: ELF transients
associated with sprites and elves in eastern
Mediterranean winter thunderstorms, J.
Atmos. Solar-Terr. Phys., 69, 1569-1586.
Takahashi Y.; Miyasato R.; Adachi T.; Adachi K.;
Sera M.; Uchida A.; and H. Fukunishi, 2003:
Activities of sprites and elves in the winter
season, Japan, J. Atmos. Solar-Terr. Phys.,
65, 551-560.
Houze, R. A., Jr., 1993: Cloud Dynamics.
Academic Press, 573 pp.
Huang, E., E. Williams, R. Boldi, S. Heckman,
W. Lyons, M. Taylor, T. Nelson, and C.
Wong, 1999: Criteria for sprites and elves
based
on
Schumann
resonance
observations, J. Geophys. Res., 104(D14),
16,943–16,964.
Vaisala, 2004: CP 8000 User’s Guide, VAISALA
INC., pp.244
Van der Velde O. A., Á. Mika, S. Soula, C.
Haldoupis, T. Neubert, and U. S. Inan, 2006:
Observations of the relationship between
sprite morphology and in-cloud lightning
processes, J. Geophys. Res., 111, D15203.
Lyons, W.,1996: Sprite observations above the
U.S. High Plains in relation to their parent
thunderstorm systems, J. Geophys. Res.,
101(D23), 29641-29652.
Van der Velde, 2008, Morphologie de sprites et
conditions de productions de sprites et de
jets dans les systèmes orageux de
mésoéchelle, PhD Thesis, Université III Paul
Sabatier, Toulouse, France.
Mohr, K.I. and E.J. Zipser, 1996: Mesoscale
Convective Systems Defined by Their 85GHz Ice Scattering Signature: Size and
Intensity Comparison over Tropical Oceans
10
�
 S. Soula