MATEC Web of Conferences 276, 0 6028 (2019)
ICAnCEE 2018
https://doi.org/10.1051/matecconf /201927606028
Analysis of spatial variation of phosphates in
Batang Arau River, Indonesia
Denny Helard1*, Shinta Indah1, and Afdila Ardon1
1
Department of Environmental Engineering, Universitas Andalas, Padang, Indonesia
Abstract. This study aims to study the spatial variation of phosphates
(orthophosphate, total phosphate, and organic phosphate) in the Batang
Arau River, West Sumatera, Indonesia. Sampling was conducted at eight
stations along the river from March to May 2014. The results indicate that
the three types of phosphates have similar spatial distribution patterns, with
an increasing trend in concentration from upstream to downstream. The
results also showed that the average orthophosphate and total phosphates
concentrations at most of sampling sites had exceeded the quality standard
for river water in West Sumatera (class II < 0.2 mg/L) except in the
upstream. The mean concentrations of orthophosphate, total phosphates
and organic phosphate were 0.054-0.423 mg/L, 0.067-0.446 mg/L, and
0.013-0.072 mg/L, respectively. Analysis of spatial variation with ANOVA
at 95% confidence level indicated that differences in land use and human
activities along the Batang Arau River resulted in significant differences in
phosphates concentration (p < 0.05), except for organic phosphate.
1 Introduction
Phosphorus (P) is an essential nutrient for plants, animals, and humans. Phosphorus occurs
naturally in rocks and other mineral deposits. During the natural process of weathering, the
rocks gradually release the phosphorus as phosphate ions which are soluble in water, and
the mineralize phosphate compounds break down. Phosphates exist in three forms,
orthophosphate, metaphosphate (or polyphosphate), and organically bound phosphate.
Under natural conditions, phosphorus is typically scarce in water. Human activities like
urbanization and agricultural intensification, however, have resulted in excessive loading of
phosphorus into many freshwater systems. This can cause water pollution by promoting
eutrophication in surface water. The most common effects of eutrophication are enhanced
vegetation growth, algae blooms, and the imbalance of the aquatic ecosystems [1]. Water
quality can be further impaired when bacteria consume dead algae and use up dissolved
oxygen, suffocating fish and other aquatic life. Furthermore, the degradation of water
resources by eutrophication also has effects such as fishing and boating recreation use
losses, reduced biodiversity and conservation values, human health threat through the
production of toxic cyanobacterial blooms [1-4]. Rivers are particularly vulnerable due to
their proximity to population centers and sensitivity to land use changes [5].
*
Corresponding author: dennyhelard@eng.unand.ac.id
© The Authors, published by EDP Sciences. This is an open access article distributed under the terms of the Creative
Commons Attribution License 4.0 (http://creativecommons.org/licenses/by/4.0/).
�MATEC Web of Conferences 276, 0 6028 (2019)
ICAnCEE 2018
https://doi.org/10.1051/matecconf /201927606028
As one of the most important rivers in West Sumatera, Indonesia, water quality of
Batang Arau River is of great concern. The river provides a source of freshwater supply for
the local communities to perform their daily activities such as bathing, laundry, irrigation,
recreation, and most important of all as a source of drinking water. However, rapid
industrialization and urbanization as well as agricultural activities along Batang Arau River,
has led to intense pollution to the river [6, 7]. Previous studies showed that concentration of
phosphate from the upstream to the downstream of the river was in the range of 1.38-9.81
mg/L [8] and 1.23-1.63 mg/L [9] that had exceeded the quality standard for river water in
West Sumatera based on the Regulation of Governor of West Sumatera No. 5/2008 (class II
< 0.2 mg/L). Therefore, it is necessary to study the nutrients like phosphorus contamination
of the river water to protect freshwater resources and public health.
This study aims to describe the spatial variation of phosphate for the identification and
evaluation of nutrient pollution control in Batang Arau River. So far, a monitoring program
and some researches about nutrient pollution in the Batang Arau River are only reporting
the concentration of nutrients, without any information about their spatial variations. Spatial
analysis of pollutants is necessary to understand better how sources of risk, the receptors,
and the exposure pathways are distributed in space [10]. Moreover, a spatial analysis should
be carried out within a river basin to evaluate the effects of various land use types on water
quality. To get designing strategic sampling locations in the management of water resources
for an effective monitoring program, spatial analysis is required as well [7]. The results of
this study may serve a better interpretation of nutrient pollution and assist in promoting
water management and conservation strategies, as well as the design of an effective future
spatial monitoring network in the Batang Arau River.
2 Material and methods
2.1 Study area
The length of Batang Arau River from upstream to downstream is approximately 19,827
km with a catchment area of about 172 km2. In the upstream of the Batang Arau River,
there is a small portion of land is used for agriculture and the residential human population
is relatively rare [11]. Nevertheless, intense urbanization occurs from midstream to
downstream in the Batang Arau River, potentially causing water pollution.
Fig. 1. Map presenting sampling points on the Batang Arau River.
2
�MATEC Web of Conferences 276, 0 6028 (2019)
ICAnCEE 2018
https://doi.org/10.1051/matecconf /201927606028
2.2 Sampling points
Surface water samples were collected from eight stations along the Batang Arau River at
biweekly intervals between March and May 2014. The sampling stations were classified as
one baseline station (S1) and seven impact stations (S2, S3, S4, S5, S6, S7, and S8). The
baseline station is referred to the natural and unpolluted state of the river basin that is
located upstream of the river, and the impact stations are used for measuring the quantity of
pollutant and extent of pollution because of human interference. The seven impact stations
(S2–S7) represented the industrial, domestic, agricultural, and commercial activities. The
sampling point locations and sampling points description are seen in Fig. 1 and Table 1.
Table 1. Description of eight sampling points.
Elevation
Stations
Latitude
Longitude
Distance
(from S1)
m.a.s.l.* (m)
(km)
Description
S1
0o56’49.9”
100o 30’31.5”
229
0
Upstream of the Batang Arau River
which is located in a forested area.
S2
0o57’30.4”
100o27’08.0”
124
4.2
Located on a drain which is carrying
wastewater from a limestone mill and
agricultural activities.
S3
0 57’39.7”
100 25’29.7”
72
10.1
Received wastewater from households
and commercial activities. The water load
increases as a result of the merging of
two nearby tributaries in this area.
S4
0o57’40.8”
100o24’02.3”
18
13.8
The river has passed through agricultural
and industrial areas.
16.7
The streams have received wastewater
from rubber industry and the discharge of
the river water has been reduced as a
result of diverting to the nearby flood
control channel.
S5
o
0o57’43.3”
o
100o22’54.1”
7
S6
0 57’26.8”
100 22’41.1”
6
17.6
Located after the streams couple with the
secondary drainage channels, called
Batang Jirak, which receive wastewater
from the domestic and commercial areas.
S7
0o57’41.4”
100o22’28.4”
3
18.9
The stream couples with the channel of
Jati Drain that receives wastewater from
domestic and commercial activities.
S8
0o57’44.8”
100o21’51.5”
1
19.9
Downstream of the river; all pollutants
along the river accumulated.
o
o
*m a.s.l.: meters above sea level
2.3 Sample collections
Five sampling trips by grab method were performed from March to May 2014. Water
samples were collected in 1 L glass bottles. Temperature, pH, and dissolved oxygen were
determined in the field. All sample bottles were placed in cooler boxes with ice at
approximately 4°C before analysis.
3
�MATEC Web of Conferences 276, 0 6028 (2019)
ICAnCEE 2018
https://doi.org/10.1051/matecconf /201927606028
2.4 Analytical methods
The in-situ measurements of pH and temperature were taken with the corresponding
portable meters (Hanna, USA) while DO use DO-meter (Lutron, Taiwan). The total
phosphorus test measures all the forms of phosphorus in the water sample (orthophosphate,
condensed phosphate, and organic phosphate). This is accomplished by first "digesting"
(heating and acidifying) the sample to convert all the other forms to orthophosphate. Then
the orthophosphate is measured by the ascorbic acid method. Each sample was analyzed in
triplicate, and average readings were automatically determined. The measurements were
conducted according to the standard method [12].
2.5 Statistical analysis
SPSS version 20.0 was used for statistical analysis. Data analysis was carried out using
Microsoft Excel 2013 and data were presented in tables and graphs. One-way analysis of
variance (ANOVA) was used to examine the significant spatial distribution of phosphates.
3 Results and discussion
3.1 Spatial variation of phosphates in the Batang Arau river
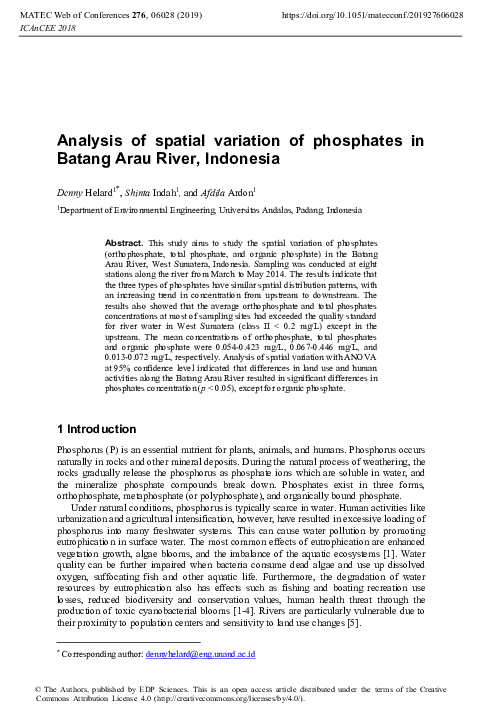
Spatial variation of phosphates including orthophosphate, total phosphate, and organic
phosphate in the Batang Arau River are illustrated by box-whisker plots (Fig. 2), whereas
overall means, standard deviations, and minimum, and maximum values of environmental
parameters and phosphates concentrations at the eight sampling points are summarized in
Table 2. The values of DO and pH at eight sampling points decreased from upstream to
downstream of the Batang Arau River, whereas the temperature tends to increase. This may
be due to differences in land use and the presence of several effluents entering the Batang
Arau River from upstream to downstream of the Batang Arau River. However, the values
of the environmental parameters were still in the range of quality standard for river water in
West Sumatera based on Regulation of Governor of West Sumatera No. 5/2008 for class II.
The concentrations of phosphates including orthophosphate, total phosphate, and
organic phosphate were in the range of 0.054 to 0.423 mg/L, 0.067 to 0.446 mg/L, and
0.013 to 0.02 mg/L, respectively. Typically, phosphates have similar spatial distribution
patterns, with an increasing trend in concentration from upstream to downstream in the
Batang Arau River. For instance, the mean concentration of orthophospate increased from
0.054 ± 0.076 mg/L upstream to 0.423 ± 0.012 mg/L downstream. The upstream area
represents a natural and unpolluted river reflecting the natural background concentrations of
metals. S1 is located in a forested area and there is no influence from human activities on
water quality in this area, thus, it can be the reference stream for the other stations.
Generally, in unaffected environments, the concentration of most of pollutants in rivers is
very low and mostly derived from the weathering of rock and soil [7, 13]. Hence, the
phosphates concentrations at S1 station are relatively lower than at the other stations. The
increase in phosphates concentrations downstream may cause by anthropogenic influences
such as agricultural, domestic, and industrial activities along the Batang Arau River, as the
concentration of phosphates at all stations had much higher average values than those in
water samples from the upstream, S1. This defines that increased phosphates concentrations
most likely originated from anthropogenic activities.
4
�MATEC Web of Conferences 276, 0 6028 (2019)
ICAnCEE 2018
https://doi.org/10.1051/matecconf /201927606028
Fig. 2. Spatial variations of (a) Orthophosphate, (b) Total-P, and (c) Organic-P in Batang Arau river.
Moreover, as also shown in Fig. 2, phosphates concentrations were compared with
quality standard for river water in West Sumatera based on Regulation of Governor of West
Sumatera No. 5/2008 for class II [14]. The mean concentrations of orthophosphate and total
phosphates at S3 until S8 were higher than the maximum permissible concentrations
established by Regulation of Governor of West Sumatera for the river water quality
standard of class II (Table 2). At S1 dan S2, orthophosphate and total phosphates
concentrations were, respectively, in the range of 0.054 to 0.199 mg/L and 0.067 to 0.139
mg/L, while at S3 until S8 those concentrations were in the range of 0.201 to 0.423 mg/L
and 0.232 to 0.446 mg/L. The quality standard for river water in West Sumatera based on
Regulation of Governor of West Sumatera No. 5/2008 for class II is 0.2 mg/L. Therefore,
much greater attention should be paid to phosphates concentration in water to protect
aquatic life from phosphates pollution and eutrophication.
One-way analysis of variance (ANOVA) was carried out to examine significant spatial
variations in phosphates concentrations. Table 3, 4, and 5 show the p values of comparison
of orthophosphate, total phosphate, and organic phosphate concentrations at eight sampling
points.
Table 3 and Table 4 show that the concentrations of orthophosphate and total
phosphates demonstrate significant spatial variability at the eight sampling points (p <
0.05). The concentration of orthophosphate and total phosphates increased significantly at
S2, S3, S4, S5, S6, S7, and S8. These results indicate that anthropogenic activities and
different land use along the Batang Arau River may lead to significant variability in the
5
�MATEC Web of Conferences 276, 0 6028 (2019)
ICAnCEE 2018
https://doi.org/10.1051/matecconf /201927606028
spatial distribution of orthophosphate and total phosphates concentrations in the river.
Wastewater from industrial, agricultural, and domestic sources are released into the river
from S2 to S8 stations resulting in the significant differences in phosphates concentrations.
Table 2. The means, standard deviations, minimum, and maximum values of environmental
parameters and concentrations of phosphates at the eight sampling points (n = 5).
Stations
Parameters
S1
S2
S3
S4
S5
S6
S7
S8
Mean
8.5
7.16
7.42
6.24
6.94
7.18
6.96
6.68
Std dev
0.3
0.716
0.867
1.820
1.085
0.268
0.537
0.934
Min
8.0
6.4
6.1
3.3
5.2
6.9
6.6
5.5
Max
8.9
8.3
8.2
7.9
7.9
7.6
7.9
8
Mean
8.4
8.72
8.40
7.86
7.76
7.60
7.64
7.54
Std dev
0.4
0.449
0.706
0.416
0.568
0.418
0.378
0.577
Min
8.0
8.1
7.8
74
7.1
7.2
7.2
6.9
Max
8.9
9.1
9.6
8.5
8.2
8.1
8.2
8.1
Mean
25.8
28.64
30.8
30.56
30.52
30.50
30.42
30.44
Std dev
0.4
1.820
2.477
1.665
1.802
1.735
1.071
1.135
Min
25.2
26.4
28.1
29.3
29.2
29.6
29.7
29.5
Max
26.2
31.2
34.7
33.4
33.7
33.6
32.3
32.4
Mean
0.054
0.119
0.201
0.271
0.240
0.335
0.360
0.423
Std dev
0.0076
0.0245
0.0158
0.027
0.008
0.033
0.02
0.012
Min
0.046
0.09
0.013
0.187
0.225
0.304
0.330
0.409
Max
0.063
0.15
0.155
0.225
0.293
0.383
0.375
0.437
Mean
0.067
0.139
0.238
0.299
0.273
0.407
0.381
0.446
Std dev
0.0059
0.028
0.017
0.020
0.010
0.008
0.016
0.012
Min
0.056
0.052
0.222
0.268
0.263
0.401
0.368
0.433
Max
0.078
0.084
0.267
0.320
0.286
0.421
0.407
0.462
Mean
0.013
0.021
0.037
0.022
0.034
0.072
0.025
0.02
Organic
phosphate
Std dev
0.003
0.0068
0.0078
0.0093
0.013
0.0673
0.01
0.005
(mg/L)
Min
0.007
0.013
0.026
0.013
0.018
0.038
0.015
0.015
Max
0.015
0.032
0.044
0.034
0.051
0.098
0.038
0.028
DO (mg/l)
Min. 4
pH
Temperature
(oC)
Ortophosphate
(mg/L)
Total
phosphate
(mg/L)
Water
quality
standard
6-9
±3
0.2
0.2
0.2
* Regulation of Governor of West Sumatera No. 5/2008 for class II
There were no significant differences in orthophosphate and total phosphates
concentrations were observed at S3, S4, S5, as well as at S6, and S7 (p >0.05). The similar
condition in anthropogenic activities and land use at those stations may cause the results.
6
�MATEC Web of Conferences 276, 0 6028 (2019)
ICAnCEE 2018
https://doi.org/10.1051/matecconf /201927606028
Tabel 3. p values of comparison of orthophosphate concentrations at eight sampling points (α = 0.05).
S1
S2
S3
S4
S5
S6
S7
S1
-
S2
0.000
-
S3
0.000
0.000
-
S4
0.000
0.000
0.000
-
S5
0.000
0.000
0.094
0.251
-
S6
0.000
0.000
0.000
0.001
0.000
-
S7
0.000
0.000
0.000
0.000
0.000
0.577
-
S8
0.000
0.000
0.000
0.000
0.000
0.000
0.001
S8
-
Tabel 4. p values of comparison of total phosphates concentrations at 8 sampling points (α = 0.05).
S1
S2
S3
S4
S5
S6
S7
S1
-
S2
0.000
-
S3
0.000
0.000
-
S4
0.000
0.000
0.000
-
S5
0.000
0.000
0.043
0.234
-
S6
0.000
0.000
0.000
0.001
0.000
-
S7
0.000
0.000
0.000
0.000
0.000
0.254
-
S8
0.000
0.000
0.000
0.000
0.000
0.000
0.001
S8
-
Tabel 5. p values of comparison of organic phosphate concentrations at 8 sampling points (α = 0.05).
S1
S2
S3
S4
S5
S6
S7
S1
-
S2
0.974
-
S3
0.095
0.514
-
S4
0.935
1.000
0.634
-
S5
0.150
0.077
1.000
0.787
-
S6
0.000
0.000
0.001
0.001
0.001
-
S7
0.756
0.999
0.864
1.000
0.949
0.000
-
S8
0.979
1.000
0.491
1.000
0.654
0.000
0.999
7
S8
-
�MATEC Web of Conferences 276, 0 6028 (2019)
ICAnCEE 2018
https://doi.org/10.1051/matecconf /201927606028
On the other hand, for organic phosphate, significant differences in concentration were
not obtained at all station, except at S6 (Table 5). S6 is located after the river couples with a
secondary drainage channel. This location receives wastewater from commercial and
domestic areas such as auto services and public market.
The ratio of organic phosphate concentration and inorganic phosphate (orthophosphate)
is illustrated in Fig. 3, where the percentage of inorganic phosphate is greater than organic
phosphate at all sampling points. Based on land use, almost all sampling sites are
residential areas that produce domestic wastewater. The primary source of phosphate, both
inorganic phosphate (orthophosphate) and organic phosphate, may come from human
activities. The concentration of orthophosphates may increase by the use of detergents and
cleaners in domestic activities and discharged the effluent directly into water bodies, while
the organic phosphates may derive from human feces along the river.
Orthophosphate (Inorganic Phosphate)
Organic Phosphate
Percentages (%)
100
80
60
40
20
0
S1
S2
S3
S4
S5
S6
S7
S
Sampling Points
Fig. 3. Ratio of orthophosphate and organic phosphate in total phosphates concentrations at 8
sampling points.
4 Conclusions
The results reveal that phosphates in the Batang Arau River, typically, have a similar spatial
variation pattern, with an increasing trend in concentration from upstream to downstream. It
reflects that the natural and anthropogenic activities along the river affect the variability of
the phosphate concentration. The mean concentrations of orthophosphate and total
phosphates at most of the sampling points were higher than the maximum permissible
concentrations established by Regulation of Governor of West Sumatera for river water
quality standard of class II, indicating that phosphates could be potential pollutants to lead
eutrophication in the Batang Arau River. Significant spatial variabilities were found in the
concentration of orthophosphate and total phosphates along the Batang Arau River, but
neither in the concentration of organic phosphate. This defines that the different land uses
and anthropogenic activities along the Batang Arau River may change their spatial
distributions.
The authors would like to thank Directorate General of Higher Education, Ministry of Education and
Culture, Indonesia (Grand No.030/SP2H/DIT.LITABMAS/2015) for financial support.
References
1.
S. Carpenter, N. Caraco, D. Correll, R.W. Howarth, A.N. Sharpley, V.H. Smith, Ecol.
8
�MATEC Web of Conferences 276, 0 6028 (2019)
ICAnCEE 2018
2.
3.
4.
5.
6.
7.
8.
9.
10.
11.
12.
13.
14.
https://doi.org/10.1051/matecconf /201927606028
Appl. 8 (1998)
V.H. Smith, G.D. Tilman, J.C. Nekola, Environ. Pollut. 100, 1–3, (1998)
E. Jeppesen, M. Sondergaard, J.P. Jensen, K.E. Havens, O. Anneville, L. Carvalho,
M.F. Covene, et al. Freshw. Biol. 50, 10 (2005)
W.K. Dodds, J.R. Jones, E.B. Welch, Water Res. 32, 5 (1998)
P.J.A. Withers, H.P. Jarvie. Sci. Total Env. 400, 1–3 (2008)
C.H. Pang, A.E. Rak, H. Hermansah, J. of Appl. Sci. in Env. Sanitation 7, 3 (2012)
S. Indah, D. Helard, M.A. Herfi, H. Hamid, Water Env. Res. 90, 32 (2018)
Maharani, S. Kajian kualitas air Batang Arau pada musim hujan parameter fosfat,
sulfat, dan klorida (Skripsi, Universitas Andalas, Padang, 2006)
Bapedalda Provinsi Sumatera Barat, Laporan status lingkungan hidup daerah tahun
2013 (Bapedalda, Padang, 2013)
J. Delgado, J. M. Nieto, T. Boski, Estuar. Coast. Shelf Sci. 88, 1, (2010)
BPS Kota Padang, Kota padang dalam angka 2017 (BPS, Padang, 2017)
APHA-AWWA-WE, Standard Method for The Examination of Water and Wastewater
(American Public Health Association, Water Environment Federation, New York,
2005)
Varol, B. Gökot, A. Bekleyen, B. Şen, Catena 92 (2012)
Anonim, Peraturan Gubernur Sumatera Barat Nomor 5 tahun 2008 (Gubernur
Sumatera Barat, Padang, 2008)
9
�
 Denny Helard