Sensors and Actuators B, 3 (1991) 267-272
267
Optical sensor for on-line determination
of solvent mixtures based on a
fluorescent solvent polarity probe zyxwvutsrqponmlkjihgfedcbaZYXWVUTSRQPONMLKJIHGFEDCB
Manfred A. Kessler and Jiirgen G. Gailer
Anabtical Division, Institute of Organic Chemistry, Karl Franzens University, A-8010 Graz (Austria)
Otto S. Wolfbeis
Institute for Optical Sensors, Joanneurn Research, S~eyrer G. 17, A-8010 Graz (Austria)
(Received March 5, 1991; accepted May 30, 1991)
Abstract
A new optical sensor for determination of solvent mixtures (such as water in organic solvent) is based
on a fluorescent solvent polarity (SP) probe immobilized on an ion-exchange membrane. The fluorescent
probe responds to changes in SP by both a shift in the fluorescence emission maximum and a change
in fluorescence quantum yield. In this sensor, the analytical information is the relative fluorescence
intensity measured at 620 nm (500 nm excitation). The sensor can be applied over a wide range of
solvents. The response time (rW) is of the order of 15 s. Given the unique applications of fibre optic
sensors (e.g., for remote sensing and sensing in explosive areas), the new sensor is expected to be
applicable in process control.
Introduction
Continuous sensing of solvent polarity (SP)
is of significant importance in process control
when mixtures of solvents of different polarity
are to be monitored. Because quite a variety
of dyes is known to respond to SP by a change
in their optical properties [l], it becomes
obvious that such dyes may be exploited for
sensing SP optically, particularly when combined with optical fibres onto which they may
be immobilized. Optical parameters that may
change with SP include absorbance, fluorescence intensity, fluorescence lifetime or efficiency of energy transfer from one chromophore to another [l]. Given the particular
situation when using fibre optics, we prefer
fluorescence over absorbance. Unfortunately,
some of the common polarity indicators such
as the ET dyes [2] are virtually non-fluorescent.
On the other hand, most of the fluorescent
polarity probes require UV or shortwave visible light excitation [3], which is not desirable
when working with optical fibres with their
poor transmissivity below 400-450 nm. Recently, we have reported on ketocyanine dyes
0925-4005/91/$3.50
that exhibit strong SP-dependent fluorescence
[4]. The SP-induced shift of both the fluorescence excitation and the emission spectra
makes it possible to sense SP optically using
such probes. However, attempts to immobilize
such dyes covalently on a solid support have
been of little success so far. Electrostatic
immobilization on an ion-exchange membrane
appeared to be an attractive alternative, provided the dye could be furnished with more
than one charged substituent in order to
warrant strong electrostatic interaction with
the solid support.
We report here on a new ketocyanine dye
possessing two (negatively charged) sulfo
groups, the investigation of its SP-dependent
fluorescence, its immobilization on an ionexchange matrix and its use for on-line determination of solvent mixtures, in particular
water in ethanol.
Experimental
probes, chemicals and solvents
The SP-sensitive probe used in this work
was compound 4 (see Scheme l), which was
prepared by the following four-step protocol:
0 1991 -
Elsevier Sequoia, Lausanne
1-(3-(5-Sulfa-2,3-dihydro-IH-indol-I-yl)-2propenylidene-5-sulfo-2,3-dihydro-IH-indolI-ium perchlorate (3)
This was prepared by analogy to a published
procedure [4, 61 with modifications. Thus, a
mixture of 2 (2.8 g, 14 mmol), tetramethoxypropane (1.13 g, 7 mmol), perchloric acid
(70%; 2 ml) and anhydrous ethanol (5.5 ml)
was heated to 60 “C for 10 min. After chilling,
the obtained precipitate was sucked off to
yield orange crystals (2.3 g, 60%). The material
starts to decompose at 200 “C. IR spectrum
(KBr): 1620, 1580 cm-‘. NMR spectrum
(DMSO-d6): delta 8.98 (d, 2 H), 7.70 (s, 2
H), 7.46 (d, 2 H), 7.30 (d, 2 H), 5.90 (t, 1
H), 4.20 (t, 4 H), 3.27 (t, 4 H) ppm.
.
2,5-Bis-[3-(5-sulfa-2,3-dihydro-IH-indol-Iyl)-2-propenylidenej-cyclopentanone
(4)
4
Scheme 1. Synthetic pathway and chemical
the fluorescent solvent polarity probe 4.
structure
of
N-acetylindoline
(1)
This was prepared by dropwise addition of
indoline (5.14 g, 43 mmol) in chloroform (25
ml) to a well-stirred solution of acetylchloride
(3.35 g, 43 mmol) in chloroform (50 ml). The
obtained precipitate was sucked off and dried
to yield white crystals (3.4 g, 50%). M.p.: 218
“C.
Indoline-Psulfonic
acid (2)
This was prepared according to a published
procedure [5] with slight modifications: 1 (3.4
g, 21 mmol) was added in small portions to
8.8 ml of chilled chlorosulfonic acid under
stirring. During the exothermic reaction, hydrogen chloride was evolved violently. Then,
the mixture was kept at 50-60 “C for 1.5 h
and finally poured onto 25 g crushed ice. The
solution was filtered and kept in a refrigerator
overnight. The precipitate was sucked off and
washed with ice-cold water to yield colourless
crystals (2.8 g, 65%) which, upon heating,
start to decompose at 300 “C. IR spectrum
(KBr): 2900, 2550, 1610, 1420, 1375 cm-‘.
NMR spectrum (DMSO-d,): delta = 7.70 (d,
2 H), 7.47 (d, 1 H), 3.80 (t, 2 H), 3.25 (t,
2 H) PPm.
This was prepared similarly to a previously
published procedure [4]. Cyclopentanone (0.2
g, 2.4 mmol) and 3 (2.3 g, 4.3 mmol) were
added to a previously prepared solution of
sodium (0.6 g, 26 mmol) in anhydrous ethanol
(13 ml). The reaction mixture was refluxed
for 1 h and was finally of dark red colour.
The precipitated product was sucked off and
washed well with ethanol to yield the crude
deep red dye (2.1 g). Since attempts to purify
the dye by recrystallization or preparative
TLC have not been successful so far, we
applied it for sensing purposes without further
purification.
Ethanol/water
mixtures (v/v) were prepared from 100% ethanol of extra pure quality
(Merck, Dannstadt, F.R.G.) and double-distilled water.
Preparation of the sensor membrane
The sensing membranes used in this work
have a 175 pm Mylar membrane as a solid
support, onto which finely dispersed aminohexylcellulose (Serva, Heidelberg, FRG) was
glued in a thin layer of typically 5-7 pm
thickness using a hydrogel glue. The membrane was placed in the flow-through cell of
the fluorometer and a concentrated aqueous
solution of probe 4 was pumped through the
cell, upon which binding of the dye to the
surface of the membrane occurred.
Instrumenta lion
Uncorrected fluorescence excitation and
emission spectra were obtained using an
269
Aminco
SPF
500
spectrofluorometer
equipped with a 250 W tungsten halogen
lamp. Continuous
monitoring
of water/
ethanol mixtures was carried out using a Jasco
821 FP spectrofluorometer
(Biolab, Vienna,
Austria) equipped with a 150 W xenon lamp
and a self-constructed 20 ~1 flow-through cell.
Fluorescence was measured in the front-face
geometry. The maximum spectral response
was obtained by setting the excitation/emis408
588 zyxwvutsrqponmlkjihgfedcbaZYXWVUT
666
768
ml
sion monochromators
to 500 and 620 nm,
welength
Inn1
respectively. In order to decrease photoFig. 1. Fluorescence excitation and emission spectra of SP
bleaching of the SP probe, the intensity of
probe 4 in absolute ethanol (---)
and in water (-).
the exciting beam was reduced by a factor
The spectral shift indicates a strong positive sokatochroof 10 using a violet Cokin Creative Filter (as
mism.
frequently applied in photography). In addition, scattered light from the sensor membrane was suppressed by the same filter, which
acts as a 580 nm longpass filter. The response
signal of the sensor was acquired and processed by a computer and recorded on a
flatbed recorder. The whole system was under
computer control using a Keithley 575 Measurement and Control System (Keithley Instruments, Vienna, Austria). All spectroscopic
measurements have been carried out at 25
“C. zyxwvutsrqponmlkjihgfedcbaZYXWVUTSRQPONMLKJIHGFEDCBA
618 (
0
20
40
mter
60
80
100
in ethanol [vol. Xl
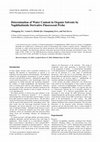
Fig. 2. Near-linear relation between the wavelength of the
emission maximum of the solvent polarity probe 4 and the
Results and discussion zyxwvutsrqponmlkjihgfedcbaZYXWVUTSRQPONMLKJIHGFEDCBA
Design of the probe
amount of water in ethanol. 4 was excited at its respective
excitation maximum, ranging from 556 nm in ethanol to
577 nm in water.
Quite a number of solvent polarity (SP)
probes has been described in the literature.
Table 1 gives a selection of dyes that have
been considered as potential candidates for
use in sensors. However, all of the dyes listed
lack one of the following criteria: long-wave
excitation, large Stokes’ shift, high fluorescence quantum yield, ease of immobilization
and a strong dependence of optical properties
on solvent polarity.
We finally decided to use SP probe 4 for
the design of an optical SP sensor. It has
long-wave absorption and fluorescence, strong
fluorescence in most organic solvents but poor
fluorescence in water, and an acceptable
Stokes’ shift. The synthetic pathway along
with the chemical structure of probe 4 is
given in Scheme 1. Due to the presence of
two sulfa groups, the probe is readily soluble
in polar solvents such as water and alcohols.
Solutions exhibit strong yellow, orange, or
red fluorescence depending on the respective
SP. Fluorescence
excitation and emission
spectra in pure water and in ethanol are
shown in Fig. 1. Both undergo long-wave
shifts in changing from less polar to highly
polar solvent (Table 2). We used this effect
to design an optical sensor for solvent polarity,
so as to measure the ratio of components in
a binary mixture.
We primarily focused on ethanol/water mixtures for practical reasons. Figure 2 shows
that there is an almost linear relation between
the emission peak wavelength of 4 and the
water content in ethanol. In fact, the emission
maxima may be used for determination of
the ethanol/water ratio. For sensing purposes
it is more practical, however, to work at fixed
excitation and emission wavelengths.
270
TABLE 1. Solvent polarity probes and their photophysical properties
Probe
Excitation/emission maximum
(in solvents of different polarity)
Disadvantage
Prodan”
350/452 (acetonitrile)
364/531 (water)
requires UV excitation,
oxygen quenches
Nile red
485/525 (heptane)
530/605 (acetone)
difficult to immobilize,
water insoluble
ET(30)b
795 (dioxane)
550 (ethanol)
almost non-fluorescent
1-(4-Nitrophenyl)-6-phenylhexatriene
400/455 (hexane)
405/650 (methanol)
requires UV excitation
poor photostability
“6-propionyl-2-dimethylaminonaphthalene.
bData from ref. [l]. ‘Absorption maxima.
TABLE 2. Spectral data of SP probe 4 in various solvents
Solvent
Polarity [ETN]
Absorption/emission
tnm)
Water
Methanol
Ethanol
2-Propanol
Dimethylsulfoxide
Dimethylformamide
1.000
0.765
0.654
0.552
0.441
0.404
5771644
5551638
5561619
5201596
5201578
5321562
maximum
Quantum yield
(qualitative)
low
high
high
high
high
high
a ETN values for solvent polarity are based on polarity indicator ET(30).In this scale, tetramethylsilane (TMS) is defined
as the most apolar solvent (ETN=O.OOO),whereas water is the most polar one @TN= 1.000) (from ref. 1).
Construction
sensor
and response function
of the
In order to obtain a sensor for continuous
measurement of SP, we have immobilized
probe 4 on a solid cellulosic support that is
easily penetrated by solvent. A Mylar membrane is used as a mechanical support onto
which we have immobilized aminohexylcellulose and the SP probe. Figure 3 shows the
response of the sensor, operated at fixed
wavelengths, to various ethanol/water mixtures. Unlike the case of correlation with the
absorption maximum, the relation is non linear, simply because 4 exhibits much stronger
fluorescence in ethanol than in water. Consequently, the highest sensitivity is achieved
in the 80 to 100% ethanol range (Fig. 3).
Figure 4 shows a typical response curve recorded from a series of mixtures containing
small amounts of water in ethanol. Thus, a
change from anhydrous ethanol to 95%
ethanol causes a decrease in the signal by
about one third. Given such a dramatic decrease in fluorescence intensity, a resolution
of 0.5% water in >95% ethanol, and a detection limit of about 0.2% water in ethanol
are realistic estimates. To the best of our
knowledge, such a sensitivity of an optical
SP sensor has not been reported so far.
On the other hand, it is obvious from Fig.
3 that the sensor is rather insensitive in the
0 to 20% ethanol range, which is where the
a.1
1
t
t
ethanol 100 X
0.0
1,.
I,,
0
5
wter
I.
II
11,
I,,
15
I,.
I,
ta
tlm
25
Rid
Fig. 3. Response time, relative signal change and reversibility
of the SP sensor toward ethanol/water mixtures. The highest
sensitivity obviously is observed in the 80 to 100% ethanol
(v/v) range.
271
index changes. This would considerably
increase the response time.
In contrast to most chemical sensors and
biosensors, the sensor reported here is a real
sensor, in that it is based on a non-destructive
physical process. It also may be applied to
other solvent mixtures.
0
20
Conclusions
*
180
48
64
zyxwvutsrqponmlkjihgfedcbaZYXWVUTSRQPONMLKJIHGFEDCBA
the
kin1
Fig. 4. Response curve for ethanol/water mixtures. The
sensitivity toward low levels of water is demonstrated by
the a35 % decrease in fluorescence caused by 5 % water
in ethanol (v/v). The signal drift indicates photobleaching
that is caused by the strong xenon lamp of the fluorometer.
alcohol content of most alcoholic beverages
lies. The rather high sensitivity in the range
from 80 to 100% ethanol is not so much due
to the SP-induced
spectral shifts in the absorption and emission maxima, but rather to
the extreme SP dependence
of the fluorescence quantum yield of 4. In this range, the
sensitivity of the new sensor exceeds by far
that of other sensors, such as those based
on changes of the refractive
index [7, 81.
At present, some problems are encountered
with the drifting signal of the sensor. This
is assumed to be a result of photobleaching
of 4 when it is exposed to the rather strong
xenon lamp of the Jasco instrument.
We
expect to solve this problem by making use
of a pulsed LED light source, which has
considerably
lower output power. It is desirable, however, to design an SP probe whose
absorption has a better match with the emission of the green LED. An alternative
way
to overcome signal losses by photobleaching
is to regenerate
the sensor membrane
by
rinsing it with a stock of 4 in order to exchange
the photodecomposition
products. Leaching
during operation
does not occur to a measurable extent.
The response time (t& is about 15 s, which
is mainly caused by the dead volume of the
flow-through cell. This is obvious, since there
is no diffusional
barrier
and no chemical
reaction step involved. However, for application to coloured
or turbid solutions we
recommend
coating the sensitive membrane
with an optical isolation layer, in order to
exclude stray light and effects from refractive
The sensor described here provides an easy
means for on-line determination
of low levels
of water in ethanol. It is the first sensor that
makes use of a fluorescent
SP probe, and
provides good sensitivity in the l-20% water
in ethanol range and, more generally, for low
levels of water in an organic solvent. Since
the sensor does not require excitation with
ultraviolet light, it is compatible with standard
fibre optics and may be applied for remote
process control. Potential fields of application
include the monitoring
of product quality in
ethanol distilleries, on-line quality assurance
during production
of anhydrous ethanol, and
on-line determination
of water in technical
solvents used in chemical plants.
Acknowledgement
We gratefully acknowledge
the help of B.
Weigl in software development.
References
Ch. Reichardt, Solvent and SoIvent Eficts in Organic
Chetitty,
VCH, Weinheim, 2nd edn., 1988, Ch. 6.
M. A. Kessler and 0. S. Wolfbeis. ET(33), a solvatochromic polarity and micellar probe for neutral
aqueous solutions, Cheer. Phys. Lipids, 50 (1989) 51.
M. A. Kessler and 0. S. Wolfbeis, Polarity sensitive
fluorescent probes, Appl. Fluoresc. Technol., 2 (1990)
11.
M. A. Kessler and 0. S. Wolfheis, New highly zyxwvutsrqponml
fluorescent
ketocyanine polarity probes, S’ctrochim. Acfa, Part A,
47 (1991) 187.
A. P. Terent’ev and M. N. Preobrazhenskaya, Introduction of substituents into the benzene ring of indole,
Zh. Obshch. Khim., 30 (1960) 1218.
D. Lloyd and H. McNab, Simple preparation of 2,3dihydro-lH-1,4-diaxepinium
perchlorate,
SynthesLs,
(1973) 791.
T. Takao and H. Hattori, Fluid observation with an
optical fiber refractometer,Jpn. .I.Appl. Phys., 21(1982)
1509.
272
8 E. Smela and J. J. Santiago-Aviles, A versatile twisted
Otto S. Woljbeis is professor of chemistry
optical fiber sensor, Sensor and Actuators, 13 (1988)
and head of the Analytical Division of the
117. zyxwvutsrqponmlkjihgfedcbaZYXWVUTSRQPONMLKJIHGFEDCBA
Biographies
Manfred A. Kessler, born in 1964, received
a Ph.D. in chemistry from Karl Franzens (KF)
University in 1990. His major interests are
in analytical chemistry, especially fluorescence
methods, syntheses and applications
of molecular probes, optical chemical sensors, flowinjection analysis (FIA), dye chemistry, solvent polarity, computer-controller
data acquisition and programming
in Turbo Pascal.
Dr Kessler has authored several papers on
new applications
of molecular
probes including determination
of solvent polarity, cmc
values of surfactants,
and albumin in urine.
Jiirgen G. Gailer, born in 1967, is an M.S.c.
student at the Chemistry Department
of KJ?
University. His major interests are in analytical and organic chemistry.
Institute
of Organic Chemistry
at the KF
University in Graz, Austria, where he obtained
his Ph.D. degree in 1972. He served as a
post-doctoral
fellow at the Max-Planck
Institute for Radiation Chemistry in Miilheim
(West Germany)
from 1972 to 1974 and at
the Technical University of Berlin in 1977.
Dr Wolfbeis has authored
more than 160
papers on optical sensors, fluorescence
spectroscopy of plant natural products
such as
coumarins,
flavons and alkaloids,
and has
edited a book entitled Fiber Optic Chemical
Sensors and Biosensors. Other fields of research
include
three-dimensional
fluorescence spectroscopy
of biological liquids, and
synthetic and spectroscopic
work on fluorescent probes and indicators. He has given a
number of invited lectures at international
meetings and numerous guest lectures at universities and institutes.
His current
major
research interests are in optical chemical sensors and biosensors.
Keep reading this paper — and 50 million others — with a free Academia account
Used by leading Academics

Tobias Takas Shumba
Harare Polytechnic

Cesar Mello
Massachusetts Institute of Technology (MIT)

Rgo Araujo
UFBA - Federal University of Bahia

Yucel Kadioglu
Ataturk University