Exp Fluids (2013) 54(1):1-9 The final publication is available at Springer via http://dx.doi.org/10.1007/s00348-013-1609-0
S. Fortini1, G. Querzoli2, S. Espa1, A. Cenedese1
Three-dimensional structure of the flow inside the left ventricle
of the human heart
1. Dipartimento Ingegneria Civile, Edile e Ambientale, Sapienza Università di Roma - Via Eudossiana 18, 00184, Roma, Italy
2. Dipartimento di Ingegneria Civile Ambientale e Architettura, Università degli studi di Cagliari - Via Marengo 3, 09123, Cagliari,
Italy
e-mail: querzoli@unica.it
Abstract
The laboratory models of the human heart left ventricle
developed in the last decades gave a valuable contribution to
the comprehension of the role of the fluid dynamics in the
cardiac function and to support the interpretation of the data
obtained in vivo. Nevertheless, some questions are still open
and new ones stem from the continuous improvements in the
diagnostic imaging techniques. Many of these unresolved
issues are related to the three-dimensional structure of the leftventricular flow during the cardiac cycle. In this paper we
investigated in detail this aspect using a laboratory model. The
ventricle was simulated by a flexible sack varying its volume
in time according to a physiologically shaped law. Velocities
measured during several cycles on series of parallel planes,
taken from two orthogonal points of view, were combined
together in order to reconstruct the phase averaged, threedimensional velocity field. During the diastole, three main
steps are recognized in the evolution of the vortical structures:
i) straight propagation in the direction of the long axis of a
vortex-ring originated from the mitral orifice; ii) asymmetric
development of the vortex-ring on an inclined plane; iii) single
vortex formation. The analysis of three-dimensional data gives
the experimental evidence of the reorganization of the flow in
a single vortex persisting until the end of the diastole. This
flow pattern seems to optimize the cardiac function since it
directs velocity towards the aortic valve just before the systole
and minimizes the fraction of blood residing within the
ventricle for more cycles.
Keywords: ventricular flow, feature tracking, bio-fluid
dynamics, vortex dynamics
Introduction
The general structure of the intraventricular flow is known to
affect the effectiveness of the heart as a pump, and possibly
cause thrombo-embolism and hemolysis (Ismeno et al. 1999;
Alemu and Bluestein 2007; Sengupta et al. 2012).
Since the early twentieth century, technological advances have
had a major impact on diagnostic tools, which in these years
have had continuous improvements including 3D echoDoppler cardiography (Haugen et al. 2000; Coon et al. 2012;
Benenstein and Saric 2012) ultrasound imaging velocimetry
(Poelma et al. 2011) and time-resolved 3D Magnetic
Resonance Imaging (MRI) velocimetry (Wigström et al. 1999;
Kilner et al. 2000; Töger et al. 2012). Neverthless, our level of
understanding of the heart function still represents a limitation
to the ability to design strategies for proper diagnosis and
effective treatment of cardiac dysfunctions (Vasan and Levy
2000; Mandinov et al. 2000). Thus, the major challenge in
solving the problem of dysfunctions in the cardiovascular
system arises mainly from the need of a deeper understanding
of the basic mechanisms governing the function of the system
itself. Improvement in the description of the phenomena based
on in vitro modelling of the physiological processes is useful
for supporting the interpretation of the more and more detailed
data acquired in vivo.
One of the most important phenomena involved in the left
ventricular diastolic flow is the presence of the vortical
structures that develop as the filling jet enters through the
mitral valve. Some authors focused the interpretation of data
obtained from axisymmetric models in terms of vortex
dynamics (Steen and Steen 1994; Vierendeels et al. 2002;
Baccani et al. 2002) by comparing the space–time map of the
axial velocity with clinical echo-Doppler imaging. Other
authors focussed on the interaction between vortex generation
and leaflet opening in a two-dimensional, experimental model
(Romano et al. 2009). The presence of a three-dimensional
flow structure has been recognized since the early
experimental investigations (Bellhouse 1972; Reul et al. 1981;
Wieting and Stripling 1984). These studies showed a
transmitral jet, with a leading vortex ring propagating through
the left ventricle. In the same years, the phenomenon was
numerically simulated using realistically shaped ventricle
models (Saber et al. 2001; Lemmon and Yoganathan 2000).
The details of the three-dimensional flow during the diastole
have also been investigated numerically for an ideally shaped
left ventricle corresponding to a healthy child (Domenichini et
al. 2005). This study showed that the vortex-ring developing
from the mitral valve follows a curved path that turns towards
the ventricle wall. Additionally, Pedrizzetti and Domenichini
(2005) showed that the intraventricular energy dissipation is
significantly affected by the structure of the vortex flow. Other
authors used the continuous improvements in MRI and
computer processing to develop patient-specific numerical
modelling (Schenkel et al. 2009; Doenst et al. 2009).
Experimental ventricle models have been used to obtain timeresolved, 2D velocity fields by means of high-speed cameras
and image velocimetry techniques. Most investigators focused
on the impact of prosthetic valves on intraventricular flow
(Brucker et al. 2002; Cooke et al. 2004; Cenedese et al. 2005,
Akutsu et al. 2005, Pierrakos et al. 2005, Querzoli et al. 2010;
Vukicevic et al. 2012). The flow was investigated mainly on
symmetry planes, assuming two-dimensionality of the velocity
1
�Exp Fluids (2013) 54(1):1-9 The final publication is available at Springer via http://dx.doi.org/10.1007/s00348-013-1609-0
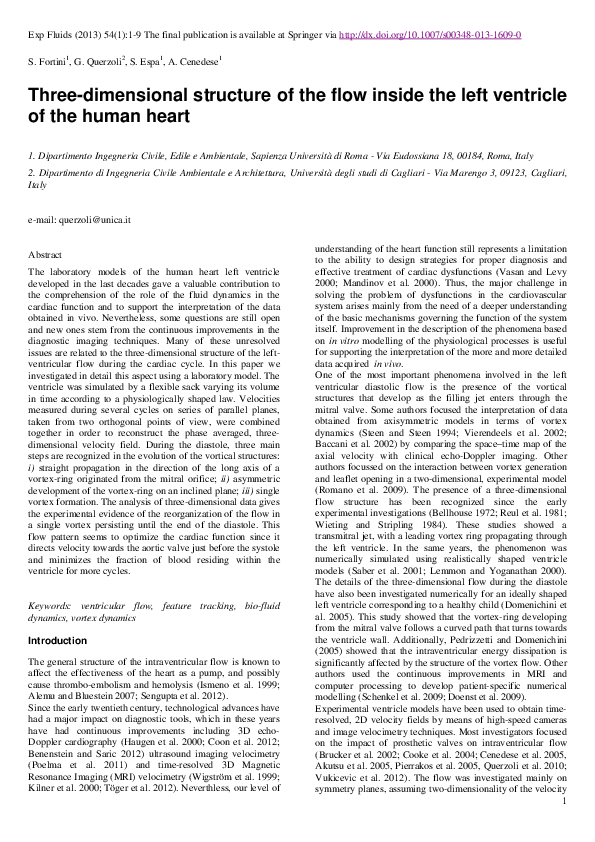
Velocities were extracted from the phase-averaged data-set
obtained as described in the following of this section. The blue
line indicates the inflow through the mitral valve during the
diastole phase, whereas the red line indicates the outflow
through the aortic valve during the systole phase.
9
h
8
7
6
q / CO
field. However, the nature of the flow and the quantities of
interest in these studies are intrinsically three-dimensional and
these studies do not yield information about the out of plane
component of the velocity. Three-dimensional measurements
were then necessary to capture all the aspects of the
phenomenon.
Simulations in vitro have the advantage of being run in
controllable and repeatable conditions. Also, they allow for
the use of laboratory velocimetry techniques that yield the
level of accuracy required for understanding the physical
phenomena underlying the complex structure of the flow. In
order to study the three-dimensional features of the velocity
field, a series of experiments have been run in a flexible, leftventricle, laboratory model. Vortex dynamics, including the
development and propagation of the diastolic vortex-ring and
the distribution of viscous shear stresses have been analysed.
b
5
4
a
3
c
2
d
1
1. Materials and Methods
The ventricular flow was simulated by means of the laboratory
model shown in Fig. 1 and described in detail in Querzoli et
al. (2010) and Espa et al. (2012).
A flexible, transparent sack made of silicone rubber (0.7 mm
thick) simulated the left ventricle allowing for the optical
access.
0
e
0
0.1
0.2
0.3
0.4
g
f
0.5
t/T
0.6
0.7
0.8
0.9
1
Fig. 2 Time variation of flow-rate q(t) through the mitral (blue line)
and aortic valve (red line) non-dimensionalized by the cardiac output
(CO = SV/T, where SV is the stroke volume and T the period of the
cardiac cycle). Labelled dots indicate the time instants considered in
the next section
The diastole exhibits two peaks: the first (E-wave)
corresponds to the ventricle dilation while the second peak is
due to the contraction of the left atrium (A-wave). The
working fluid inside the ventricle (distilled water) was seeded
with neutrally buoyant hollow glass particles with an average
diameter of about 30 µm and a density of 1016 Kg/m3. Planes
parallel to the long axis of the ventricular model were
illuminated by a 12 W, infrared laser (wavelength: 800 nm,
light-sheet thickness: 1.5 mm). A triggered high-speed camera
(Mikrotron EoSens MC-1362, 250 frames/s, duty cycle: 50%,
resolution: 1280x1024 pixels), equipped with a 105 mm - f
2.8, objective, recorded the time evolution of the particle
positions at known time intervals for the successive analysis.
Fig. 1 Experimental set-up. A: Ventricle chamber; B: Laser; C:
Motor; D: Piston; E: pressure transducer; F: high speed camera
The model ventricle was fixed on a circular plate, 56 mm in
diameter, connected to a constant-head reservoir by means of
two Plexiglas conduits. Along the inlet (mitral) and outlet
(aortic) conduits, check-valves were mounted in order to
functionally simulate the native heart valves. The inlet
(corresponding to the annulus in the real heart) was designed
in order to obtain a uniform velocity profile at the mitral
orifice. The velocity was verified to be top-hat shaped in a
preliminary series of high resolution measurements in the
region downstream the inlet (Querzoli et al. 2010). The leftventricular model was placed in a rectangular tank (A) with
transparent, Plexiglas walls. The ventricle volume changed
according to the motion of the piston (D), placed on the side
of the tank. The piston was driven by a linear motor (C),
controlled by means of a speed-feedback servo-control. The
motion assigned to the linear motor was tuned to reproduce
the volume change acquired in vivo by echo-cardiography on a
healthy subject. In Fig. 2, the flow rate, q, is plotted as a
function of time. The inflow and outflow rates were computed
by spatial integration of the velocity over the surfaces
corresponding to the inlet and outlet orifice, respectively. The
integration was performed by means of a first order scheme.
Fig. 3 Measurement planes (black dashed lines). AO: aortic orifice.
MO: mitral orifice.
2
�Exp Fluids (2013) 54(1):1-9 The final publication is available at Springer via http://dx.doi.org/10.1007/s00348-013-1609-0
Data obtained from two sets of planar measurements acquired
from two orthogonal views (X-Z and Y-Z, Fig 3) have been
used to reconstruct the three-dimensional flow during the
ventricle filling. For each view, we acquired 50 cycles on 24
parallel planes distant 2.2 mm from each other. The spatial
resolution of the images was, 0.04 mm/pixel. Images of a
target immersed in the ventricle were used to check that the
ventricle wall was thin enough not to cause meaningful
deformation in the images over the investigation regions.
The images of each video recording have been analysed using
a Feature Tracking algorithm (Cenedese et al. 2005). This
method allowed us to reconstruct the two- dimensional
velocity field evolution in a Lagrangian framework. In these
experiments, at least 6000 particles have been simultaneously
traced during the cardiac cycles.
Interpolation of the velocity vectors over a regular grid for
each plane yielded the time evolution of the Eulerian
instantaneous velocity field in function of time.
Two-dimensional Eulerian velocity data were phase averaged
over the 50 cycles. Finally, the phase averages on the two sets
of orthogonal planes were combined together (by linear
interpolation) to obtain the phase averaged three-dimensional,
three-component, velocity field. The resulting temporal and
spatial resolutions of the four-dimensional data set were 4.0
ms and 2.2 mm, respectively. Based on the time and spatial
resolution of the video recordings, the accuracy in the
measurement of the velocity can be estimated of order of 104
m/s (Miozzi et al. 2008). As a result, a description of the
three-dimensional evolution of the intraventricular flow
structure during the cardiac cycle was obtained.
Matching the ratio of inertial to viscous effects between the
natural heart and the laboratory model requires the equality of
Reynolds and Womersley numbers:
Re=
2.1 Vertical velocity
The salient characteristics of the flow can be educed by
looking at the regions of ascending (i.e. moving from the
ventricle apex to the valves) and descending (i.e. moving
towards the apex) fluid. Those regions are identified in Fig. 4
and Fig. 5 by plotting the iso-value surfaces of the Z velocity
component corresponding to ± 0.2 U (0.2 is an arbitrary
threshold chosen as low as possible but clearly discriminating
upwards and downwards motion). The iso-surfaces are
presented at the eight time instants indicated with the letters a
to h in Fig. 2. The blue surface indicates fluid moving
downwards, whereas the red surface indicates fluid moving
upwards. Fig. 4 shows four instants during the first filling
wave (E-wave). The blue core corresponds to the development
of a jet from the mitral orifice that, at the end of the E-wave (t
= td, d), impinges the ventricular wall near the apex. A vortex
ring develops all around the leading edge of the jet and, from
the first diastolic peak (t = tb, b), it becomes apparent as far as
it induces the upward velocities indicated by the red surface.
The core of the vortex ring is located just between the red
torus and the blue, downward jet.
D2
UD
and Wo=
Tν
ν
where D is the maximum diameter of the ventricle, U the peak
velocity through the mitral, T the period of the cardiac cycle
and ν the kinematic viscosity of the working fluid. The
geometrical ratio was 1:1.
Parameters used during the present experiments are: stroke
volume 64 ml, T = 6 s, U = 0.145 m/s. The working conditions
have been chosen so that the Reynolds and Womersley
numbers are within the physiological range: specifically,
Re = 8112 and Wo = 22.8.
2. Results
The four-dimensional data set was firstly analysed in order to
elucidate the role of the coherent structures generated during
the diastole. The flow was described in terms of Z-component
of the velocity. This quantity catches the main features of the
flow such as the filling jet and the vortexes dominating during
the diastole, whose axis lay on the X-Y plane. Unlike other
quantities commonly used to reveal vortical structures, the
vertical velocity field is affected by a low level of noise since
its computation does not involve derivatives and, differently
from vorticity, it is not sensitive to the shear layer at the walls.
Furthermore, data were analyzed to evaluate the spatial
distribution of the shear stresses and their relation with the
vortical structures. To this aim, the second eigenvalue of the
pressure Hessian (Joeng and Hussein 1995), i.e. 2, and the
shear stress iso-surfaces have been plotted and discussed.
Fig. 4 Vertical velocity iso-surfaces for values ±0.2 U at times ta =
0.13 T (a), tb = 0.18 T (b), tc = 0.23 T (c), td = 0.29 T (d). Red
indicates upward velocities, blue indicates downward velocities. Two
circles indicate the mitral (larger) and aortic (smaller) orifice
Due to the eccentricity of the position of the mitral orifice
with respect to the ventricle axis, the posterior side of the
vortex ring (the opposite to the aortic orifice) is closer to the
ventricular wall. On that side, the velocity induced by the
primary vortex causes a boundary layer to develop at the wall,
with the corresponding generation of secondary vorticity.
According to the observations of Verzicco and Orlandi (1994),
the region of the vortex-ring closest to the wall is
characterised by a considerably higher local, stretching rate.
Then, its core becomes very thin and the secondary vorticity,
produced at the smaller scales, diffuses and annihilates
primary vorticity for cross-cancellation. As a consequence, the
radius and the intensity of the posterior side of the vortex ring
tend to decrease. Moreover, due to the wall effect, it moves
3
�Exp Fluids (2013) 54(1):1-9 The final publication is available at Springer via http://dx.doi.org/10.1007/s00348-013-1609-0
slower than its opposite (anterior) side, which is nearly in the
centre of the ventricle and increases in radius. Consequently,
at the end of the first filling wave (t = td, d) the vortex ring is
oblique (Fig. 5), with the anterior part, close to the apex,
which has grown larger. During the time interval between the
first and the second filling, the so-called diastasis, the
posterior side of the vortex ring vanishes completely, whereas
the opposite side continues to grow.
However, the action of the shear stresses generated by the
flow on the blood may play a meaningful role in platelet
activation, thrombo-embolism, and hemolysis (Alemu and
Bluestein 2007; Nobili et al. 2008).
Though the present spatial resolution (2.2 mm) is not high
enough to evaluate effects at the blood cell scale, high-shear
regions at the resolved scales correspond to the zones where
the above-mentioned phenomena are more likely to take place
and then represent a useful description of the large scale flow
features.
Fig. 5 Vertical velocity iso-surfaces for values ±0.2 U at times te =
0.40 T (e), tf = 0.57 T (f), tg = 0.78 T (g), th = 0.84 T (h). Red
indicates upward velocities, blue indicates downward velocities. Two
circles indicate the mitral (larger) and aortic (smaller) orifice,
respectively
Correspondingly, the core of the vortex turns into a line,
beginning and ending at the ventricle wall, which gradually
straightens until it becomes a horizontal line orthogonal to the
symmetry plane of the ventricle. As a result, the flow
rearranges into a single vortex occupying the whole ventricle.
The presence of that large structure is clearly indicated in the
plots of figure 5 by the posterior region of downward flow and
the anterior region moving upwards at t = te (e) and t = tf (f).
The plot at the end of the diastole (Fig. 5, t = tg, g)
demonstrates that the second ejection from the mitral,
corresponding to the A-wave, does not break the large
structure observed at the end of the diastasis, and the main
phenomenon remains the (red) region of fluid moving towards
the aortic orifice. The above results confirm what inferred
from two-components, planar measurements on the symmetry
plane (Querzoli et al. 2010, Vukicevic et al. 2012): after the Ewave, the flow reorganizes in a single large structure that
prepares the flow to the successive systolic phase. This also
agrees with what was observed in four-dimensional MRI flow
measurements obtained in vivo by Töger et al. (2012). The last
plot of Fig. 5 shows that, during the systole, the upwards
outflow is the only significant pattern.
2.2 Shear Stresses
The vertical velocity plots give information about the general
structure of the flow and its evolution during the cardiac cycle.
Fig. 6 Shear Stresses at times ta = 0.13 T (a), tb = 0.18 T (b), tc = 0.23
T (c), td = 0.40 T (d). Blue surface delimits the region where max ≥ 4
U2, colours of the slice indicate max ranging from 0 up 10 U2
according to the colour bar. Dark grey 2 iso-surface indicates the
vortex-ring core (an arbitrarily negative value was chosen to optimize
the identification)
In general, at a given location, the magnitude of the shear
stress depends on the orientation of the surface that one
considers. However, there is an orientation yielding the
maximum shear stress. On that surface, the shear stress can be
expressed as (Cenedese et al. 1978; Grigioni et al. 2002,
Balducci et al. 2004):
max = ( - 1) / 2
where and are the minimum and maximum eigenvalue of
the stress tensor, respectively. The above maximum value which is by definition frame independent - is the one
discussed in the following. Three-dimensional plots of the
maximum shear stresses, max, non-dimensionalised by ρU2
and phase averaged on the whole set of acquired cardiac
cycles, are presented at the same time instants as above.
Additionally, to give an insight into the relation between the
shear stress intensity and the vortical structures characterizing
the intraventricular flow, iso-surfaces of the function
proposed by Jeong and Hussain (1995) to identify vortex cores
have been reported on the same plots. We briefly recall that
is the intermediate eigenvalue of the tensor:
2 + S2
4
�Exp Fluids (2013) 54(1):1-9 The final publication is available at Springer via http://dx.doi.org/10.1007/s00348-013-1609-0
where S and are the symmetric and antisymmetric part of
the velocity gradient tensor, respectively. Vortex cores are
typically characterized by high, negative values of 2.
the end of the diastasis (t = tf, f), the reorganization of the flow
in a single vortex, with a horizontal core orthogonal to the
symmetry plane, may be inferred by the approximate
alignment of the 2 surface along that direction. The same
organization is recognizable also after the second ejection (t =
tg, g). However, both the high diffusion undergone by the
vortex and the presence of noise, make the eduction of the
vortex core from the distribution of 2 not trivial at this phase
of the cycle. The vortical structure of the flow vanishes
completely during the systole (t = th, h), and the possibly high
shear stresses generated by the outflow are confined within the
aortic orifice and in the downstream region, that is out of our
measurement field.
Discussion
Fig. 7 Shear Stresses at times te = 0.40 T (e) tf = 0.57 T (f), tg = 0.78
T (g), th = 0.84 T (h). Blue surface delimits the region where max ≥
U2, colours of the slice indicate max ranging from 0 up 10 U2
according to the lower colour scale. Dark grey 2 iso-surface
indicates the vortex-ring core (an arbitrarily negative value was
chosen to optimize the identification)
Fig. 6 shows the non-dimensional shear stresses at the same
four times of the early filling phase as Fig. 4. During the
accelerated ejection (t = ta, a), high shear stress levels are
located at the edge of the jet entering the ventricle and just at
the inner margin of the vortex-ring core. Comparing Fig. 6a
with Fig. 4a, it is worth noticing that 2 criterion can catch the
presence of the vortex-ring from its initial stage of
development (grey surface). At the first diastolic peak (t = tb,
b) the highest shear stresses are still found at the edge of the
jet, though a region of elevated values still surround the
vortex-ring core. At t = tc (c) the inflow is decreasing. At the
same time, the vortex-ring is fully developed and propagating
through the ventricle, relatively free from wall effects.
Therefore, the region around the vortex core gives the
predominant values, with two peaks just leading and trailing
the core.
As the vortex-ring impinges the ventricular wall (Fig. 6, t = td,
d), the high velocities induced by the vortex in the proximity
of the wall cause an intense shear. This is the time when the
highest shear levels are observed. In the following
development of the flow (Fig. 7, e-f), as the flow re-organizes
during the diastasis and the second ejection, the shear stress
levels are meaningfully lower. Since at this time the vortical
motion involves the whole ventricle, the maximum values of
the shear stresses are located close to the wall. In particular,
the highest values are observed at the posterior ventricular
wall, i.e. where the jet from the mitral orifice was directed. At
The three-dimensional structure of the flow inside the left
ventricle has been experimentally analysed and described in
terms of vertical velocity, shear stresses and λ2 fields during
the whole cardiac cycle. It is well known that, during the rapid
filling (E-wave), a vortex-ring leads the inflow and propagates
through the ventricle (Vierendeels et al. 2002; Cooke et al.
2004). It has been suggested that the vortex-ring plays an
important role in optimizing the cardiac function (Pedrizzetti
and Domenichini 2005; Dabiri 2009; Querzoli et al. 2010).
The continuous enhancement in the details and quality of data
obtained in vivo suggested, recently, the use of the
characteristics of the vortex ring as an index of the efficiency
of the left ventricular function (Eriksson et al. 2010;
Belohlavek 2012). Most investigators focused on the initial
stage of the development of the vortex ring, i.e. when it is a
well-defined structure, easily detected and measured by ColorDoppler or MRI data (Töger et al. 2012). However, the
evolution of the structure of the flow during the entire cardiac
cycle is relevant to the efficiency of the pump function of the
left ventricle. In this context, the present results give the
experimental evidence of the re-organization of the flow
during the diastasis in a single, two-dimensional vortex with a
horizontal axis, orthogonal to the line connecting the centres
of the valve orifices. Consequently, the vortex-ring evolution
can be summarized into three main steps:
1. straight propagation: of an axi-symmetric vortex-ring
parallel to the long axis of the ventricle (ta, tb);
2. asymmetric development: the vortex-ring lays on an
inclined plane. The posterior side of the ring becomes
thinner than the anterior side, which instead increases in
radius (tc, td);
3. single vortex formation: the anterior side of the ring
gives rise to a single large vortex whose coherence is not
broken by the second filling (te, tf, tg).
Noticeably, phases 1 and 2 are clearly observed in the videos
published by Töger et al. (2012) as supplemental material to
their paper. However, in their investigation they do not go
further enough to recognize and discuss the third phase,
possibly due to the increasing complexity of the structure of
the flow measured in vivo.
It has already been recognized that the formation of the
vortex-ring stabilizes the filling jet during the E-wave, thus
minimizing the production of turbulence (Dabiri and Gharib
2004).
The single vortex phase suggests an additional element of
optimization in the intraventricular flow. Firstly, it induces
blood velocities directed towards the aortic outlet just before
the beginning of the systole. Secondly, the presence of a well5
�Exp Fluids (2013) 54(1):1-9 The final publication is available at Springer via http://dx.doi.org/10.1007/s00348-013-1609-0
organized flow involving a large part of the ventricular
volume minimizes the fraction of the blood volume residing
inside the left ventricle longer than one cycle.
Acknowledgements
This work was partially funded by the Ministero
dell'Istruzione e della Ricerca Scientifica, PRIN 2009, Project
n. 2009J7BL32.
References
Alemu Y, Bluestein D (2007) Flow-induced platelet activation
and damage accumulation in a mechanical heart valve:
numerical studies. Artif Organs 31(9):677-688
Akutsu T, Imai R, Deguchi Y (2005) Effect of the flow field
of mechanical bileaflet mitral prostheses on valve closing. J
Artif Organs 8(3):161-170
Baccani B, Domenichini F, Pedrizzetti G, Tonti G (2002)
Fluid dynamics of the left ventricular filling in dilated
cardiomyopathy. J Biomech 35(5):665-671
Balducci A, Grigioni M, Querzoli G, Romano GP, Daniele C,
D’Avenio G, Barbaro V (2004) Investigation of the flow field
downstream of an artificial heart valve by means of PIV and
PTV. Exp Fluids 36:(1)204-213
Bellhouse BJ (1972) Fluid mechanics of a model mitral valve
and left ventricle. Card Res 6(2):199-210
Belohlavek M (2012) Vortex formation time: an emerging
echocardiographic index of left ventricular filling efficiency?
Eur Heart J Cardiovasc Imaging 13(5):367-369
Benenstein R, Saric M (2012) Mitral valve prolapse: role of
3D echocardiography in diagnosis. Curr Opin Cardiol
27(5):465-476
Brucker C, Steinseifer U, Schroder W, Reul H (2002)
Unsteady flow through a new mechanical heart valve
prosthesis analysed by digital particle image velocimetry.
Meas Sci Technol 13:1043–1049
Cenedese A, Del Prete Z, Miozzi M, Querzoli G (2005) A
laboratory investigation of the flow in the left ventricle of the
human heart with prosthetic, tilting-disk valves. Exp Fluids
39(2):322–335
Cooke J, Hertzberg J, Boardman M, Shandas R (2004)
Characterizing vortex ring behaviour during ventricular filling
with Doppler echocardiography: an in vitro study. Ann
Biomed Eng 32(2):245–256.
Cenedese A, Mele P (1978) Analisi sperimentale degli sforzi
di Reynolds mediante anemometria laser. L’Energia Elettrica
2:53-58
Coon PD, Pollard H, Furlong K, Lang R M , Mor-Avi V
(2012) Quantification of left ventricular size and function
using contrast-enhanced real-time 3D imaging with power
modulation: comparison with cardiac MRI. Ultrasound Med
Biol 38(11):1853-1858
Dabiri JO, Gharib M (2004) Fluid entrainment by isolated
vortex rings. J Fluid Mech 511:311–331
Dabiri JO (2009) Optimal vortex formation as a unifying
principle in biological propulsion. Ann Rev Fluid Mech
41:17-33
Doenst T, Spiegel K, Reik M, Markl M, Hennig J, Nitzsche S,
Beyersdorf F, Oertel H (2009) Fluid-dynamic modeling of the
human left ventricle: methodology and application to surgical
ventricular reconstruction. Ann Thorac Surg 87:1187–1195
Domenichini F, Pedrizzetti G, Baccani B (2005) Threedimensional filling flow into a model left ventricle. J Fluid
Mech 539:179–198.
Eriksson J, Carlhäll CJ, Dyverfeldt P, Engvall J, Bolger AF,
Ebbers T (2010) Semi-automatic quantification of 4D left
ventricular blood flow. J Cardiovasc Magn Reson 12(1):9
Espa S, Bada MG, Fortini S, Querzoli G, Cenedese A (2012)
A Lagrangian investigation of the flow inside the left
ventricle. Eur J Mech B Fluids 35:9-19
Grigioni M, Daniele C, D’Avenio G, Barbaro V (2002)
Evaluation of the surface-averaged load exerted on a blood
element by the Reynolds shear stress field provided by
artificial cardiovascular devices. J Biomech 35:1613–1622
Haugen BO, Berg S, Brecke KM, Samstad SO, Slørdahl SA,
Skjærpe T, Torp H (2000) Velocity profiles in mitral blood
flow based on three-dimensional freehand colour flow
imaging acquired at high frame rate. Eur J Echocardiogr
1(4):252-256
Ismeno G, Renzulli A, Carozza A, De Feo M, Iannuzzi M,
Sante P, Cotrufo M (1999) Intravascular hemolysis after
mitral and aortic valve replacement with different types of
mechanical prostheses. Int J Cardiol 69(2):179-183
Jeong J, Hussain F (1995) On the identification of a vortex. J
Fluid Mech 285:69–94
Kilner PJ, Yang GZ, Wilkes AJ, Mohladin RH, Firmin DN,
Yacoub MH (2000) Asymmetric redirection of flow through
the heart. Nature 404(6779):759-61
Lemmon JD, Yoganathan AP (2000) Computational modeling
of left heart diastolic function: examination of ventricular
dysfunction. J Biomech Eng 122(4):297-303
Mandinov L, Eberli FR, Seiler C, Hess OM (2000) Diastolic
heart failure. Cardiovasc Res 45(4):813-825
Miozzi M, Jaacob B, Olivieri A (2008) Performances of
feature tracking in turbulent boundary layer investigation Exp
Fluids 45:765-780
Nobili M, Sheriff J, Morbiducci U, Redaelli A, Bluestein D
(2008) Platelet activation due to hemodynamic shear stresses:
damage accumulation model and comparison to in vitro
measurements. ASAJO J 54(1):64-72
Pedrizzetti G, Domenichini F (2005) Nature optimizes the
swirling flow in the human left ventricle. Phys Rev Lett
95(10):108101
Pierrakos O, Vlachos PP, Telionis DP (2005) Time-Resolved
DPIV analysis of vortex dynamics in a left ventricular model
through bileaflet mechanical and porcine heart valve
prostheses. J Biomech Eng 126(6):714-726
Poelma C, van der Mijle RME, Mari JM, -X. Tang M,
Weinberg PD, Westerweel J (2011) Ultrasound imaging
velocimetry: Toward reliable wall shear stress measurements,
Eur J Mech B Fluids 35:70-75
Querzoli G, Fortini S, Cenedese A (2010) Effect of the
prosthetic mitral valve on vortex dynamics and turbulence of
the left ventricular flow. Phys. Fluids 22(4):041901-041910
Reul H, Talukder N, Muller W (1981) Fluid mechanics of the
natural mitral valve. J Biomech 14(5):361-372
Romano GP, Querzoli, G, Falchi M (2009) Investigation of
vortex dynamics downstream of moving leaflets using robust
image velocimetry. Exp Fluids 47:827-838.
6
�Exp Fluids (2013) 54(1):1-9 The final publication is available at Springer via http://dx.doi.org/10.1007/s00348-013-1609-0
Saber NR, Gosman AD, Wood NB, Kilner PJ, Charrier CL,
Firmin DN (2001) Computational flow modeling of the left
ventricle based on in vivo MRI data: initial experience. Ann
Biomed Eng 29(4):275-83
Schenkel T, Malve M, Reik M, Markl M, Jung B, Oertel H
(2009) MRI-based CFD analysis of flow in a human left
ventricle: methodology and application to a healthy heart. Ann
Biomed Eng 37(3):503-515
Sengupta PP, Pedrizzetti G, Kilner P J, Kheradvar A, Ebbers
T, Tonti G, Fraser A G, Narula J (2012) Emerging trends in
CV flow visualization. JACC Cardiovasc Imaging 5(3):305316
Steen T, Steen S (1994) Filling of a model left ventricle
studied by colour M mode Doppler. Cardiovasc Res
28(12):1821-1827
Töger J, Kansky M, Carlsson M, Kovács S J, Söderlind G,
Arheden H, Heiberg E (2012) Vortex ring formation in the left
ventricle of the heart: analysis by 4D flow MRI and
Lagrangian coherent structures. Ann Biomed Eng.
40(12):2652-2662
Vasan RS, Levy D (2000) Defining diastolic heart failure.
Circulation 101:2118–2121.
Verzicco R, Orlandi P (1994) Normal and oblique collisions
of a vortex ring with wall. Meccanica 29:383-391
Vierendeels JA, Dick E, Verdonck PR (2002) Hydrodynamics
of color M-mode Doppler flow wave propagation velocity
V(p): a computer study. J Am Soc Echocardiogr 15(3):219224
Vukicevic M, Fortini S, Querzoli G, Espa S, Pedrizzetti G
(2012) Experimental study of the asymmetric heart valve
prototype. Eur J Mech B Fluids 35:54-60
Wieting DW, Stripling TE (1984) Dynamics and fluid
dynamics of the mitral valve. In: Duran C, Angell WW,
Johnson AD, Oury JH (eds) Recent Progress in Mitral Valve
Disease. Butterworths Publishers, London, pp 13-46
Wigström L, Ebbers T, Fyrenius A, Karlsson M, Engvall J,
Wranne B, Bolger AF (1999) Particle trace visualization of
intracardiac flow using time-resolved 3D phase contrast MRI.
Magn Reson Med 41(4):793-799
7
�
 Stefania Fortini