INTERNATIONAL JOURNAL OF AGRICULTURE & BIOLOGY
1560–8530/2004/06–2–355–358
http://www.ijab.org
Determinants of Technical Inefficiency on Farm Production:
Tobit Analysis Approach to the NDE Farmers in Ondo State,
Nigeria*
EBENEZER O. OGUNYINKA AND IGBEKELE A. AJIBEFUN†1
Department of Agricultural Economics, Kansas State University, USA
†Federal University of Technology, Nigeria
1
Corresponding author`s current address: Institute for Landscape Systems Analysis, Center for Agricultural Landscape
and Land Use Research (ZALF), Eberswalder Str. 84, D-15374 Muncheberg, Germany
E-mail: Igbekele.Ajibefun@zalf.de
ABSTRACT
The study estimates the determinants of technical inefficiency among the farmers that are participating in the Ondo State
chapter of the National Directorate of Employment (NDE) program in Nigeria. Data were collected from farmers under the
NDE programme in Ondo State, Nigeria. Using a tobit analysis, it was found that extension visits and higher education were
significant factors influencing technical efficiency. This suggests that sound education, efficient inputs supply strategy and
public awareness of efficient technology are key factors necessary for policy consideration.
Key Words: Technical Inefficiency; Determinants; Farm production; Tobit analysis; Nigeria
INTRODUCTION
Many studies that have examined technical efficiency
among farmers have generally reported gross inefficiency in
farm production. In a recent parametric investigation of
technical inefficiency among the farmers that are
participating in the National Directorate of Employment
(NDE) program in Ondo State of Nigeria in which the
stochastic frontier approach was used it was found that
technical efficiencies vary widely across farms ranging
between 21.7 and 87.8% with an average of 67% (Ajibefun
& Abdulkadri, 1999). This indicates an average technical
inefficiency of 33%.
The NDE, among others was introduced in 1987 as a
part of the modified Structural Adjustment Program (SAP)
adopted by Nigeria, which was less severe in its initial
effects on welfare than the full scale SAP originally
suggested by the World Bank during the economic
downturn of the early 1980s. The general objective of the
NDE is to generate self-employment among the high school
leavers and the graduates from colleges and universities
especially that have been affected by the pervasive
unemployment and underemployment problems. In the farm
sector, the goal is to simultaneously reverse the declining
trend of local food supplies and save foreign exchange on
food imports.
A number of the empirical analyses that have been
conducted in the area of technical efficiency in Nigeria do
not extend beyond the computation of the degree of
efficiency. In order to effectively improve productivity a
detailed study of the factors that contribute to the
inefficiencies across farms is indispensable. Education is
usually suggested as an important ingredient to productivity
enhancement. The fact that inefficiencies of such magnitude
as above were discovered among college and university
graduates necessitates a detailed investigation of the factors
causing them.
The objectives of the study are therefore to (1) identify
the factors contributing to technical inefficiency among crop
farmers that are participating in the NDE program (2)
quantify the effects of such factors identified above on
technical efficiency and (3) suggest ways of enhancing the
efficiency measures.
Other factors aside from education could also have
*A Revised Version of Paper presented at the Western Agricultural Economics Association Annual Meeting at The Denver Adam’s Mark Hotel, Denver, Colorado, July 11-15, 2003. The authors would like to thank participants of WAEA for their comments and contribution during presentation. They
however assume responsibility for any error in the paper.
TECHNICAL INEFFICIENCY ON FARM PRODUCTION / Int. J. Agri. Biol., Vol. 6, No. 2, 2004
location, management practices and strategies as well as
business organization and arrangement of farms (Hoppe et
al., 1996; Sall, 1997; Hoppe et al., 2001).
Literature Review. On average, the farms have not been
behaving badly in terms of technically efficiency unlike
other efficiency measures like allocative and scale
efficiencies especially in the developing countries. Despite
the rampant use of traditional or less advanced agricultural
technology in some low and middle income countries like
Argentina, Bangladesh, Nigeria, Philippines, Zaire and
Malaysia, the mean technical efficiency indices between
1964 and 1993 have been 1.00, meaning that they are
technically efficient but others like China, Iran, Ireland,
South Africa, Zimbabwe etc. experience very low levels of
efficiency. The United States, Japan, Israel and The
Netherlands are examples of technologically advanced
countries that are efficient over the same period (Arnade,
1998).
Although the technical efficiency indices are of great
importance in examining farm performance, a determination
of the factors influencing those indices is equally important.
A part of the study conducted by Featherstone et al. (1997)
on Kansas beef cow farms focused on the determinants of
technical inefficiency. Using a tobit regression model, they
found that seed, labor, utilities and fuel, veterinary services
and miscellaneous costs are significant factors that are
associated with technical inefficiency with feed cost being
the most important among them. A similar study by Sall
(1997) on Senegal found significance only on the ratio of
on-farm income to total income.
In his work on international agricultural efficiency and
productivity, Arnade (1998) found that fertilizer/land and
tractor/labor ratios - both depicting movements away from
traditional endowments, the impact of international research
institutes such as the Consultative Group for International
Agricultural Research (CGIAR) especially in seed variety
improvement agricultural research expenditure/agricultural
output ratio extension agents/farmers ratio, and average
level of education are significant factors that jointly affect
efficiency and productivity.
Other authors that have attempted the regression of the
efficiency and productivity indices from nonparametric
methods on explanatory variables (Schuh & Norton, 1991;
Schimmelpfennig & Thirtle, 1994; Thirtle et al., 1997).
significant effects on technical efficiency. Unavailability of
yield enhancing technology (fertilizer, pesticides, etc.)
inadequate funding and other logistic problems could be
possible culprits. Time consciousness in the supply of
inputs, adequate commitment on part of the parties involved
in ensuring good performance of the NDE farm business
and adopting the recommendations suggested from this
study would boost the effectiveness and success of the
production plans and policy.
Efficiency Concepts and Literature Review
Technical efficiency. Technical efficiency otherwise known
as pure technical efficiency (PTE) like its counterparts
(allocative, scale & scope efficiencies) according to Färe et
al. (1985) and Farrell (1957) is a major component of
productivity which itself is a measure of farm performance.
PTE indicates whether a farm uses the best available
technology. It reflects the ability of a farm to obtain
maximum output from a given set of inputs (Coelli et al.,
1998). A technically efficient farm operates on the
production frontier. A technically inefficient farm, i.e., one
that operates below the frontier could operate on the frontier
either by increasing output with the same input bundle or
using less input to produce the same output. The closer a
farm gets to the frontier, the more technically efficient it
becomes.
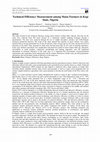
Fig.1 shows a graphical illustration of a production
efficiency frontier, put forward by Farrell (1957). A farm for
example, at point X refers to the inefficient farm, while
points Y and Z are both efficient because they are on the
frontier. The farm at point X should therefore move upward
to point Y or backward to point Z in order to be efficient. If
its movement is toward Y, more output is obtained with the
same amount of inputs or if it is toward Z, fewer amounts of
inputs yield the same output. Both cases depict more
technical efficiency than the initial position X. The position
of individual farms relative to the frontier, whether on the
frontier or below the frontier, would be influenced by
factors such as environmental, structural and farm
characteristics. These characteristics include the share of
production, size of farms, tenure, specialization, degree of
mechanization, operator’s characteristics, geographical
Fig. 1. Production Frontier
METHODOLOGY
In this paper the data used include measures of
technical efficiency and farm characteristics. The estimated
measures of technical efficiency were obtained from
Ajibefun and Abdulkadri (1999). Others including
observations on inputs used (hectares of land, man-days of
labor, tractor hours, fertilizer per kilogram and amount of
credit) and farm characteristics (such as age of farmers,
years of education and experience, number of extension
visits, and membership of farm management association)
•Y
Output
Z•
•X
Input Bundle
356
OGUNYINKA AND AJIBEFUN / Int. J. Agri. Biol., Vol. 6, No. 2, 2004
were sourced directly from the farmers in 1997 by the use of
questionnaire as well as from the databank of the Ondo
State Ministry of Agriculture, Akure, Nigeria.
The method of Featherstone et al. (1997) was followed
to compute the technical inefficiency indices by subtracting
the technical efficiency estimates from 1 after converting
them from percentages to decimals and we model the
technical inefficiency in a tobit regression (Tobin, 1958;
Greene, 1995) stated as follows:
n
TIEi =
∑
i =1
=0
Variables
∑β X +u <U , ⎪⎪⎬
i i
i =1
otherwise
,
i
Mean Std. Dev. Minimum
Maximum
Inefficiency
0.39
0.11
0.21
0.68
Land (hectares)
2.36
0.85
0.80
4.10
Labor (man-days)
165.94 71.14
69.00 400.00
Tractor Hours
8.69
4.10
1.00
20.00
Fertilizer (kg)
791.19 1364.38 0.00
8000.00
Extension Visits (#)
3.30
1.23
1.00
6.00
Age of Farmer (years) 45.12 7.31
25.00 57.00
Education (years)
8.16
3.72
0.00
15.00
Experience (years)
8.87
3.97
2.00
20.00
Membership (dummy) 0.61
0.49
0.00
1.00
Note: Statistics constructed from the data mentioned in section 3.
⎫
n
βi Xi + ui if Li <
Table I. Summary statistics for a sample of NDE farms
i
⎪
⎭⎪
No. of
Observations
67
67
67
67
67
67
67
67
67
67
Table II. Relationship among technical inefficiency, inputs and farm characteristics
where TIEi is the technical inefficiency measure for each
farm, Xi is a k x 1 vector of explanatory variable for the ith
farm, βi is a k x 1 vector of unknown parameters to be
estimated, ui are residuals that are independently and
normally distributed, with mean zero and a common
variance σ2, and Li and Ui are the distribution’s lower and
upper censoring points, respectively. The explanatory
variables are the ratios of inputs (proxy for the degree of
mechanization) and farm characteristics discussed above.
Observations on labor were converted from man-days to
hours of labor before calculating the tractor / labor ratio.
Education was categorized into years of high school, college
and university attendance by the operators. Profession of
operator, i.e., whether agricultural and non-agricultural,
would have been a vital variable but was not available.
We chose the tobit analysis by assuming that the
concentration of the dependent variable clusters toward the
left limit (i.e., zero) and because it does not only explain the
value of the dependent variable or the probability of limit
(e.g. point of technical efficiency) and non-limit (e.g. points
of technical inefficiency) responses, but also the size (i.e.,
value) of non-limit responses (Tobin, 1958). These reasons
give the tobit model added advantage over probit or multiple
regression analyses which disregard some important
information. In addition, we regard the sample as truncatedcensured since NDE focuses mainly on relatively large
farms with carefully mapped-out strategy in terms of farm
characteristics like size, credit, type of farms as well as
categories of farmers.
The coefficients obtained from using tobit have been
decomposed by McDonald and Moffitt (1980) into two
parts: effects on the probability of being above the limit and
effects conditional upon being above the limit. In this paper,
all observations have positive (nonzero) technical
inefficiency estimates. The cumulative distribution function
is presumed to be evaluated at the mean of the explanatory
variables and hence facilitates the computation of
percentage of the total change in technical inefficiency
resulting from a change in the explanatory variables that
would be generated by marginal changes in the value of
technical inefficiency. Deducting this from one will result in
Independent Variable
Constant
Age in years
Extension Visits
High School Education
(1-5 years)
College Education (6-9
years)
University Education (> 9
years)
Years of Farming Experience
Fertilizer / Land Ratio
Tractor / Labor Ratio
Membership of Association
Likelihood Ratio Test
Marginal
Effects
0.3901***
0.0021
0.0206*
-0.0722
Std.
Error
0.0796
0.0016
0.0111
0.0504
T-Ratio
P-Value
4.9027
1.2673
1.8520
-1.4313
0.0000
0.2050
0.0640
0.1523
-0.0872*
0.0470
-1.8525
0.0640
0.0486
-2.4297
0.0151
-0.0054
0.0039
-1.3887
0.1649
0.0000
-0.6864
-0.0184
0.0000
2.6568
0.0223
-0.6382
-0.2584
-0.8266
0.5233
0.7961
0.4085
-0.1181**
28.5379***
Notes: Single, double and triple asterisks (*) denote significance at 10%, 5%
and 1% level, respectively.
the percentage that would be generated by changes in the
probability of being technically efficient.
RESULTS AND DISCUSSION
Summary statistics for a sample of NDE farms. The
summary statistics of all the variables used are presented in
Table I. The average inefficiency is 39% by which the
farmers should increase output in order to produce on the
frontier. The average size of land is 2.36 h. This is an
indication that NDE members are large-scale producers
although the minimum land size of 0.85 h would have been
influenced by the amount of credit allowed for that
particular farmer. The large difference between labor and
tractor inputs’ averages indicates that the farmers have
either relied more on abundant labor resource than the use
of tractors, which is relatively expensive or engaged in
minimum tillage practice proposed by experts in recent
years.
The averages for fertilizer, credit and number of
extension visits are 791 kg, N6326.87 and three visits,
357
TECHNICAL INEFFICIENCY ON FARM PRODUCTION / Int. J. Agri. Biol., Vol. 6, No. 2, 2004
suggests that education and awareness are vital variables to
be considered seriously when policy-makers deliberate on
ways to reduce inefficiency among farmers. Most important
are the extension services and the existing technological
packages that need to be critically examined.
respectively. The low level of credit could mean that most
of the farmers under investigation have high school
education, upon which the minimum amount of credit is
usually based. Others are age, education and experience in
years which are 45.1, 8.2 and 8.9, respectively.
Relationship among technical efficiency, inputs used and
farm characteristics. The estimates of marginal effects of
the explanatory variables on technical inefficiency, shown
in Table II were derived after correcting for
heteroscedasticity before which none of the estimated
marginal effects apart from the constant, is significant. The
final results show that the extension visit, college and
university education (with values of 2.06, 8.72 & 11.81%,
respectively) are significant factors influencing technical
efficiency, with only extension visit having a negative
influence, while others have the expected positive influence.
It might be surprising that extension visits have negative
impact on efficiency. This result could be explained by the
fact that extension services in Nigeria in general has not
been effective, especially after the withdrawal of World
Bank funding from the Agricultural Development project
(ADP), which is the main agency responsible for extension
services. Given the problem of inadequate funding of the
extension outfit, dissemination of agricultural innovation to
farmers are done in most cases at wrong periods and more
importantly, farmers do not have access to yield improving
inputs at the right time. Hence, extension visits might not
have expected impact on efficiency.
College and university education that are the most
important among the significant marginal effects would
reduce inefficiency by 8.72 and 11.81% if they increase
100%, respectively. The years of farming experience, tractor
labor ratio and association membership could also reduce
inefficiency while inefficiency could increases with age of
farmers. We however do not have sufficient statistical
evidence to show that they and other classes of education
are relevant in this analysis. The likelihood ratio test,
however, shows that all the explanatory variables are jointly
significant.
REFERENCES
Ajibefun, I.A. and O.A. Abdulkadri, 1999. An Investigation of Technical
Inefficiency of Production of Farmers under the National Directorate
of Employmentin Ondo State, Nigeria. Applied Econ. Letters, 6:
111–4
Arnade, C., 1998. Using a Programming Approach to Measure International
Agricultural Efficiency and Productivity. American J. Agri. Econ.,
49: 67–84
Coelli, T., D.S. Rao and G.E. Battese, 1998. An Introduction to Efficiency
and Productivity Analysis, Kluver Academic Publishers, Norwell,
MC
Färe, R., S. Grosskopf and C.A.K. Lovell, 1985. The Measurement of
Efficiency of Production, Kluwer-Nijhoff Publishers
Farrell, J.J., 1957. The Measurement of Productivity Efficiency. J. Royal
Statistical Soc., Series A, 120: 253–90
Featherstone, M., M. Allen, R. Langemeier, and M. Ismet, 1997. A Nonparametric Analysis of Efficiency for a Sample of Kansas Beef Cow
Farms. J. Agri. and Appl. Econ., 29, 1: 175–84
Greene, H.W., 1995. Limdep User’s Manual, Version 7.0. Econometric
Software, Inc., Maple Av, Bellport, NY: 583–636
Hoppe, R.A., J. Tames, J.E. Perry, K. Penni, E.J. Sommer, T.J. Ryan, C.R.
Greene, D. Ron and J. Monke, 2001. Structural and Financial
Characteristics of U.S. Farms, Family Farm Report. ERS, USDA,
AIB No. 768
Hoppe, R.A., R.C.R. Green, D. Banker, J.Z. Kalbacher and S.E. Bentley,
1996. Structural and Financial Characteristics of U.S. Farms. 18th
Ann. Family Farm Report to Congress. AIB-728. USDA ERS
McDonald, J.F. and R.A. Moffitt, 1980. The Uses of Tobit Analysis. The
Review of Eco. Stat., 62: 318–21
Sall, S., 1997. A Characteristic-Approach to Adoption: The Case of
Improved Rice Varieties in Southern Senegal. Ph.D Dissertation,
Department of Agricultural Economics, Kansas State University,
Manhattan KS, 20–30
Schuh, E. and V. Norton, 1991. Agricultural Research in an International
Policy Context in Transforming Traditional Agriculture. In:
Agricultural Research Policy. Pardey, P., J. Roseboom and J.
Anderson (eds.). Cambridge University Press, New York, USA
Schimmelpfennig, D. and C. Thirtle, 1994. Cointegration and Causality:
Exploring the Relation-ship Between Agricultural R & D and
Productivity. J. Agri. Econ., 45: 220–31
Thirtle, C., D. Hadley and R. Townsend, 1997. Policy Induced Innovation
in Sub-Saharan Agriculture a Multilateral Malmquist Productivity
Index Approach. Working Paper, Department of Agricultural and
Food Economics, The University of Reading, England
Tobin, J., 1958. Estimation of Relationships for Limited Dependent
Variables. Econometrica, 26: 24–36
CONCLUSION
Within the limitations of the data availability, we have
been able to identify and estimate the factors determining
technical efficiency among the farmers that participate in the
National Directorate of Employment program. Among those
factors that have significant impacts on technical efficiency
are extension visit and education. This outcome thus
(Received 15 January 2004; Accepted 26 February 2004)
358
Keep reading this paper — and 50 million others — with a free Academia account
Used by leading Academics

omer emirkadi
Karadeniz Technical University

Gilberto Bercovici
Universidade de São Paulo

Zoltan Bartha
Miskolc University
busayo aderounmu
Covenant University Canaanland, Ota.