GEOMOR-05503; No of Pages 14
Geomorphology xxx (2016) xxx–xxx
Contents lists available at ScienceDirect
Geomorphology
journal homepage: www.elsevier.com/locate/geomorph
Channel response to extreme floods: Insights on controlling factors from six mountain
rivers in northern Apennines, Italy
Nicola Surian a,⁎, Margherita Righini a, Ana Lucía b, Laura Nardi c, William Amponsah d,e, Marco Benvenuti c,
Marco Borga e, Marco Cavalli d, Francesco Comiti b, Lorenzo Marchi d, Massimo Rinaldi c, Alessia Viero d
a
Department of Geosciences, University of Padova, Italy
Faculty of Science and Technology, Free University of Bozen-Bolzano, Italy
Department of Earth Sciences, University of Florence, Italy
d
CNR IRPI, Padova, Italy
e
Department of Land, Environment, Agriculture and Forestry, University of Padova, Italy
b
c
a r t i c l e
i n f o
Article history:
Received 11 May 2015
Received in revised form 30 December 2015
Accepted 2 February 2016
Available online xxxx
Keywords:
Channel widening
Unit stream power
Lateral confinement
Sediment sources
a b s t r a c t
This work addresses the geomorphic response of mountain rivers to extreme floods, exploring the relationships
between morphological changes and controlling factors. The research was conducted on six tributaries of the
Magra River (northern Apennines, Italy) whose catchments were affected by an extreme flood (estimated recurrence interval N 100 years in most of the basins) on 25 October 2011. An integrated approach was deployed to
study this flood, including (i) analysis of channel width changes by comparing aerial photographs taken before
and after the flood, (ii) estimate of peak discharges in ungauged streams, (iii) detailed mapping of landslides
and analysis of their connectivity with the channel network.
Channel widening occurred in 35 reaches out of 39. In reaches with channel slope b 4% (here defined as nonsteep
reaches), average and maximum ratios of post-flood and pre-flood channel width were 5.2 and 19.7 (i.e., channel
widened from 4 to 82 m), respectively. In steep reaches (slope ≥ 4%), widening was slightly less intense
(i.e., average width ratio = 3.4, maximum width ratio = 9.6). The relationships between the degree of channel
widening and seven controlling factors were explored at subreach scale by using multiple regression models. In
the steep subreaches characterized by higher confinement, the degree of channel widening (i.e., width ratio)
showed relatively strong relationships with cross-sectional stream power, unit stream power (calculated
based on pre-flood channel width), and lateral confinement, with coefficients of multiple determination (R2)
ranging between 0.43 and 0.67. The models for the nonsteep subreaches provided a lower explanation of widening variability, with R2 ranging from 0.30 to 0.38; in these reaches a significant although weak relation was found
between the degree of channel widening and the hillslope area supplying sediment to the channels.
Results indicate that hydraulic variables alone are not sufficient to satisfactorily explain the channel response to
extreme floods, and inclusion of other factors such as lateral confinement is needed to increase explanatory capability of regression models. Concerning hydraulic variables, this study showed that the degree of channel widening is more strongly related to unit stream power calculated based on pre-flood channel width than to crosssectional stream power and to unit stream power calculated with post-flood channel width. This could suggest
that most width changes occurred after the flood peak. Finally, in terms of hazard, it is crucial to document the
type and magnitude of channel changes, to identify controlling factors, and most importantly, to develop tools
enabling us to predict where major geomorphic changes occur during an extreme flood.
© 2016 Elsevier B.V. All rights reserved.
1. Introduction
Geomorphic effectiveness of large floods has been long studied and
debated (e.g., Wolman and Miller, 1960; Gupta and Fox, 1974;
Wolman and Gerson, 1978; Magilligan, 1992; Costa and O'Connor,
1995; Phillips, 2002; Kale and Hire, 2004; Thompson and Croke, 2013;
Magilligan et al., 2015). A major issue has been the role of large floods
⁎ Corresponding author.
E-mail address: nicola.surian@unipd.it (N. Surian).
in comparison to more frequent floods with lower magnitude. Several
studies have contributed to developing the concept of effective and formative discharge proposed originally by Wolman and Miller (1960),
pointing out that (i) it may be more appropriate to consider a range of
discharges rather than a single formative discharge (Pickup and
Rieger, 1979; Surian et al., 2009) and (ii) large floods may play a
major role in certain fluvial systems such as steep channels (Johnson
and Warburton, 2002; Lenzi et al., 2006), in ephemeral streams in arid
and semiarid areas (Harvey, 1984; Reid et al., 1998; Hooke and Mant,
2000), and in bedrock channels (Jansen, 2006).
http://dx.doi.org/10.1016/j.geomorph.2016.02.002
0169-555X/© 2016 Elsevier B.V. All rights reserved.
Please cite this article as: Surian, N., et al., Channel response to extreme floods: Insights on controlling factors from six mountain rivers in northern
Apennines, Italy, Geomorphology (2016), http://dx.doi.org/10.1016/j.geomorph.2016.02.002
2
N. Surian et al. / Geomorphology xxx (2016) xxx–xxx
Another major research question concerns the factors controlling
channel response to a large flood event. Most works have focused
mainly on hydraulic variables (e.g., unit stream power, flow duration
above a critical threshold; see Magilligan, 1992; Cenderelli and Wohl,
2003; Kale, 2007; Krapesch et al., 2011; Magilligan et al., 2015) but, as
suggested by Costa and O'Connor (1995), understanding and prediction
of channel and floodplain response to a large flood should incorporate
additional factors. Some works have confirmed that hydraulic forces
may not be sufficient to explain geomorphic effects (e.g., Heritage
et al., 2004; Nardi and Rinaldi, 2015), and consequently, attempts
have been made to include other factors. For instance, human interventions and structures have been considered by Langhammer (2010);
bedload supply and pre-flood channel planform by Dean and Schmidt
(2013); lateral confinement by Thompson and Croke (2013); a bend
stress parameter by Buraas et al. (2014).
This work deals with an extreme flood that occurred in the Magra
River catchment (northern Apennines, Italy) on 25 October 2011. Channel widening, the dominant geomorphic effect of this event along the
channel network, was analyzed in six subcatchments by comparing aerial photographs taken before and after the flood. The working hypothesis was that explanation of geomorphic effects requires models that
include other variables (e.g., lateral confinement, sediment supply) besides hydraulic-related variables (cross-sectional or unit stream
power). The main aim was thus to explore the relationship between
channel widening and a range of controlling factors. Other specific questions addressed were (i) which channel width (i.e., pre- or post-flood
width) should be considered to calculate unit stream power in order
to have a better explanation of channel response?; and (ii) is sediment
supply from hillslopes (i.e., landslides) a key factor driving channel
changes in mountain environments?
We were able to address such questions in relatively small catchments (drainage areas between 8.5 and 38.8 km2) because an integrated approach was deployed to study this flood event (Rinaldi et al.,
2016). Besides the analysis of morphological changes, the approach
includes field measurements coupled to a rainfall-runoff model to estimate peak discharges in the ungauged streams, detailed mapping of
landslides and analysis of sediment connectivity, as well as information
concerning
other
fundamental
aspects
of
the
event
(e.g., sedimentological characterization of flood deposits, dynamics of
large wood transport; Lucía et al., 2015).
2. Study area
2.1. General setting
The Magra River catchment is located in the northern Apennines
(northwestern Italy) and covers an area of 1717 km2, ranging from a
maximum elevation of 1901 m asl to sea level (Ligurian Sea) (Fig. 1).
The catchment is characterized by ridges with a NW-SE direction, associated to thrust faults, which define two main subcatchments: the
Magra (1146 km2) and the Vara (571 km2) subcatchments. The catchment is mainly composed of sedimentary rocks (predominantly sandstones and mudstones), with some outcrops of magmatic (ophiolites)
and metamorphic rocks. The climate is temperate, with dry summers
and most precipitation occurring in autumn. The mean annual precipitation is 1707 mm, reaching maximum values of about 3000 mm in
the upper part of the catchment. The Magra catchment is predominantly forested (about 66% of the whole catchment), while urban
areas are relatively small and mostly located at low elevations.
2.2. The extreme event on 25 October 2011: rainfall distribution and
intensity
Rainfall maps for the study event were obtained based on data collected by the Monte Settepani meteorological radar placed at
1386 m asl on the Apennines, at the border between the Piemonte
and Liguria regions. The radar data were processed for a number of
error sources (Marra et al., 2014) and were merged with rain-gauge
Fig. 1. Location map of the Magra River catchment, the six study catchments, and the study reaches.
Please cite this article as: Surian, N., et al., Channel response to extreme floods: Insights on controlling factors from six mountain rivers in northern
Apennines, Italy, Geomorphology (2016), http://dx.doi.org/10.1016/j.geomorph.2016.02.002
N. Surian et al. / Geomorphology xxx (2016) xxx–xxx
data by using the procedure described by Martens et al. (2013). Because
of the large differences in sampling area, the merging was carried out at
the event temporal scale and then was scaled down to the temporal resolution used for the flood event analysis and the hydrological modelling.
The obtained rainfall estimates show that maximum hourly rates
were up to 149 mm/h, whereas 3-hour maximum and eventaccumulation maxima were up to 326 mm and 500 mm, respectively.
Recurrence intervals up to 300 years were estimated for this event
based on precipitation records. Fig. 2 reports the spatial distribution of
rainfall maxima corresponding to 3-hour rainfall duration over the
Magra River catchment. We selected the 3-hour duration because this
is the duration that best corresponds to the response time of the catchments selected for the analysis, which are characterized by sizes ranging
between 8.5 and 38.8 km2 (Table 1). Basin average event-accumulation
rainfall amounts over the study basins are also reported in Table 1,
showing that all the basins were impacted by high rainfall totals ranging
from 267 (Geriola) to 380 mm (Gravegnola). However, the spatial pattern of the 3-hour rain maxima shows huge differences among the basins, with a maximum over the Pogliaschina and a decreasing gradient
toward the other basins (Fig. 2). This is reflected in the higher value of
the unit peak discharge over the Pogliaschina (Table 1) with respect
to the other basins.
2.3. General characteristics of the six study streams
Six catchments where rainfall was very intense were selected to analyze channel response (Table 1). Teglia, Mangiola, Geriola, and Osca
rivers are tributaries of the Magra River, while Gravegnola and
Pogliaschina rivers of the Vara River (Fig. 1). Unit peak discharge in
these rivers was estimated between 12.8 (Osca) and
23.7 m3 s−1 km−2 (Pogliaschina) (Table 1). The recurrence interval of
the peak discharge has been estimated by comparing the values of
peak discharge (Table 1) with the results of regional equations relating
3
peak discharges to catchment area (Autorità di Bacino interregionale
del Fiume Magra, 2006). In the Teglia and Mangiola rivers the peak discharge is associated to a recurrence interval slightly lower than
200 years. The highest recurrence intervals have been obtained for the
Gravegnola (between 200 and 500 years) and Pogliaschina
(N500 years). The relatively low recurrence interval of the peak discharge in Geriola and Osca (between 30 and 100 years) is consistent
with lower rainfall amounts in these catchments (Table 1).
Streams within the six catchments are characterized by average
channel slope ranging from 4.1% (Osca) to 8.8% (Geriola), coarse sediments (mainly gravels and cobbles), and a wide range of conditions in
terms of lateral confinement, i.e., from highly to poorly confined
reaches. The study reaches correspond to the middle and lower portions
of these rivers, which are characterized by partly confined or unconfined conditions (Fig. 1). In addition to the main stems, some tributaries
of the Gravegnola and Pogliaschina rivers were also analyzed. According
to field observations, intense bedload was widespread in the study
streams during the 25 October 2011 flood, and sediment transport
also occurred as debris flood (Hungr et al., 2001) in some reaches.
3. Methods
An integrated approach was adopted to investigate the geomorphic
effects of the 25 October 2011 flood in the Magra catchment. Analyses of
rainfall, peak discharge, channel changes, depositional features and sediment structures, wood dynamics (Lucía et al., 2015), and sediment
sources were carried out by field surveys, remote sensing, and numerical modelling at different spatial scales (i.e., from catchment to cross
section scale). The whole methodological framework is described in detail by Rinaldi et al. (2016), while in this work we focus on delineation of
spatial units, channel width changes, and potential controlling factors of
channel changes. The estimation of peak discharges — used to calculate
cross-sectional stream power and unit stream power — and analysis of
Fig. 2. The 25 October 2011 event in the Magra River catchment: spatial distribution of rainfall maxima corresponding to three-hour rainfall duration.
Please cite this article as: Surian, N., et al., Channel response to extreme floods: Insights on controlling factors from six mountain rivers in northern
Apennines, Italy, Geomorphology (2016), http://dx.doi.org/10.1016/j.geomorph.2016.02.002
4
N. Surian et al. / Geomorphology xxx (2016) xxx–xxx
Table 1
General characteristics of the six study streams and rainfall and discharge characteristics of the 25 October 2011 flood event (D50 - median diameter of bed sediment; Qpk - estimated peak
discharge; n.a. - not available).
Stream
Drainage area
(km2)
Basin relief
(m)
Stream length
(km)
Channel slope
(%)
D50
(mm)
Total rainfall
(mm)
3-hour maximum
rainfall (mm)
Runoff
ratio
Qpk
(m3 s−1)
Unit Qpk
(m3 s−1 km−2)
Teglia
Mangiola
Geriola
Osca
Gravegnola
Pogliaschina
38.8
26.2
8.5
21.8
34.6
25.1
1035
1012
884
962
1106
625
14.8
12.9
7.2
9.9
12.8
9.1
4.9
6.6
8.8
4.1
7.0
5.6
47–69
41–95
n.a.
44–65
33–79
24–36
335
376
267
243
380
350
116
148
116
125
176
209
0.53
0.57
0.51
0.52
0.62
0.61
538
406
121
279
523
595
13.9
15.5
14.2
12.8
15.1
23.7
sediment sources and of their connectivity with study reaches are also
described. The last part of the methodological section deals with statistical analysis carried out to explain channel response to the flood event,
by exploring the relationships between changes in channel width and
controlling factors.
3.1. Morphological characteristics and delineation of spatial units
The first step of this study included (i) analysis of morphological
characteristics and (ii) delineation of spatial units. This step is crucial
for the subsequent analyses, specifically for a sound interpretation of
channel changes. The material used in this step included orthophotos
with a spatial resolution of 50 cm, topographic maps at 1:5000 scale,
and a digital elevation model (DEM) with a spatial resolution of 10 m.
The analysis was carried out by geographic information system (GIS)
software (ArcGIS 10.2).
The analyzed morphological characteristics were pre-flood channel
areas, alluvial plain areas, lateral confinement, and channel slope. Identification of the pre-flood channel area was straightforward (where
channel width was N 5–6 m) while more difficult for smaller channels
or at locations with dense riparian vegetation. In the latter cases,
photo interpretation was supported by use of the topographic maps to
reduce the degree of uncertainty. Similarly, definition of the alluvial
plain, which includes present floodplain and low terraces (i.e., surfaces
that can be some meters higher than the floodplain and can be infrequently flooded), was not always straightforward (e.g., in narrow valley
bottoms with dense vegetation cover). Alluvial plain was mainly identified using the DEM and topographic maps, while aerial photographs
turned out to be useful where sharp changes in land cover could be
clearly associated to elevation changes (e.g., a change from agricultural
land to forest). As for lateral confinement, three valley settings were differentiated (Brierley and Fryirs, 2005): confined, partly confined, and
laterally unconfined reaches. Lateral confinement was defined by combining two aspects: the degree of confinement, which is the percentage
of channel banks directly in contact with hillslopes or ancient terraces
(Brierley and Fryirs, 2005), and the confinement index, which is defined
by the ratio between the alluvial plain width and the channel width
(Rinaldi et al., 2013). The DEM was employed to estimate channel
slope, as the difference in elevation divided by the planimetric distance
relative to each reach.
Delineation of spatial units was carried out according to the approach proposed by Rinaldi et al. (2013), which is a modification of
the approach by Brierley and Fryirs (2005). According to that approach,
stream sectors were defined as macroreaches having similar characteristics in terms of lateral confinement, while reaches are homogeneous
also in terms of channel morphology (channel pattern, width, slope)
and hydrology. We used the reach scale (reach length was commonly
from 1 to 3 km) for an overall assessment of magnitude of channel
changes and for a preliminary investigation of controlling factors. For a
more accurate analysis of the relation between channel changes and
controlling factors, reaches were divided into subreaches having a constant slope. To identify the proper length of the subreaches (i.e., the
minimum distance with constant slope), the method proposed by
Vocal Ferencevic and Ashmore (2012) was applied. Because DEM
resolution was rather low (10 m), the length of subreaches turned out
to be on the order of 300–500 m.
3.2. Morphological changes: analysis of channel widening
Morphological changes induced by the 2011 flood were assessed by
field surveys and interpretation of aerial photographs. The dominant
process observed in the study reaches was channel widening, which
was analyzed in detail by comparing aerial photographs taken before
and after the flood. Pre-flood orthophotos have a spatial resolution of
50 cm and were taken in 2006 (Gravegnola and Pogliaschina) and
2010 (Teglia, Mangiola, Osca, and Geriola). Because the photos for
Gravegnola and Pogliaschina catchments were taken 5 years before
the flood, we verified them to be representative of the pre-event situation by the inspection of images taken in July 2011 and available
through Google Earth©. Four sets of orthophotos were used to analyze
the post-flood situation. The Gravegnola and Pogliaschina channels
were analyzed with photos taken on 28 October 2011 by the Liguria region (resolution 10 cm) and 28 November 2011 by the Civil Protection
of the Friuli Venezia Giulia (resolution 15 cm). For the other four catchments, we used photos taken on November 2011 by the Toscana region
(resolution 20 cm) and on December 2012 (resolution 30 cm). The latter photos were taken by an ad hoc flight contracted to have full coverage of the study catchments.
To assess changes in channel width, channel banks, and islands
(i.e., in-channel surfaces covered by woody vegetation), these features
were digitized on pre- and post-flood orthophotos. In this work, the
term channel refers to an active channel, which includes low-flow channels and unvegetated or sparsely vegetated bars (i.e., exposed sediments). Channel width was calculated dividing channel area by the
length of the reach or subreach, and changes in channel width were
expressed as a width ratio, i.e., channel width after/channel width before the flood (Krapesch et al., 2011). Estimate of channel width, and
consequently of width ratio, is affected by errors, in particular related
to photo interpretation and digitization. Although rigorous error assessment was not carried out, we judged that, overall, errors are relatively
small in this analysis because (i) images with high spatial resolution
were used and (ii) the magnitude of changes (i.e., width ratio) was
very high in most of the reaches. As mentioned above, larger errors in
channel width estimate could concern the smallest channels or some
reaches where there was a dense vegetation cover.
3.3. Hydraulic analysis: estimates of peak discharge
The flash flood of 25 October 2011 in the Magra River and its tributaries was studied following an approach that encompasses analysis of
rain-gauge data and weather radar observations, post-event surveys
aimed at estimating peak discharge and time evolution of the flood in
ungauged catchments, and model-based consistency check of rainfall
and discharge (Borga et al., 2008). Post-flood assessment of peak discharge was based on the survey of high water marks and crosssectional geometry and computation of flow velocity using the
Manning-Strickler equation under the assumption of uniform flow; for
each cross-section a central (more probable) discharge value was
Please cite this article as: Surian, N., et al., Channel response to extreme floods: Insights on controlling factors from six mountain rivers in northern
Apennines, Italy, Geomorphology (2016), http://dx.doi.org/10.1016/j.geomorph.2016.02.002
N. Surian et al. / Geomorphology xxx (2016) xxx–xxx
assessed, and upper and lower bounds of the estimate were computed.
More details on the procedures applied in post-flood surveys and their
assumptions can be found in Gaume and Borga (2008) and Marchi
et al. (2009). The consistency of rainfall and discharge data was verified
by applying a distributed rainfall-runoff model (Borga et al., 2007). The
hydrological model applied in this study uses a mixed Curve Number–
Green Ampt method (Grimaldi et al., 2013) for rainfall excess modelling. The procedure consists of applying the SCS-CN approach (Ponce
and Hawkins, 1996) to quantify the storm net rainfall total amount
and using this value to estimate the effective saturated hydraulic conductivity of the Green-Ampt method. The model simulates the runoff
propagation by considering distinct hillslope and channel pathways. A
full de Saint Venant model is used to reconstruct the propagation of
the flood wave along the main channels of the Magra and Vara rivers.
5
The rainfall-runoff model was first calibrated at three stream-gauge stations located on the Vara and Magra rivers; calibration parameters were
then transposed to the ungauged catchments where peak discharges
had been estimated by means of post-flood field observations. This enabled a check of the consistency of rainfall and discharge data at the
scale of subcatchments and provided the basis for peak discharge computation at channel reach and subreach scale, as required for the analysis of morphological changes of the study streams.
3.4. Sediment sources, delivery, and connectivity
Sediment supplied from hillslopes to channel network during the
2011 flood derived essentially from landslides. The analysis of sediment
sources was thus carried out by analyzing GIS-based landslide
Table 2
Morphological characteristics, channel width changes, and controlling factors at reach scale.
Wafter
(m)
Wratio
AS
(%)
Qpk
(m3 s−1)
Ω
(W m−1)
ωbefore
(W m−2)
ωafter
(W m−2)
8.9
11.9
11.8
17.7
35.2
60.1
42.7
48.3
4.0
5.1
3.6
2.7
0
0
20
50
457
495
529
538
136,895
116,478
102,567
110,833
15,364
9788
8691
6267
3887
1937
2402
2294
2884
2630
0
0
6.5
8.4
9.7
11.1
6.5
22.2
39.1
34.6
77.3
3.5
5.3
3.5
10
0
0
255
360
402
92,888
173,897
98,493
8353
26,590
4447
2375
5030
1274
10,768
76,650
4958
28
65
107
–
5.5
7.8
10.6
u.c.
6.7
8.2
10.1
18.5
18.7
35.7
49.4
51.1
4.0
4.3
4.9
2.8
0
0
0
0
47
79
106
114
62,952
59,213
49,405
39,425
9356
7180
4901
2128
3371
1658
1001
772
1681
1363
0
0
Steep
Nonsteep
Nonsteep
Nonsteep
39
52
143
135
13.0
16.5
20.6
4.2
3.0
3.1
6.9
32.4
28.8
24.8
25.8
54.4
9.6
7.9
3.7
1.7
0
0
4
0
106
217
268
278
67,084
70,989
66,526
42,924
22,361
22,570
9629
1324
2328
2858
2582
789
7055
4226
312
0
0.121
0.069
0.045
0.172
0.134
0.034
0.023
0.019
Steep
Steep
Steep
Steep
Steep
Nonsteep
Nonsteep
Nonsteep
20
30
208
24
62
42
96
177
2.4
3.6
21.1
2.5
5.8
6.3
7.2
5.0
8.6
8.3
9.5
9.4
10.7
6.6
13.4
35.5
21.2
27.4
88.0
19.6
59.2
29.5
60.0
105.4
2.5
3.3
9.2
2.1
5.5
4.5
4.5
3.0
0
0
0
0
0
0
10
30
56
84
159
53
72
293
449
519
66,855
58,850
70,762
89,299
92,029
95,275
106,600
90,636
7784
7051
7429
9494
8578
14,541
7946
2550
3147
2150
804
4565
1553
3230
1776
860
7496
17,906
764
21,828
4477
27,226
13,718
232
0.026
0.015
0.020
0.004
0.041
0.034
0.068
0.166
0.053
0.026
0.029
0.088
0.044
0.025
0.089
0.068
Nonsteep
Nonsteep
Nonsteep
Nonsteep
Steep
Nonsteep
Steep
Steep
Steep
Nonsteep
Nonsteep
Steep
Steep
Nonsteep
Steep
Steep
35
58
90
137
20
48
18
16
19
39
62
27
26
42
17
29
11.1
15.8
21.8
26.6
6.0
12.5
3.6
2.3
3.2
10.0
20.3
4.0
4.1
5.7
3.0
5.7
3.1
3.7
4.1
5.1
3.3
3.8
5.0
6.8
6.0
3.9
3.0
6.6
6.4
7.3
5.8
7.3
6.9
28.5
81.7
32.3
4.1
7.2
5.0
9.1
14.8
39.0
26.4
7.1
6.4
13.3
5.8
7.3
2.2
7.7
19.7
6.3
1.2
1.9
1.0
1.3
2.5
10.0
8.7
1.1
1.0
1.8
1.0
1.0
10
30
70
40
0
0
0
0
0
0
0
0
0
0
0
0
31
146
188
581
54
61
6
4
118
170
206
34
54
126
11
34
7712
21,732
8952
25,569
29,056
15,675
3752
5538
61,378
43,919
68,978
29,901
25,843
26,126
9837
21,048
2465
5881
2158
4965
8705
4106
757
817
10,306
11,241
22,617
4501
4027
3574
1686
2903
1120
763
110
793
7112
2180
750
607
4134
1125
2611
4200
4027
1959
1686
2883
5085
40,685
1628
0
113
8661
1419
25,354
24,664
18,239
4824
3200
22,449
8827
3843
18,675
L
(m)
S
(m m−1)
Reach
typology
Wpl
(m)
Ci
Wbefore
(m)
2816
1380
1975
374
0.031
0.024
0.020
0.021
Nonsteep
Nonsteep
Nonsteep
Nonsteep
43
97
132
–
4.9
8.2
11.2
u.c.
Mangiola
M2.2
1994
M2.3
3616
M3.1
3600
0.037
0.049
0.025
Nonsteep
Steep
Nonsteep
72
55
215
Geriola
GE1.2
GE1.3
GE2.1
GE3.1
1804
1582
1555
968
0.140
0.077
0.048
0.035
Steep
Steep
Steep
Nonsteep
Osca
O1.2
O1.3
O2.1
O2.2
2227
3296
2543
891
0.064
0.033
0.025
0.016
Gravegnola
CR1.1
1486
CR1.2
1685
CR1.3
1338
SU1.1
1168
SU1.2
646
V1.1
1772
GR1.1
2817
GR2.1
1917
Pogliaschina
P1.1
2008
P1.2
2686
P1.3
461
P2.1
499
PO1.1
492
PO1.2
844
RG1.1
557
SO1.1
742
CN1.1
2567
CN1.2
1188
CN1.4
503
RN1.1
700
RN1.2
1207
RN1.3
1450
B1.1
264
GI1.1
1722
Code
Teglia
T2.3
T3.1
T3.2
T4.1
SS
(m2)
Code - reach identification code (T - Teglia; M - Mangiola; GE - Geriola; O - Osca; CR - Casserola; SU - Suvero; V - Veppo; GR - Gravegnola; P - Pogliaschina; PO - Pogliasca; RG - Redovego;
SO - Sottano; CN - Cassana; RN - Redarena; B - Benoia; GI - Ginepro); L - reach length; S - channel slope; reach typology - steep, reach with slope ≥ 4%; nonsteep, reach with slope b 4%;Wpl width of the alluvial plain; Ci - confinement index (Wpl/Wbefore); Wbefore - channel width before the flood; Wafter - channel width after the flood; Wratio - channel width after the flood/
channel width before the flood; AS - percentage of reach length with artificial structures (e.g., walls, ripraps) preventing lateral mobility; Qpk - peak discharge; Ω - cross-sectional stream
power at the peak discharge; ωbefore - unit stream power calculated based on channel width before the flood (Ω/Wbefore);ωafter - unit stream power calculated based on channel width after
the flood (Ω/Wafter); SS – sediment supply area expressed in terms of landslide area connected with the stream reach.
Note. u.c.: unconfined.
Please cite this article as: Surian, N., et al., Channel response to extreme floods: Insights on controlling factors from six mountain rivers in northern
Apennines, Italy, Geomorphology (2016), http://dx.doi.org/10.1016/j.geomorph.2016.02.002
6
N. Surian et al. / Geomorphology xxx (2016) xxx–xxx
Please cite this article as: Surian, N., et al., Channel response to extreme floods: Insights on controlling factors from six mountain rivers in northern
Apennines, Italy, Geomorphology (2016), http://dx.doi.org/10.1016/j.geomorph.2016.02.002
N. Surian et al. / Geomorphology xxx (2016) xxx–xxx
inventories that were prepared through visual interpretation of digital
aerial photographs taken in different periods: 3 days, 33 days, and
14 months (December 2012) after the event, and of a high-resolution
image (0.5 m) taken by the WorldView II satellite four days after the
event. The satellite image and the post-event aerial photographs cover
almost the entire surface of the Pogliaschina and the Gravegnola basins,
while the complete coverage of the remaining four basins was guaranteed by the aerial photographs collected 14 months after the event.
We visually compared the pre-event orthophotos acquired in 2006
with a satellite image acquired on 20 July 2011, 3 months before the
event, available through Google Earth©. The visual comparison of the
two pre-event images allowed verification that no significant landslide
had occurred in the area between 2006 and the date of the satellite
image (20 July 2011). Anecdotal information confirmed that landslides
did not occur between 20 July 2011 and the October 2011 event. The
orthophotos flown in December 2012 were taken with less favorable
lighting conditions with respect to the other images, making the detection and mapping of the landslides more difficult and locally less accurate. Furthermore, snow cover, natural soil erosion from landslide
scars, and artificial sediment removal occurred between the rainfall
event and the date of the orthophotos, obliterating partially or
completely some of the soil slips and the landslide deposits. Because
of the different quality of images, the photointerpretation was focused
on three types of shallow landslides recognizable in all available images:
(i) translational slides, (ii) earth flows (including also some debris flow
phenomena), and (iii) rotational slides (Mondini et al., 2014). Field surveys on landslide sites allowed us to validate the obtained inventories.
In order to evaluate which sediment source areas were effectively
coupled to the studied reaches of the channel network (i.e., areas responsible for sediment supply), a geomorphometric analysis of sediment connectivity was carried out. In each catchment, a map of
sediment connectivity was derived by calculating the sediment connectivity index (IC, Cavalli et al., 2013) using the SedInConnect tool (Crema
et al., 2015). The IC, originally developed by Borselli et al. (2008), is a
distributed GIS-based index mainly focused on the influence of topography on sediment connectivity and aiming at representing the linkage
between different parts of the catchment (i.e., hillslopes and features
of interest such as catchment outlet, main channel network or a given
cross section along the channel). The IC is defined by the logarithm of
the ratio between an upslope and a downslope component expressing,
respectively, the potential for downward routing of the sediment produced upslope and the sediment flux path length to the nearest target
or sink. A weighting factor appears in both components of IC to model
the impedance to runoff and sediment fluxes. More details can be
found in Cavalli et al. (2013). In this study, IC was applied to evaluate
the potential connection between hillslopes and the studied reaches.
In the IC calculation, Manning's n roughness coefficient, assigned according to different land use types, was used as a weighting factor.
The resulting IC maps were used as a support for the removal of
decoupled sediment source areas from the total inventory. This operation was then checked by visually inspecting post-event orthophotos.
Finally, the variable expressing the sediment supply from the hillslopes
to the studied subreaches was computed by summing all the areas of
the sediment sources connected to each subreach in the six basins.
3.5. Analysis of controlling factors
Analysis of controlling factors was carried out at the subreach scale,
taking into account four geomorphic and three hydraulic factors. The
geomorphic factors were channel slope as a proxy of stream morphology (see e.g., Montgomery and Buffington, 1997); confinement index,
which represents the width of the alluvial plain and a natural constraint
to channel widening; artificial structures that may hinder channel
7
lateral mobility; sediment-supply area, in terms of landslide areas effectively coupled to the main channel network. Stream energy was analyzed taking into account three hydraulic variables closely related to
flood power: cross-sectional stream power (W m−1) defined as Ω =
γQS, where γ is the specific weight of water (N m−3), Q is the discharge
(m3 s−1), and S is channel slope; unit stream power (W m−2) obtained
by dividing cross-sectional stream power by channel width measured
before and after the flood (ωbefore = Ω / Wbefore and ωafter = Ω / Wafter).
Hence statistical analysis was performed considering seven geomorphic
and hydraulic variables but taking into account separately independent
variables related to stream energy (i.e., channel slope, cross-sectional
stream power, unit stream power). Least squares multiple regression
analysis was used to investigate which set of variables gave the best explanation of channel response (i.e., channel widening). Software
STATGRAPHICS centurion XVI (version 16.2.4) was used for all statistical analyses.
4. Results
4.1. Morphological changes at the reach scale
In this section the morphological characteristics of the study streams
and channel changes that took place during the 25 October 2011 flood
are illustrated at the reach scale. The aim of this section is to show the
magnitude of changes and analyze some of the possible factors that
could play a role in the geomorphic response of stream channels. A
more accurate analysis of controlling factors was carried out at subreach
scale, as described further in the paper.
Following the delineation procedure described above, stream sectors and reaches were defined in the six catchments. Then, only the
partly confined and unconfined reaches were considered for the following morphological analysis (i.e., analysis of changes in channel width)
(see study reaches in Fig. 1). The minimum, average, and maximum
length of the 39 study reaches is 264, 1573, and 3616 m, respectively
(Table 2). All these reaches display typical characteristics of mountain
streams and cover relatively wide ranges in terms of channel slope,
channel width, and lateral confinement. Channel slope varies between
0.4% and 17.2%, with 5.3% being the average of the 39 reaches; channel
width ranges from 3 to 36 m, being 9 m on average; confinement index
ranges from 2.3 to 26.6 (Table 2). Considering such a range of morphological characteristics, and specifically the variability in channel slope,
the whole data set was analyzed considering two subsets: the first including reaches with a slope b 4% (hereafter called nonsteep reaches),
and the second with reaches having slope ≥ 4% (steep reaches). The
two subsets consist of 21 and 18 reaches, respectively. The selection of
such threshold stems from a widely accepted definition of steep channels, characterized as sediment supply-limited and with stepped morphology, as those having slopes higher than ~3–5% (Montgomery and
Buffington, 1997; Comiti and Mao, 2012).
Channel widening occurred in 35 reaches, while no significant
change in channel width was detected only in 4 reaches (see width ratios in Table 2). In the subset of nonsteep reaches, the minimum, average, and maximum width ratio was 1.7, 5.2, and 19.7 respectively.
Most intense changes occurred along the Pogliaschina River (reach
P1.3) where the channel widened from 4.1 up to 81.7 m (Table 2,
Fig. 3). Although there were several artificial structures along this
reach (i.e., along 70% of the reach), in several sites the channel took up
the whole alluvial plain, and locally, widening of the alluvial plain occurred by the erosion of valley slopes (Fig. 3D). Fig. 3 shows two reaches
of the Teglia River (the downstream part of reach T3.2 and the short, unconfined reach T4.1) where widening was less intense (width ratio was
3.6 and 2.7 in T3.2 and T4.1, respectively). Artificial structures (along
20% and 50% of T3.2 and T4.1, respectively) had some effect in these
Fig. 3. Pre- and post-flood aerial photographs showing morphological changes along nonsteep reaches of the Teglia River (A and B), reaches T3.2 and T4.1, and Pogliaschina River (C and D),
reach P1.3. Refer to Table 2 for more information about morphological characteristics and channel width changes in these reaches.
Please cite this article as: Surian, N., et al., Channel response to extreme floods: Insights on controlling factors from six mountain rivers in northern
Apennines, Italy, Geomorphology (2016), http://dx.doi.org/10.1016/j.geomorph.2016.02.002
8
N. Surian et al. / Geomorphology xxx (2016) xxx–xxx
Please cite this article as: Surian, N., et al., Channel response to extreme floods: Insights on controlling factors from six mountain rivers in northern
Apennines, Italy, Geomorphology (2016), http://dx.doi.org/10.1016/j.geomorph.2016.02.002
N. Surian et al. / Geomorphology xxx (2016) xxx–xxx
cases as shown by sharp changes in the degree of widening along the
two reaches.
In the 18 reaches characterized by steep slopes, the minimum, average, and maximum width ratio was 1.0, 3.4, and 9.6, respectively. There
are no artificial structures along these reaches, but the presence of narrow alluvial plains was likely a limiting factor for channel widening.
Some reaches, e.g., GE1.2, CR1.2, SU1.1, were characterized by relatively
moderate or low width ratios, 4.0, 3.3, and 2.1, respectively; but such ratios approximate their confinement index values, meaning that channel
widening took up most of the alluvial plain (Table 2). Two examples of
widening along steep channels are shown in Fig. 4. The first example refers to the Suvero River (tributary of the Gravegnola River): in reach
SU1.2 (slope = 13%) the channel widened from 10.7 up to 59.2 m
(width ratio = 5.5), took up almost completely the alluvial plain and, locally, eroded significant portions of the valley slopes (Fig. 4D). The other
example refers to the Geriola River where in reach GE1.3 (slope = 7.7%)
widening was slightly less intense than in the Suvero (i.e., from 8.2 to
35.7 m; width ratio = 4.3) but still with local erosion of valley slopes
(Fig. 4B).
4.2. Estimate of peak discharge
Post-flood field estimates of peak discharge were carried out in five
out of the six studied catchments: one cross section was surveyed in the
Mangiola and Teglia rivers (in both catchments close to basin outlet),
two in the Osca and Gravegnola, and six in the Pogliaschina. Only in
Geriola were no cross sections found suitable for recognition of high
water marks and topographic survey because of major channel changes
caused by the flood. The agreement of model-computed peak discharges with post-flood estimates can be deemed rather satisfactory,
with 9 out of 12 cross sections lying within the range of discharges
resulting from the computation based on field surveys. Modelcomputed discharges were then used in the analysis of the factors controlling morphological changes in the studied channels. This was done
by applying the rainfall runoff model at multiple cross sections located
at the end of each investigated channel reach and subreach (Table 2).
In the Teglia River, ~75% of the basin area lies upstream of a dam for hydroelectric power production; peak discharge in the investigated
reaches, which are located downstream of the dam, was assessed by
summing the outflow from the dam to the model-computed discharge
of the interbasin downstream of the dam.
Estimates of peak discharge, cross-sectional stream power, and unit
stream power at the reach scale are reported in Table 2. Peak discharge
ranged from 4 m3 s−1 (Sottano River, a small tributary of Pogliaschina
River) to 595 m3 s− 1 (Pogliaschina River). Cross-sectional stream
power varied between 7712 and 136,895 W m− 1 in the nonsteep
reaches and between 3752 and 173,897 W m−1 in the steep reaches.
Unit stream power calculated using channel width before the flood
ranged between 757 and 26,590 W m− 2, while that calculated using
post-flood channel width ranged between 110 and 7112 W m−2. Notably, in most of the reaches unit stream power largely exceeded the
threshold value of 300 W m−2 that Magilligan (1992) and later other researchers referred to for differentiating reaches where major geomorphic changes occurred from those reaches where changes were more
limited.
4.3. Sediment sources, delivery, and connectivity
The sediment source inventory compiled through photointerpretation in the six catchments featured 1196 landslides for a total surface
of about 917,000 m2, which represents 0.6% of the study area
(Table 3). Pogliaschina and Gravegnola catchments show the highest
number of mapped landslides. This result is attributable mainly to the
9
Table 3
Summary results of the inventory of all landslides in catchments and landslides coupled to
the study reaches according to sediment-connectivity analysis.
Catchment
Teglia
Mangiola
Geriola
Osca
Gravegnola
Pogliaschina
a
All landslidesa
Coupled landslides
No.
Surface (m2)
No.
Surface (m2)
186
157
33
125
257
438
133,070
151,322
16,054
67,589
206,232
342,585
10
42
7
21
100
189
7345
92,377
5508
12,593
99,189
213,384
Percentage of
coupled landslides
5.5
61
34.3
18.6
48.1
62.3
Initial inventory not considering the soil slip class.
extreme intensity of the rainfall (Fig. 2) and the resultant flood
(Table 1) in these two basins, but also to the higher quality of the available orthophotos in terms of spatial resolution and date of acquisition
than to data sets available for the other four catchments. Among the analyzed landslide types, earth flow is the most represented class, with
percentages ranging from 66% to 86% of the individual landslide inventories. The remaining sediment sources are mainly translational landslides, while the rotational landslide class represents b2% of the cases.
The total sediment source inventory was filtered to limit the inventory to the landslides effectively contributing to sediment supply in the
study reaches (Table 3) by assessing the sediment-connectivity pattern
using the index of connectivity (Cavalli et al., 2013). Fig. 5 illustrates the
adopted criteria for selecting the landslides coupled to the study
reaches. Notably, even if all the mapped slope instabilities (red polygons
in Fig. 5A) are located very close to the analyzed channel network, most
of these features in Fig. 5B are characterized by low values of IC (i.e., low
connectivity) due to the gentle local slope and to the land use type that
favor sediment storage. Conversely, the two landslides classified as
coupled are well-linked to the stream network as can be observed on
the orthophoto (Fig. 5A) and are characterized by medium values of
IC, very close to high values of IC (hot colors in Fig. 5B). The connectivity
analysis allowed us to reduce the initial inventory by about 62%, with
the highest reduction (by around 94.5%) for the Teglia basin where
the presence of a dam in the catchment significantly reduced the former
mapped landslides (Table 3). Excluding all the sediment sources upstream of the dam, only 10 landslides with a total area of about
7345 m2 were coupled to the stream reaches.
Among all the analyzed stream reaches, SO1.1, RN1.2 in the
Pogliaschina, M2.3 in the Mangiola, and SU 1.1 in the Gravegnola
(Table 2) feature the highest value of sediment supply per unit channel
length (34.2, 18.6, 21.2, and 18.7 m2 m− 1, respectively), and several
reaches in the Pogliaschina and in the Gravegnola exceed the value of
10 m2 m−1. We also note that about 60% of the total sediment sources
appear to be connected to the studied reaches in the Mangiola and
Pogliaschina catchments (Table 3).
4.4. Analysis of controlling factors
The relationships between the degree of channel widening and possible controlling factors were explored using multiple regression analysis. The analysis was carried out for the widening (i.e., width ratio) at
subreach scale. The whole data set includes 157 subreaches, with a minimum, average, and maximum length of 157, 392, and 630 m, respectively. Seven controlling variables were considered (i.e., confinement
index, percentage of reach length with artificial structures, sedimentsupply area, channel slope, cross-sectional stream power, and unit
stream power calculated using pre-flood and post-flood channel
width), but each regression model incorporated only three to four variables. Each model included only one of the variables expressing
Fig. 4. Pre- and post-flood aerial photographs showing morphological changes along steep reaches of the Geriola River (A and B), reach GE1.3, and Suvero River (C and D), reach SU1.2.
Refer to Table 2 for more information about morphological characteristics and channel width changes in these reaches.
Please cite this article as: Surian, N., et al., Channel response to extreme floods: Insights on controlling factors from six mountain rivers in northern
Apennines, Italy, Geomorphology (2016), http://dx.doi.org/10.1016/j.geomorph.2016.02.002
10
N. Surian et al. / Geomorphology xxx (2016) xxx–xxx
Fig. 5. Example of the sediment connectivity analysis carried out to limit the initial sediment source inventory to landslides effectively coupled to the study reaches. (A) The initial
inventory superimposed on an orthophoto. (B) Coupled and decoupled landslides according to the analysis of the sediment connectivity map. The IC is the sediment connectivity
index (see the text for more details). (For interpretation of the references to color in this figure, the reader is referred to the web version of this article.)
potential or flood flow energy (i.e., channel slope, cross-sectional
stream power, unit stream power).
The first analysis was carried out on the whole data set. All four multiple regression models turned out to be significant (p b 0.001) and gave
moderate coefficients of multiple determination (R2 and adjusted R2
ranged between 0.36 and 0.51 and between 0.35 and 0.50, respectively)
(Table 4). The best model was the one including unit stream power calculated based on pre-flood channel width and confinement index as explanatory variables (model 3 in Table 4).
To achieve a better understanding of controlling factors, the data set
was split into two subsets using the same criteria as adopted for the
analysis at reach scale (i.e., nonsteep and steep subreaches, based on
the 4% threshold). Therefore, multiple regressions were carried out on
one subset including 89 nonsteep subreaches and a second one including 68 subreaches with steep slope. Percentage of reach length with artificial structures was not taken into account for the steep subreaches
because only 1 subreach out of 68 has some structures.
All four multiple regression models for the nonsteep subreaches
turned out to be significant (p b 0.001) and gave moderate coefficients
of multiple determination (R2 and adjusted R2 ranged between 0.30
and 0.38 and between 0.27 and 0.36, respectively) (Table 5). The best
model including unit stream power calculated based on pre-flood channel width (R2 = 0.38 and adjusted R2 = 0.36) has the following equation:
Wratio ¼ −0:719 þ 0:174 ωbefore þ 0:292 Ci þ 0:275 AS þ 0:026
SS
ð1Þ
where Wratio is the ratio of channel width after the flood/channel width
before the flood, ωbefore is the unit stream power calculated based on
pre-flood channel width (W m−2), Ci is the confinement index, AS is
the percentage of reach length with artificial structures, and SS is the
sediment supply area (m2).
The variable being the best predictor of width ratio was confinement
index (R2 = 0.23; significant in all four regression models). Significant
relationships, although with very low R2 values, were also found for
the rate of sediment supply (R2 = 0.07) and for unit stream power calculated in the two ways (R2 = 0.14 and R2 = 0.12, using pre-flood and
Table 4
Multiple regression models between width ratio and controlling factors for the whole data set (157 subreaches).
Model 1
Model 2
2
R = 0.36
R2adj = 0.35
p-value b 0.001
Ci
Percentage of reach length with artificial structures
Sediment supply area
Channel slope
Ω (W m−1)
ωbefore (W m−2)
ωafter (W m−2)
Model 3
2
Model 4
2
R = 0.46
R2adj = 0.45
p-value b 0.001
R2 = 0.37
R2adj = 0.35
p-value b 0.001
R = 0.51
R2adj = 0.50
p-value b 0.001
R2
p-value
R2
p-value
R2
p-value
R2
p-value
0.33
0.04
8.07E−05
0.03
–
–
–
b0.001
0.696
0.008
0.696
–
–
–
0.33
0.04
8.07E−05
–
0.07
–
–
b0.001
0.195
b0.001
–
b0.001
–
–
0.33
0.04
8.07E−05
–
–
0.23
–
b0.001
0.051
0.016
–
–
b0.001
–
0.33
0.04
8.07E−05
–
–
–
0.09
b0.001
0.748
0.031
–
–
–
0.024
Please cite this article as: Surian, N., et al., Channel response to extreme floods: Insights on controlling factors from six mountain rivers in northern
Apennines, Italy, Geomorphology (2016), http://dx.doi.org/10.1016/j.geomorph.2016.02.002
N. Surian et al. / Geomorphology xxx (2016) xxx–xxx
11
Table 5
Multiple regression models for the relationships between width ratio and controlling factors for the nonsteep subreaches.
Ci
Percentage of reach length with artificial structures
Sediment supply area
Channel slope
Ω (W m−1)
ωbefore (W m−2)
ωafter (W m−2)
Model 1
Model 2
Model 3
Model 4
R2 = 0.30
R2adj = 0.27
p-value b 0.001
R2 = 0.34
R2adj = 0.30
p-value b 0.001
R2 = 0.38
R2adj = 0.36
p-value b 0.001
R2 = 0.37
R2adj = 0.33
p-value b 0.001
R2
p-value
R2
p-value
R2
p-value
R2
p-value
0.23
0.05
0.07
0.01
–
–
–
b0.001
0.481
0.006
0.756
–
–
–
0.23
0.05
0.07
–
1.33E−06
–
–
b0.001
0.203
0.001
–
0.042
–
–
0.23
0.05
0.07
–
–
0.14
–
b0.001
0.085
0.013
–
–
0.001
–
0.23
0.05
0.07
–
–
–
0.12
b0.001
0.997
0.006
–
–
–
0.005
post-flood channel width, respectively). The relationships with percentage of reach length with artificial structures, channel slope, and crosssectional stream power were weak or very weak and were statistically
not significant (p N 0.05).
The four multiple regression models for the subset of steep
subreaches were significant (p b 0.001) and gave higher coefficients of
multiple determination than those obtained for the nonsteep
subreaches (R2 and adjusted R2 ranged between 0.43 and 0.67 and between 0.41 and 0.65, respectively) (Table 6). The best model including
unit stream power calculated based on pre-flood channel width
(R2 = 0.67 and adjusted R2 = 0.65) has the following equation:
Wratio ¼ −2:118 þ 0:317 ωbefore þ 0:366 Ci þ 0:004 SS
increased following a non-linear function (Fig. 6E). In nonsteep
subreaches, unit stream power also was the most important predictor
among hydraulic variables, but its relation with the degree of channel
widening was much weaker (R2 = 0.23) (Fig. 6B). Notably, the most intense channel widening (width ratio up to 20) that occurred in the
Pogliaschina and Gravegnola catchments is not associated to the highest
values of unit stream power (Fig. 6B). Hence, most interesting, the plots
of Fig. 6 showed that the relationships between width ratio and controlling factors are not linear. This helps to explain why multiple regression
models, which rely on linear relations, did not have very high coefficients of multiple determination (adjusted R2 were 0.36 and 0.65,
respectively).
ð2Þ
5. Discussion and conclusions
where Wratio is the ratio of channel width after the flood/channel width
before the flood, ωbefore is the unit stream power calculated based on
pre-flood channel width (W m−2), Ci is the confinement index, and SS
is the sediment supply area (m2).
The width ratio showed clear relationships with three variables:
confinement index (R2 = 0.43), cross-sectional stream power (R2 =
0.44), and unit stream power calculated based on pre-flood channel
width (R2 = 0.50). In turn, the relationships with the three other variables (sediment-supply area, channel slope, and unit stream power calculated based on post-flood channel width) were weak and statistically
not significant (p N 0.05).
To explore further results of the multiple regression models, we examined the controlling factors of the two best models (i.e., model 3 for
the nonsteep and steep subreaches, see Tables 5 and 6) by estimating
simple regression models (Fig. 6). Simple regression analyses confirmed
that confinement index and unit stream power (using pre-flood channel width) are the best explanatory variables, for the nonsteep and
steep channels. Width ratio was more clearly related to confinement
index in steep subreaches (R2 = 0.53) (Fig. 6D) than in nonsteep
subreaches (R2 = 0.32) (Fig. 6A). In steep subreaches, unit stream
power — being the most important predictor among hydraulic variables — explained 52% of the degree of channel widening, which
5.1. Regression models and controlling factors
Results confirmed the main hypothesis of this work that hydraulic
variables alone are not sufficient to explain channel response to an extreme flood event. The inclusion of other factors, specifically lateral confinement, channel slope, hillslope sediment supply, and percentage of
reach length with artificial structures, led to satisfactory models
explaining the observed variability in the degree of channel widening.
Differences between the two sets of subreaches (with nonsteep and
steep slopes) appeared in terms of overall explanatory capability of
the models and most significant explanatory variables.
In the steep (≥ 4%) subreaches, which were characterized also by
higher confinement, channel widening occurred mainly through lateral
erosion and, as confirmed also by field observations, depositional processes were less significant. In these subreaches, cross-sectional stream
power, unit stream power (calculated based on pre-flood channel
width), and lateral confinement showed good relationships with the
degree of channel widening (i.e., width ratio) and significant statistical
models were obtained (Table 6, Fig. 6). These results suggest that the
widening process is essentially controlled by two factors: flood power
and valley confinement. Notably, flood duration above a critical
Table 6
Multiple regression models for the relationships between width ratio and controlling factors for the steep subreaches.
Model 1
Model 2
2
R = 0.44
R2adj = 0.42
p-value b 0.001
Ci
Sediment supply area
Channel slope
Ω (W m−1)
ωbefore (W m−2)
ωafter (W m−2)
Model 3
2
Model 4
2
R = 0.65
R2adj = 0.64
p-value b 0.001
R2 = 0.43
R2adj = 0.41
p-value b 0.001
R = 0.67
R2adj = 0.65
p-value b 0.001
R2
p-value
R2
p-value
R2
p-value
R2
p-value
0.43
0.06
0.02
–
–
–
b0.001
0.925
0.295
–
–
–
0.43
0.06
–
0.44
–
–
b0.001
0.65
–
b0.001
–
–
0.43
0.06
–
–
0.50
–
b0.001
0.751
–
–
b0.001
–
0.43
0.06
–
–
–
0.02
b0.001
0.813
–
–
–
0.704
Please cite this article as: Surian, N., et al., Channel response to extreme floods: Insights on controlling factors from six mountain rivers in northern
Apennines, Italy, Geomorphology (2016), http://dx.doi.org/10.1016/j.geomorph.2016.02.002
12
N. Surian et al. / Geomorphology xxx (2016) xxx–xxx
threshold (e.g., related to bedload transport) was not included in our
analysis, but it is a variable that very likely would increase the robustness of regression models in these subreaches (Costa and O'Connor,
1995; Magilligan et al., 2015). Unfortunately, data on thresholds for
bedload transport are not available for the study streams, neither are
grain size distributions for all the analyzed reaches.
The models obtained for the nonsteep subreaches, compared to the
steep subreaches, are less satisfactory as they provide a lower
explanation of widening variability. Besides, the degree of channel widening showed relatively weak relationships with all the significant explanatory variables (i.e., lateral confinement, sediment supply area,
unit stream power; Table 5, Fig. 6). These results suggest that widening
at the lower slopes and with less confined channels is a more complex
process and that additional factors should be considered to better understand geomorphic response in these reaches. Likely, widening in
these cases results from a combination of bar formation and lateral
Fig. 6. Simple regression models between width ratio and controlling factors. Only significant factors of the two best models obtained by multiple regression analysis (see Tables 5 and 6)
are shown: (A), (B), and (C) refer to nonsteep subreaches; (D) and (E) to steep subreaches. In (A) and (D) the dashed lines represent the 1:1 relationship.
Please cite this article as: Surian, N., et al., Channel response to extreme floods: Insights on controlling factors from six mountain rivers in northern
Apennines, Italy, Geomorphology (2016), http://dx.doi.org/10.1016/j.geomorph.2016.02.002
N. Surian et al. / Geomorphology xxx (2016) xxx–xxx
erosion, with sediment (volumes and size) supplied from landslides and
upstream reaches becoming significant. Notable bar formation and
channel aggradation were observed in several of these reaches
(Rinaldi et al., 2016), and repeated avulsion processes might have occurred during the event in these aggrading subreaches. As to additional
factors, large riparian trees coupled to wood jams could have played a
role by occasionally reinforcing banks and, therefore, hampering channel widening.
5.2. Unit stream power and geomorphic response
The analysis carried out in the six subcatchments of the Magra River
basin showed that unit stream power calculated based on pre-flood
channel width has stronger relations with channel widening in comparison to unit stream power calculated based on post-flood channel width
and to cross-sectional stream power. Because peak discharge was used
for stream power calculation, we are aware that neither pre-flood nor
post-flood channel width is actually appropriate for the estimation of
unit stream power, as the most appropriate would be the (unknown)
width at the flood-peak time. The fact that using the pre-flood width
gives better relations with the degree of channel widening (i.e., width
ratio) could suggest that most width changes occurred after the flood
peak. This hypothesis is supported by a video that allowed flood reconstruction along one reach of the Mangiola River (the video documents
channel changes during the whole flood event; see Rinaldi et al., 2016,
for more details). Statistical analyses and the video on the Mangiola
River are not sufficient to validate the hypothesis that most channel
widening took place after the flood peak, but the results of this work
show clearly that using unit stream power based on post-flood width
is not effective to explain geomorphic response, at least in streams
that underwent intense widening in terms of width ratio.
5.3. The role of sediment supply in channel response
Some previous works (e.g., Harvey, 2001; Sloan et al., 2001) pointed
out that sediment supply from hillslopes was a major driving factor of
channel response during extreme flood events. On the other hand, examples also show that landslides, although coupled with channel network, may have minor effects on channel processes (e.g., Milan,
2012). The detailed landslide inventory and the analysis of sediment
connectivity allowed us to assess the extent to which sediment supply
from hillslopes influenced channel response in the six study catchments. It is worth clarifying that we only assessed sediment source
areas, without an estimation of the involved volume that would require
a rather uncertain estimation of landslide thickness. Moreover, once a
landslide was considered to be coupled to the study reaches, its entire
area was assumed to contribute to sediment supply without taking
into account that part of the landslide material, especially in channelized earth flows, could be blocked by large wood (Lucía et al., 2015).
In the steep reaches, although notable sediment sources were coupled
with some reaches (see Table 2), no significant relation was found between the degree of channel widening and the hillslope area supplying
sediment to the channels. Likely, freshly-eroded colluvium was transferred to downstream reaches given the typical supply-limited conditions of high-energy channels, or remained stored in the smallest
tributaries before entering the main channels.
In the nonsteep reaches, a significant although weak relation was
found (Table 5 and Fig. 6C). This would suggest that during the flood a
redistribution of the material stored in the alluvial plains was likely
the dominant process, whereas the contribution of material from
hillslopes was relevant only at specific sites and was thus not reflected
in the analysis of the whole data set, which included 89 nonsteep
subreaches. Notably, remarkable channel widening (i.e., width ratio
up to 6) also took place along several subreaches that received no sediment input from landslides (Fig. 6C).
13
5.4. Practical implication for river management and risk mitigation
Although the six study catchments are not densely populated, the 25
October 2011 flood caused severe damages to infrastructures, specifically to roads and bridges, and loss of lives. Such catastrophic effects of
the flood mainly reflected channel dynamics (i.e., bank erosion, bed aggradation, channel avulsion, intense transport of large wood) or inundation processes caused or enhanced by bridge clogging due to large
wood. Therefore, in terms of hazard, documenting the type and magnitude of channel response is crucial in identifying controlling factors of
such response and in developing tools to enable channel dynamic predictions. Recently, Buraas et al. (2014) stated that there is still a general
lack in the capability to predict where major geomorphic changes take
place during an extreme flood event. In this respect, the regression
models and other outcomes of this study can be used to predict the degree of channel widening and to support planning along river corridors
through hazard mapping. For instance, the 2011 flood showed that in
steep, relatively confined mountain reaches the whole, relatively narrow, alluvial plain may undergo major geomorphic changes, which are
effectively explained by regression models that include lateral confinement and unit stream power. This study pointed out that in nonsteep
reaches predicting the degree of channel widening is more uncertain
and that risk mitigation may not rely only on protection structures
that can be partly effective during extreme floods in mountain
environments.
Acknowledgements
The Basin Authority of the Magra River, the Hydrological Service of
Regione Toscana, and the Environmental Agency of Regione Liguria
are acknowledged for providing hydrological and other essential data.
Fondazione CARIPARO and CNR IRPI are gratefully acknowledged for
funding M. Righini and W. Amponsah PhD fellowships, respectively.
Project TRUMPS, funded by Autonomous Province of Bolzano, supported part of this research. We thank B. Wyżga and the two anonymous reviewers for their comments and very helpful suggestions.
References
Autorità di Bacino interregionale del Fiume Magra, 2006. Piano stralcio “Assetto
Idrogeologico” del bacino del Fiume Magra e del Torrente Parmignola – Relazione
Generale. Unpublished report, 209 p. (http://www.adbmagra.it/), Sarzana (Italy)
(in Italian).
Borga, M., Boscolo, P., Zanon, F., Sangati, M., 2007. Hydrometeorological analysis of the
August 29, 2003 flash flood in the eastern Italian Alps. J. Hydrometeorol. 8 (5),
1049–1067.
Borga, M., Gaume, E., Creutin, J.D., Marchi, L., 2008. Surveying flash floods: gauging the
ungauged extremes. Hydrol. Process. 22 (18), 3883–3885.
Borselli, L., Cassi, P., Torri, D., 2008. Prolegomena to sediment and flow connectivity in the
landscape: a GIS and field numerical assessment. Catena 75 (3), 268–277.
Brierley, G.J., Fryirs, K.A., 2005. Geomorphology and River Management: Applications of
the River Style Framework. Blackwell, Oxford, p. 398.
Buraas, E.M., Renshaw, C.E., Magilligan, F.J., Dade, W.·.B., 2014. Impact of reach geometry
on stream channel sensitivity to extreme floods. Earth Surf. Process. Landf. 39,
1778–1789.
Cavalli, M., Trevisani, S., Comiti, F., Marchi, L., 2013. Geomorphometric assessment of spatial sediment connectivity in small Alpine catchments. Geomorphology 188, 31–41.
Cenderelli, D.A., Wohl, E.E., 2003. Flow hydraulics and geomorphic effects of glacial-lake
outburst floods in the Mount Everest region, Nepal. Earth Surf. Process. Landf. 28,
385–407.
Comiti, F., Mao, L., 2012. Recent advances in the dynamics of steep channels. In: Church,
M., Biron, P.M., Roy, A.G. (Eds.), Gravel-bed Rivers: Processes, Tools. Wiley, Environments. Chichester, pp. 353–377.
Costa, J.E., O'Connor, J.E., 1995. Geomorphically effective floods. In: Costa, J.E., Miller, A.J.,
Potter, K.·.W., Wilcock, P. (Eds.), Natural and Anthropogenic Influences in Fluvial
GeomorphologyMonograph 89. American Geophysical Union, Washington, D.C.,
pp. 45–56.
Crema, S., Schenato, L., Goldin, B., Marchi, L., Cavalli, M., 2015. Toward the development of
a stand-alone application for the assessment of sediment connectivity. Rend. Online
Soc. Geol. Ital. 34, 58–61.
Dean, D.J., Schmidt, J.C., 2013. The geomorphic effectiveness of a large flood on the Rio
Grande in the Big Bend region: insights on geomorphic controls and post-flood geomorphic response. Geomorphology 201, 183–198.
Please cite this article as: Surian, N., et al., Channel response to extreme floods: Insights on controlling factors from six mountain rivers in northern
Apennines, Italy, Geomorphology (2016), http://dx.doi.org/10.1016/j.geomorph.2016.02.002
14
N. Surian et al. / Geomorphology xxx (2016) xxx–xxx
Gaume, E., Borga, M., 2008. Post-flood field investigations in upland catchments after
major flash floods: proposal of a methodology and illustrations. J. Flood Risk
Manag. 1 (4), 175–189.
Grimaldi, S., Petroselli, A., Romano, N., 2013. Green-Ampt Curve-Number mixed procedure as an empirical tool for rainfall-runoff modelling in small and ungauged basins.
Hydrol. Process. 27 (8), 253–264.
Gupta, A., Fox, H., 1974. Effects of high magnitude floods on channel form: a case study in
the Maryland Piedmont. Water Resour. Res. 10, 499–509.
Harvey, A.M., 1984. Geomorphological response to an extreme flood: a case from Southern Spain. Earth Surf. Process. Landf. 9, 267–279.
Harvey, A.M., 2001. Coupling between hillslopes and channels in upland fluvial systems:
implications for landscape sensitivity, illustrated from the Howgill Fells, northwest
England. Catena 42, 225–250.
Heritage, G.L., Large, A.R.G., Moon, B.·.P., Jewitt, G., 2004. Channel hydraulics and geomorphic effects of an extreme flood event on the Sabie River, South Africa. Catena 58,
151–181.
Hooke, J.M., Mant, J.M., 2000. Geomorphological impacts of a flood event on ephemeral
channels in SE Spain. Geomorphology 34 (3–4), 163–180.
Hungr, O., Evans, S.G., Bovis, M.J., Hutchinson, J.N., 2001. A review of the classification of
landslides of the flow type. Environ. Eng. Geosci. 7, 221–238.
Jansen, J.D., 2006. Flood magnitude–frequency and lithologic control on bedrock river incision in post-orogenic terrain. Geomorphology 82, 39–57.
Johnson, R.M., Warburton, J., 2002. Flooding and geomorphic impacts in a mountain torrent: Raise Beck, central Lake District, England. Earth Surf. Process. Landf. 27,
945–969.
Kale, V.·.S., 2007. Geomorphic effectiveness of extraordinary floods on three large rivers
of the Indian Peninsula. Geomorphology 85, 306–316.
Kale, V.·.S., Hire, P.·.S., 2004. Effectiveness of monsoon floods on the Tapi River, India: role
of channel geometry and hydrologic regime. Geomorphology 57, 275–291.
Krapesch, G., Hauer, C., Habersack, H., 2011. Scale orientated analysis of river width
changes due to extreme flood hazard. Nat. Hazards Earth Syst. Sci. 11, 2137–2147.
Langhammer, L., 2010. Analysis of the relationship between the stream regulations and
the geomorphologic effects of floods. Nat. Hazards 54, 121–139.
Lenzi, M.A., Mao, L., Comiti, F., 2006. Effective discharge for sediment transport in a mountain river: computational approaches and geomorphic effectiveness. J. Hydrol. 326,
257–276.
Lucía, A., Comiti, F., Borga, M., Cavalli, M., Marchi, L., 2015. Dynamics of large wood during
a flash flood in two mountain catchments. Nat. Hazards Earth Syst. Sci. 15 (8),
1741–1755.
Magilligan, F.J., 1992. Thresholds and the spatial variability of flood power during extreme
floods. Geomorphology 5, 373–390.
Magilligan, F.J., Buraas, E.M., Renshaw, C.E., 2015. The efficacy of stream power and flow
duration on geomorphic responses to catastrophic flooding. Geomorphology 228,
175–188.
Marchi, L., Borga, M., Preciso, E., Sangati, M., Gaume, E., Bain, V., Delrieu, G., Bonnifait, L.,
Pogačnik, N., 2009. Comprehensive post-event survey of a flash flood in Western
Slovenia: observation strategy and lessons learned. Hydrol. Process. 23 (26),
3761–3770.
Marra, F., Nikolopoulos, E.I., Creutin, J.D., Borga, M., 2014. Radar rainfall estimation for the
identification of debris-flow occurrence thresholds. J. Hydrol. 519, 1607–1619.
Martens, B., Cabus, P., De Jongh, I., Verhoest, N.E.C., 2013. Merging weather radar observations with ground-based measurements of rainfall using an adaptive multiquadric
surface fitting algorithm. J. Hydrol. 500, 84–96.
Milan, D.J., 2012. Geomorphic impact and system recovery following an extreme flood in
an upland stream: Thinhope Burn, northern England, UK. Geomorphology 138,
319–328.
Mondini, A.C., Viero, A., Cavalli, M., Marchi, L., Herrera, G., Guzzetti, F., 2014. Comparison
of event landslide inventories: the Pogliaschina catchment test case, Italy. Nat. Hazards Earth Syst. Sci. 14, 1749–1759.
Montgomery, R.D., Buffington, J.M., 1997. Channel-reach morphology in mountain drainage basin. Geol. Soc. Am. Bull. 109 (5), 596–611.
Nardi, L., Rinaldi, M., 2015. Spatio-temporal patterns of channel changes in response to a
major flood event: the case of the Magra River (central-northern Italy). Earth Surf.
Process. Landf. 40, 326–339.
Phillips, J.D., 2002. Geomorphic impacts of flash flooding in a forested headwater basin.
J. Hydrol. 269, 236–250.
Pickup, G., Rieger, W.A., 1979. A conceptual model of the relationship between channel
characteristics and discharge. Earth Surf. Proc. 4, 37–42.
Ponce, V.M., Hawkins, E.R.H., 1996. Runoff curve number: has it reached maturity?
J. Hydrol. Eng. 1 (1), 11–19.
Reid, I., Laronne, J.B., Powell, D.M., 1998. Flash-flood and bedload dynamics of desert
gravel-bed streams. Hydrol. Process. 12, 543–557.
Rinaldi, M., Surian, N., Comiti, F., Bussettini, M., 2013. A method for the assessment and
analysis of the hydromorphological condition of Italian streams: the Morphological
Quality Index (MQI). Geomorphology 180-181, 96–108.
Rinaldi, M., Amponsah, W., Benvenuti, M., Borga, M., Comiti, F., Lucìa, A., Marchi, L., Nardi,
L., Righini, M., Surian, N., 2016. An Integrated Approach for Investigating Geomorphic
Response to Extreme Events: Methodological Framework and Application to the October 2011 Flood in the Magra River Catchment. Italy, Earth Surface Processes and
Landforms http://dx.doi.org/10.1002/esp.3902 (in press).
Sloan, J., Miller, J.R., Lancaster, N., 2001. Response and recovery of the Eel River, California,
and its tributaries to floods in 1955, 1964, and 1997. Geomorphology 36, 129–154.
Surian, N., Mao, L., Giacomin, M., Ziliani, L., 2009. Morphological effects of different channel forming discharges in a gravel-bed river. Earth Surf. Process. Landf. 34,
1093–1107.
Thompson, C., Croke, J., 2013. Geomorphic effects, flood power, and channel competence
of a catastrophic flood in confined and unconfined reaches of the upper Lockyer valley, southeast Queensland, Australia. Geomorphology 197, 156–169.
Vocal Ferencevic, M.V., Ashmore, P., 2012. Creating and evaluating digital elevation
model-based stream-power map as a stream assessment tool. River Res. Appl. 28,
1394–1416.
Wolman, M.G., Gerson, R., 1978. Relative scales of time and effectiveness of climate in watershed geomorphology. Earth Surf. Proc. 3, 189–208.
Wolman, M.G., Miller, J.P., 1960. Magnitude and frequency of forces in geomorphic processes. J. Geol. 68, 54–74.
Please cite this article as: Surian, N., et al., Channel response to extreme floods: Insights on controlling factors from six mountain rivers in northern
Apennines, Italy, Geomorphology (2016), http://dx.doi.org/10.1016/j.geomorph.2016.02.002
Academia.edu no longer supports Internet Explorer.
To browse Academia.edu and the wider internet faster and more securely, please take a few seconds to upgrade your browser.
Channel response to extreme floods: Insights on controlling factors from six mountain rivers in northern Apennines, Italy
Geomorphology, 2016
...Read more
Related Papers
Science of The Total Environment, 2018
Download

Download

Download

Geomorphology, 2017
Download

Proceedings of the 38th IAHR World Congress, Panama, September 1-6 Sept, 2019, Panama City, Panama, 2019
Download

Earth Surface Dynamics
Download

Download
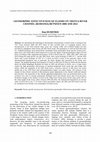

Early Christianity 6 (2015): 91–118., 2015
Download


Oppidum - Revista de Arqueologia, História e Património., 2018
Download


Luz na terra: o SEG, unha institución de alta cultura , 2023
Download

