Within-Subject Variability of Interferon-g Assay Results
for Tuberculosis and Boosting Effect of Tuberculin Skin
Testing: A Systematic Review
Richard N. van Zyl-Smit1, Alice Zwerling2,3, Keertan Dheda1,4,5, Madhukar Pai2,3*
1 Lung Infection and Immunity Unit, Division of Pulmonology and UCT Lung Institute, Department of Medicine, University of Cape Town, Cape Town, South Africa,
2 Department of Epidemiology & Biostatistics, McGill University, Montreal, Canada, 3 Montreal Chest Institute, Montreal, Canada, 4 Institute of Infectious Disease and
Molecular Medicine, University of Cape Town, South Africa, 5 Centre for Infectious Diseases and International Health, University College Medical School, London, United
Kingdom
Abstract
Background: Variability in interferon-gamma release assays (IGRAs) results for tuberculosis has implications for
interpretation of results close to the cut-point, and for defining thresholds for test conversion and reversion. However,
little is known about the within-subject variability (reproducibility) of IGRAs. Several national guidelines recommend a twostep testing procedure (tuberculin skin test [TST] followed by IGRA) for the diagnosis of LTBI. However, the effect of a
preceding TST on subsequent IGRA results has been reported in studies with apparently conflicting results.
Methodology/Findings: We conducted a systematic review to synthesize evidence on within-subject variability of IGRA
results and the potential boosting effect of TST. We searched several databases and reviewed citations of previous reviews
on IGRAs. We included studies using commercial IGRAs, in addition to non-commercial versions of the ELISPOT assay. Four
studies, fulfilling our predefined criteria, examined within-subject variability and 13 studies evaluated TST effects on
subsequent IGRA responses. Meta-analysis was not considered appropriate because of heterogeneity in study methods,
assays, and populations. Although based on limited data, within-subject variability was present in all studies but the
magnitude varied (16-80%) across studies. A TST induced ‘‘boosting’’ of IGRA responses was demonstrated in several studies
and although more pronounced in IGRA-positive (i.e. sensitized) individuals, also occurred in a smaller but not insignificant
proportion of IGRA-negative subjects. The TST appeared to affect IGRA responses only after 3 days and may apparently
persist for several months, but evidence for this is weak.
Conclusions/Significance: Although reproducibility data are scarce, significant within person IGRA variability has been
reported. If confirmed in more studies, this has implications for the interpretation of results close to the cut-point and for
definition of conversions and reversions. Although the effect of TST on IGRA results is likely to be inconsequential in IGRApositive subjects, in IGRA-negative subjects, the interpretation of results may be confounded by a preceding TST if
administered more than 3 days prior to an IGRA.
Citation: van Zyl-Smit RN, Zwerling A, Dheda K, Pai M (2009) Within-Subject Variability of Interferon-g Assay Results for Tuberculosis and Boosting Effect of
Tuberculin Skin Testing: A Systematic Review. PLoS ONE 4(12): e8517. doi:10.1371/journal.pone.0008517
Editor: Delia Goletti, National Institute for Infectious Diseases (INMI) L. Spallanzani, Italy
Received October 7, 2009; Accepted December 9, 2009; Published December 30, 2009
Copyright: ß 2009 van Zyl-Smit et al. This is an open-access article distributed under the terms of the Creative Commons Attribution License, which permits
unrestricted use, distribution, and reproduction in any medium, provided the original author and source are credited.
Funding: Funded in part by Canadian Institutes of Health Research (CIHR grant MOP-81362), European Commission (EU FP-7; TBSusgent), and Stop TB
Partnership’s New Diagnostics Working Group. The funders had no role in study design, data collection and analysis, decision to publish, or preparation of the
manuscript.
Competing Interests: MP serves as an external consultant for the Foundation for Innovative New Diagnotics (FIND), a non-profit agency that works with several
industry partners for developing and evaluating new diagnostics for TB and other neglected infections. He also serves at the Co-Chair of the Stop TB Partnership’s
New Diagnostics Working Group. Madhukar Pai is the Section Editor for TB with PLoS One and Editorial Board member with PLoS Medicine.
* E-mail: madhukar.pai@mcgill.ca
Recently, the development of more specific, in-vitro assays for
LTBI – interferon-gamma (IFN-c release assays (IGRAs), has
offered an alternative approach to LTBI diagnosis. IGRAs are
blood tests that are based on IFN-c release after stimulation by
antigens (such as early secreted antigenic target 6 [ESAT-6],
culture filtrate protein 10 [CFP-10] and TB7.7) that are more
specific to M. tuberculosis than the purified protein derivative (PPD)
used in TST. These assays are highly specific, especially in BCG
vaccinated populations [5,6]. IGRAs have features that make
them ideal for serial testing: they are more specific than TST, they
are ex-vivo assays and can be repeated any number of times without
sensitization and boosting, the testing protocol does not require a
Introduction
In many countries with low incidence of tuberculosis (TB), serial
(repeated) testing for latent TB infection (LTBI) is done for
individuals at high risk of TB exposure. This is done, for example,
in programs for screening of healthcare workers for LTBI as a
component of TB infection control. Serial testing is also performed
as part of TB contact investigations. Although widely used, the
conventional tuberculin skin test (TST) has limitations in accuracy
and reliability[1]. Furthermore, interpretation of serial TST results
is particularly complicated because of non-specific variations in
test results, boosting, conversions, and reversions [2,3,4].
PLoS ONE | www.plosone.org
1
December 2009 | Volume 4 | Issue 12 | e8517
IGRA Variability and Boosting
citations of relevant original articles. Experts in the field and
commercial test manufacturers were also contacted to obtain
relevant citations. No language restrictions were imposed and fulllength papers as well as conference abstracts were included (to
limit potential publication bias).
We included studies of QuantiFERON-TB Gold (QFT-G, also
known as QFT-2G), QuantiFERON-TB Gold In-Tube (QFTGIT, also known as QFT-3G) [Cellestis Limited, Victoria,
Australia], and the T-SPOT.TB [Oxford Immunotec, Oxford,
UK] or its pre-commercial ELISPOT version. Where relevant, we
included in-house, short-incubation (overnight) IFN-c assays with
RD1 antigens as well, to increase the number of relevant studies.
For studies assessing reproducibility (defined as within-subject
repeatability over time, under similar conditions), the study had to
have repeated (at least two) IGRA assays (same IGRA) done on
the same group of subjects, preferably in a setting with limited TB
exposure and without an antecedent TST within 6 months. If
reproducibility was done in a high TB incidence setting where
exposure-related changes are likely, then repeat tests should have
been done over a short period of ,6 weeks (to avoid the confusion
between conversions (or new infections) and natural variations in
T-cell responses). For studies assessing boosting of IGRA results
due to a prior TST, the study sample must have had at least one
IGRA assay done before and after tuberculin skin testing and not
performed in the context of a contact or outbreak study in a high
incidence setting (again, to avoid the confusion between true
conversion and boosting).
We did not consider reproducibility data where two or more
tests were done on the same sample at the same time (e.g. two tests
done using samples from the same blood draw); this would not
have been informative for our objective of determining the withinperson variability when the test is repeated over time (serial
testing). Also, we did not consider other forms of reproducibility
data, such as inter-laboratory variation, variations between lab
technologists, batch-to-batch variations, variations due to different
incubation times, etc.
second visit for reading, and unlike the TST, there is no need for a
baseline two-step testing protocol. In all cases of a positive test,
however, the patient will need to return for subsequent work-up
and preventive therapy.
While some guidelines have recommended the use of IGRAs for
serial testing[7], others have been more cautious [8,9]. Some
guidelines have suggested that TST may be replaced by IGRAs [7],
while others have suggested initial testing with TST, with IGRA as a
follow-up option to confirm TST results [8,9]. Regardless of the
approach, widespread use of IGRAs in serial testing is hampered by
lack of evidence on several key questions (as reviewed elsewhere
[10,11]): a) What is the within-person reproducibility of T cell
responses over time (in other words, what amount of variation is
expected when IGRAs are repeated)? b) Given a certain degree of
‘‘inherent variability’’, how does one interpret a single test result
close to the assay cut point?; c) Will a TST boost or affect the results
of subsequent IGRA testing and what is the optimum time gap
between the two tests? d) What is an IGRA ‘‘reversion’’ and what
threshold should be used to define reversion? e) What is the clinical
significance and prognosis of an IGRA reversion? f) What is an
IGRA ‘‘conversion’’ and what threshold (cut-off) should be used to
define conversion? g) What is the prognosis (i.e. predictive value) of
an IGRA conversion and will treatment of individuals with IGRA
conversions reduce their risk of progression to active disease?
Unfortunately, data are lacking on these important questions
and without such evidence, the results of serial IGRA testing will
be difficult to interpret, especially if it is introduced in a routine
testing program. In the past few years, there have been several
attempts to answer at least two of the above questions: 1)
reproducibility of IGRAs when repeated over time and 2) effect of
TST on subsequent IGRA results. We performed a systematic
review of these studies to inform policies and practices relevant to
serial IGRA testing.
Methods
Objectives of the Review
Our systematic review aimed to synthesize evidence on two
related questions: 1) What is the within-person reproducibility (i.e.
variability) of T cell responses over time? 2) What is the effect of a
tuberculin skin test on subsequent IGRA results and how do
factors such as time interval after TST and baseline IGRA status
affect the boosting results?
Study Selection and Data Extraction
Two independent reviewers (RVZS & AZ) perused searches and
selected articles meeting our inclusion criteria. One reviewer
(RVZS) abstracted data, using a standardized template, regarding
patient characteristics and test characteristics and outcomes, and
these data were independently verified by a second reviewer (AZ).
Where necessary, study authors were contacted for additional or
missing information.
Study Sources and Eligibility
We have previously published systematic and narrative reviews
on IGRA accuracy and performance in various subgroups
[5,6,12,13,14]). We updated the database searches that were done
in previous systematic reviews and searched the literature for
relevant IGRA studies (up to November 2009) that reported data
on within-subject variability of IGRAs and/or data on effect of
TST on subsequent IGRA results. We searched PubMed, Embase
and Biosis and Web of Science, and reviewed citations of all
original articles published in all languages.
The search terms used in database searching included:
((interferon-gamma release assay*) OR (T-cell-based assay*) OR
(antigen-specific T cell*) OR (T cell response*) OR (T-cell
response*) OR (interferon*) OR (interferon-gamma) OR (gamma-interferon) OR (IFN) OR (elispot) OR (ESAT-6) OR (CFP-10)
OR (culture filtrate protein) OR (Enzyme Linked Immunosorbent
Spot) OR (Quantiferon* OR Quantiferon-TB Gold)) AND
((tuberculosis OR mycobacterium tuberculosis)).
In addition to database searches, we reviewed bibliographies of
previous reviews and guidelines on IGRAs, and also screened the
PLoS ONE | www.plosone.org
Data Synthesis and Analysis
For each study, we extracted data on reproducibility and
summarized the results in tables. Data on boosting were separately
extracted and tabulated. Because of heterogeneity in study designs,
time intervals between tests, study populations and assays, we
decided to not perform pooled analyses (meta-analyses).
Results
Characteristics of Included Studies
Our literature searches identified a total of 428 studies on IGRAs
(commercial and in-house), excluding reviews, editorials, letters (not
containing original data), and guidelines. After reviewing these, we
identified 4 studies [2,3,15,16] on within-person variability, and 13
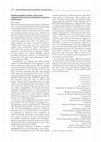
studies [2,17,18,19,20,21,22,23,24,25,26,27,28] on potential boosting of IGRA results by TST (Figure 1 shows the study selection flow
chart). In all, these studies included a total of 1460 subjects. The
average number of subjects per variability study was 46 (range 14 to
2
December 2009 | Volume 4 | Issue 12 | e8517
IGRA Variability and Boosting
any exposure over a short time period. However, given the limited
evidence, these observations require further confirmation in wellpowered studies.
Boosting Effect of TST on IGRA Results
Table 2 shows the results of the boosting studies. As shown in
the table, a total of 13 studies have examined the impact of TST
on subsequent IGRA results. Only one of these studies was
performed in a high burden country although many of the studies
in low burden countries recruited immigrants or HCWs who could
be considered to have higher risk prior of TB exposure than the
normal population.
Four studies used 2TU RT 23 PPD, three used 5TU PPD-S,
three used 5 TU tubersol, one used 3TU PPD (in two studies PPD
type was not reported). Five studies used the T-SPOT.TB assay, 6
studies the QuantiFERON-TB Gold assay (various generations)
and 4 studies had data using both IGRA platforms. The time
points for assessing impact of TST varied widely. The range of
time points used was from 3 days post-TST to 2 years after TST.
Of the 13 studies, 5 concluded that boosting did not occur.
[18,19,20,21,28] In four of these studies [19,20,21,28] the earliest
time point of repeat IGRA testing ranged from 28 days to 9
months. The other study by Leyten et al [18] used only day three
results after TST and found no evidence of IGRA boosting. It is
relevant to note that in this latter study two subjects inadvertently
had the second IGRA on day 10 and 11 (instead of day 3) – both
these subjects demonstrated boosting in responses.
Of the 7 studies that concluded that boosting does occur, 5 had
repeat IGRA testing within 21 days after TST. Thus, it appears
that the time point at which the second IGRA is done is highly
relevant to the assessment of whether boosting occurs after TST.
The TST used in the studies did not appear to correlate with
boosting as boosting was documented in at least one study for each
of the PPD reagents used.
Most of the studies included both IGRA-negative and positive
subjects (at baseline) with variable TST status. However, two
studies only recruited IGRA-negative subjects [17,25] to undergo
a second TST. IGRA-negative subjects in most studies (using the
shorter time points) generally did not boost with only a small
percentage boosting (2–12%). It is only possible from two of the
studies to relate this to TST Status. In the study by van Zyl-Smit
et al. [2] the IGRA negative subjects who boosted were all TSTpositive. The study by Belknap et al. [17] concluded that TST
status did not predict boosting.
Two studies reported on the quantitative IFN-c levels pre and
post TST. Perry et al. demonstrated a rise in mean IFN-c levels in
IGRA positive subjects post TST at day 84. This was reproduced
by van Zyl-Smit et al. who showed a persistently elevated IFN-c
response up to day 84 for the cohort as a whole although some
individuals had returned to pre- TST levels by day 28.
Figure 1. Study selection flow chart.
doi:10.1371/journal.pone.0008517.g001
117). The average number of subjects per boosting study was 91
(range 9 to 530). Of the total of 13 studies, 2 (14%) were done in
high TB incidence settings, and 86% in low incidence settings
(although several of these studies included immigrants from high
burden countries). The populations included in these studies were
heterogeneous, although several studies used healthcare workers as
volunteers.
Within-Person Variability Results
Table 1 shows the results of the reproducibility studies. As
shown in the table, a total of four studies were included.
[2,3,15,16] Although some other studies reported the reproducibility of IGRA assays, these were not included, as a TST had been
performed at the time of the initial IGRA [22,29] and therefore
reproducibility results could have been impacted by TST-induced
changes in IGRA results. Three studies were performed in a high
burden setting (India and South Africa) and one in a low burden
setting (USA). Comparison of high vs. low burden settings was not
possible as the American study is ongoing and only limited data
were available for inclusion. Only one study directly compared the
variability of the T-SPOT.TB and QFT-GIT in a head to head
study. [2]
It was evident from the four published studies that the statistical
analysis of within-subject variability is complex as multiple samples
are taken in multiple individuals at multiple time points. Although
kappa statistics can be used to analyse concordance in dichotomous results, to interpret the variability in continuous variables
more complex statistical modelling was used in the studies.
The study in India (4 repeat tests over a 2 week period) reported
a variability of 16% in IFN-c responses as measured by the QFT
GIT to be within the bounds of statistical probability[3]. The other
study to report variability in the continuous results performed in
South Africa (4 tests over 3 weeks) reported a variability of 80% in
IFN-c responses (QFT GIT) and 3 spots T-SPOT.TB to be the
95% confidence interval for within-subject variability[2]. In both
these studies, subjects who spontaneously converted or reverted
had initial test results that were close the assay cut point. The study
by Detjen et al. repeated the QFT GIT on day one and three and
showed no changes in quantitative (dichotomous) results although
there was considerable variability in the continuous IFN-g values
(intra-class correlation of 0.80) [16].
Overall, although only 4 small reproducibility studies were
identified, all showed variations in IFN-c responses, even over
short periods of time, and even in low exposure settings. The data
suggest that spontaneous conversions and reversions can potentially occur during serial testing, even in the apparent absence of
PLoS ONE | www.plosone.org
Discussion
While IGRAs have emerged as promising alternatives to the
TST, there is still controversy regarding the most effective strategy
for their use. For example, some national guidelines recommend
replacement of the TST with the IGRA. Some recommend that
either TST or IGRA can be used (but not both), while several
countries (e.g. Canada, UK, Italy, Germany, Switzerland, Netherlands, Korea and Norway) recommend a two-step approach of
TST first, followed by an IGRA. In fact, a recent survey of global
IGRA guidelines showed that the two-step approach appears to be
the most favoured guideline recommendation worldwide. [30]
Boosting, clearly, is a key concern with the two-step approach, and
3
December 2009 | Volume 4 | Issue 12 | e8517
PLoS ONE | www.plosone.org
Table 1. Studies on within-person variability of Interferon gamma release assays in high and low burden countries.
Study,
Reference,
Year
BCG status
IGRA
Time
points
(days)
Study results summary (within-subject variability)
Comment
Veerapathran
et al [3] 2008
India (high)
14 HCWs
(clinical and
laboratory
workers)*
Likely but all tests
were done within
a 2-week period
All vaccinated
QFT-GIT
0, 3, 9, 12
Yes
Over a 2 weeks period, 2 of 14 persons had a QFT reversion.
With quantitative results, an increase in 16% of IFN-c response
was considered within the ‘normal’ expected within subject
variability.
Subjects who had
conversions or reversions
had initial values close to
the cut point
Van Zyl-Smit
et al [2] 2009
South Africa
(High)
26 HCWs and
low risk
volunteers+
Likely but all tests
were done within
a 3 week period
All vaccinated
QFT-GIT
T-SPOT.TB
0, 7, 14, 21
Yes
Over a 3 week period, 7 of 26 persons had a conversion or
reversion (1 QFT and 6 TSPOT TB).
With quantitative results, a change of 680% of any given IFN-c
response (QFT-GIT) or 63 spots (T-SPOT.TB) was considered
to fall within the ‘normal’ expected within subject variability.
Subjects who had
conversions or reversions
had initial values close to
the cut point
Detjen et al
[16] 2009
South Africa
(High)
27 HCW’s
(clinical and
laboratory
workers)*
Likely but all tests
were done within
a 3-day period
all vaccinated
QFT-GIT
0, 3
Yes
Over a 3-day period, no changes in qualitative results were noted
for 15 persons. With quantitative results, considerable intra-individual
variability occurred in the magnitude of IFN-c responses; intra-class
correlation was 0.80.
Belknap et al
[15] 2009
(abstract)#
USA (low)
117 HCWs
Unlikely and all tests Unknown
were done within
a 3 week period
QFT-GIT
T-SPOT.TB
0, 7-21
Yes
Over a 3 week period, 7 of 117 (6%) persons had a conversion or
reversion with QFT-GIT and 8 of 105 (7.6%) with T-SPOT.TB
Country (TB
Prevalence)
Participants
TB Exposure
during study
Internal
quality
control
4
Quantitative results not
yet available
India and South Africa are high prevalence TB countries with high risk of exposure to health care workers (HCW). HCW’s were divided into two groups – medical doctors or laboratory workers.
+South Africa is a high prevalence TB country with high risk of exposure to health care workers (HCW). HCW’s were stratified into: High risk (daily potential TB exposure) Medium risk (HCW, but no daily expected TB exposure) Low
risk group (pre-clinical medical students and non-clinical volunteers).
#updated preliminary data presented at the Second Global Symposium on IGRAs. Daley C. Evaluation of interferon-g release assays in the diagnosis of latent TB infection in US healthcare workers: preliminary results of Task Order
#18. 31 May 2009; Second Global Symposium on IGRAs, Dubrovnik, Croatia2009.
doi:10.1371/journal.pone.0008517.t001
IGRA Variability and Boosting
December 2009 | Volume 4 | Issue 12 | e8517
*
Table 2. Studies on boosting effect of tuberculin skin test on IGRA results.
PLoS ONE | www.plosone.org
Study,
Reference,
Year
Country/population
recruited
(TB burden)
van Zyl-Smit
et al [2] 2009
Time points
(days after TST
administration)
Study
results
summary
Comment
Study
conclusion
on boosting
IGRA
South Africa
HCW’s and healthy
volunteers (High)
24
2TU
RT23
QFT-GIT
TSPOT.TB
0,3,7,28,84
Day 3: no categorical changes
Day 7: Significant increase in mean IFN-c, QFT-GIT
1/12 (8%) negative to positive, 5/8 (62.5%) positive
q in INF-c responses
Day 7: T-SPOT.HTB 2/16 (12.5%) negative to
positive, 6/8 (75%) positive q in INF-c responses
IGRA negative subjects who
boosted were TST positive.
Yes
Baker et al
[27] 2009
USA
immigrants/ refugees
in US less than 6mo (mainly
high burden countries)
114
5TU
PPD-S
QFT-GIT
0, 14–112
,35 days: 2nd IGRA 87%q in INF-c responses,
35 -112 days: 69%2nd IGRA q in INF-c responses
IGRA positive 86% showed boosting*
IGRA negative 68% showed boosting
*TST positive boosted by 82%
whereas TST negative by 62%
(p = 0.06)
Yes
Belknap et al
[17] 2009
[abstract] #
USA
HCWs (equal number
of TST +/TST -) (Low)
125
5TU
Tubersol
QFT-GIT
T-SPOT.TB
7–21+
QFT-GIT: 12 (10%) negative to positive,
T-SPOT.TB: 12 (10%) negative to positive
Exact testing days not specified; Yes
Only IGRA negative recruited TST
status did not predict boosting
Vilaplana et al.
[23] 2008
Spain
TB researchers (low)
9
2TU RT23
ELISPOT & WBA 0,7, 14, 28
IFN-c*
IGRA neg/TST neg 5–60 x qat day 7* (4 subjects)
IGRA pos/TST pos 20–400 x q at day 7* (3 subjects)
IGRA pos/TST neg 5–80 x q at day7 * (2 subjects)
* Depending on Antigen used; +
Cellestis Ltd.
Choi et al
[26] 2008
South Korea
HCWs in Pulmonary
Medicine working
.1 year (medium)
59
2TU
RT23
QFT G
0, 14–28
Median IFN-c responses q at visit post TST
0.05 to 0.19IU/ml increase in TST positive group
(p = 0.01)
IGRA neg/ TST pos 3/18 (16.7%) become IGRA positive
IGRA neg/TST neg zero became positive (p = 0.11)
Perry et al
[22] 2008
infectious disease
cohort (low)
63
5TU
Tubersol
QFT-GIT
0, 84 (3 mo)
Day 84: 3/48 (6%) QFT negative became positive
Day 84: Mean IFN-c responses q in initially QFT
positive subjects
Richeldi et al
[20] 2008 *
Italy Paediatric TB
contacts
70 & 81
5TU
PPD S
QFT-G/QFT-GIT
0, 56–77
QFT-G: 1/51(2%) negative became positive (no
change in mean QFT levels in negative subjects)
QFT-GIT 1/63 (1.5%) negative became positive
Leyten et al
[18] 2007
The Netherlands
Known TST 0mm
(n = 15) and known TST
$10mm (n = 51) (low)
66
2TU
RT23
QFT GIT
0, 3,(10,11)*
Day 3: no categorical changes
Day10: 1 negative to positive
Day11: 1 positive q in INF-c response
No @ 3days
*Boosting shown only in two
with delayed processing, and this Yes @ 10 days
was not statistically significant
Igari et al
[25] 2007
33
Japan
University Medical
students, Negative baseline
QFT and TST ,15 mm (low)
3TU
PPD
QFT-G
0, 42
Day 42: IGRA neg/TST neg; 5(15%)
became positive
Only concordant baseline
negatives had second IGRA
Yes
Naseer et al.
[24] 2007
UK
Subjects not specified,
No Hx of TB contact
or disease (low)
10
Not
reported
QFT-G
T-SPOT.TB
0, 2, 42
Day 42: 3/9 (33%) QFT negative became positive
Day 42: 0 T-SPOT negative became positive
No qualitative results reported;
No boosting if blood drawn at
TST administration
Yes
Cellestis Ltd,
Australia - QFT
USA Package
insert [28] 2007
USA
530
Not
reported
QFT-GIT
0, 28–35
IGRA negative 3 became positive (total number
of negatives not reported), 5 initially positive
reverted
Industry study not published
No
Richeldi et al
[19] 2006 *
Italy TB contacts
(low)
44
5TU
PPD S
T-SPOT.TB
0, 9, 15 24 months
(Post TB exposure)
Month 24: all subjects remained IGRA
negative, although 3 converted by TST
All subject TST and IGRA
negative at first visit
No
5
Participants TST
Yes
Yes
Non significant trend for
inconsistent QFT results to be
discordant by TST at baseline
yes
No
IGRA Variability and Boosting
December 2009 | Volume 4 | Issue 12 | e8517
PLoS ONE | www.plosone.org
#updated preliminary data presented at the Second Global Symposium on IGRAs. Daley C. Evaluation of interferon-g release assays in the diagnosis of latent TB infection in US healthcare workers: preliminary results of Task Order
#18. 31 May 2009; Second Global Symposium on IGRA, Dubrovnik, Croatia, 2009.
*
Retrospective studies.
doi:10.1371/journal.pone.0008517.t002
No
This study primarily investigated
TST-TST boosting (PPD)
responses) and discordance.
Day 84: 1/27 (4%) negative became positive
(p = 0.10)
0, 84 (3 mo)
QFT- TB
48
USA
infectious disease
cohort (low)
Nguyen et al
[21] 2005
5TU
Tubersol
IGRA
Participants TST
Country/population
recruited
(TB burden)
Study,
Reference,
Year
Table 2. Cont.
Time points
(days after TST
administration)
Study
results
summary
Comment
Study
conclusion
on boosting
IGRA Variability and Boosting
thus far, only the Canadian guideline has explicitly addressed this
issue and recommended that blood be drawn for IGRA on or
before the day when the TST is read [8].
The use of IGRAs for serial testing is also contentious, given the
lack of clarity on how to interpret values close to the assay cut
point and how to define and treat IGRA conversions and
reversions. A ‘‘grey zone’’ exists for T-SPOT.TB values close to
the cut point whereas the QFT-GIT does not and in addition,
some countries recommend IGRAs for serial testing while others
do not. Several studies from both high and low TB burden
countries [31,32,33,34,35,36,37] now suggest that IGRA conversions and reversions occur frequently and there is no clear
consensus on how to interpret and deal with such results. In this
context, our systematic review provides useful insights into some of
these issues.
Within-Person Variability
There is a striking lack of published, peer-reviewed reproducibility studies that met our inclusion criteria, which is surprising,
given that commercial IGRAs have been available for over 5 years
now. Although some studies reported evaluating IGRA reproducibility, they were performed following tuberculin skin testing or in
the context of contact screening and thus cannot be considered to
be reproducibility studies. There were 3 published variability
studies that investigated within-subject variability, i.e. serially
testing the same individual over several days to weeks [2,3,16]. A
fourth study by Belknap et al. [15] is currently ongoing (this study
however only uses two time points.).
The three published reproducibility studies reported total only
67 subjects – although the total number of IGRA tests performed
exceeds 350. It is difficult to compare these three studies - although
they were all performed in high burden settings, the time points
used were not the same. The study by van Zyl-Smit et al. [2]
included assessment of both QFT-GIT and T-SPOT.TB assay –
not previously reported.
Regardless of the small samples and variability in methods and
tests, these studies show that variability in IGRA results does occur
and is not inconsequential in high burden settings. Variability is
most frequently seen with baseline positive IGRA results, and in
those results that are around the cut-off points. Anecdotally and in
published reports, it is not uncommon to serially test individuals,
especially those with values around the cut-off, and find their
IGRA values cross the assay cut-point. Within-subject variability
may explain most of these observations. Figure 2 is a schematic
that attempts to capture this notion. From the available data, it is
not easy to tease out the biological/host factors that result in
within-subject variations, from laboratory and technical factors
that can result in variations. Further work is needed to resolve
these sources of variation. There are no published data regarding
within-subject variability in low burden settings, but preliminary
findings from an ongoing study in the USA [15] confirms the
findings seen in high burden settings. Additional studies are
needed in low TB incidence countries.
Given the variability seen in results from individuals undergoing
repeat testing a ‘‘borderline’’/grey zone for a single test value close
to the cut-point appears reasonable for the T-SPOT.TB assay and
was required for US Food and Drug Administration (FDA)
licensure of T-SPOT.TB. It remains to be seen if the FDA defined
grey zone or those newly proposed by independent researchers are
clinically useful. For the QFT-GIT, although some variability has
been shown, more data are required to accurately define the grey
zone around the cut-point. It is not possible to propose a definitive
grey zone for use by clinicians in all settings based on the available
data. Large studies from high and low burden countries are
6
December 2009 | Volume 4 | Issue 12 | e8517
IGRA Variability and Boosting
The second important issue is to separate baseline IGRAnegative and IGRA-positive subjects. IGRA-positive subject show
clear boosting in three studies. [2,22,23] This is biologically
intuitive and perhaps expected as IGRA positive individuals likely
have circulating memory T cells that have previously been
exposed to RD-1 antigens. [2] This will in most clinical settings
probably be irrelevant because IGRA-positive subjects are not
likely to be re-tested in routine programs (just as TST-positive
individuals are usually not re-tested with TST). However, in the
context of following IGRA trends in response to TB treatment (e.g.
as a biomarker for treatment response) or attempting to predict the
risk of developing active disease, a TST may affect our ability to
interpret serial IGRA test results.
In IGRA-negative subjects, the issue of boosting is most relevant
and contentious. The major implications of whether boosting
occurs or not, is to the two step strategy for IGRA testing of risk
groups such as immigrants and household contacts. It is clear from
the studies presented that only a smaller but not insignificant
percentage of IGRA-negative individuals (2-12%) boost following
a TST. However, the proportion may be larger as the published
studies only enrolled small numbers of IGRA-negative subjects
(range 12–51). The implication for this group is that they would
receive inappropriate INH chemoprophylaxis on the basis of a
falsely positive IGRA. It is further not clear, however, if only
IGRA negative subjects whose TST is positive, boost with a
resultant positive post-TST IGRA. Larger studies are required.
There are no published data documenting the exact amounts of
RD-1 antigens/peptides contained in PPD formulations that are
on the market. It is also not clear if the magnitude of the boosting
effect is generalisable to all PPD formulations, although boosting
has been documented for most commercial TST formulations.
There are insufficient data to determine if, and at what interval,
boosted IGRA levels will predictably return to baseline after a
TST. Current data suggests that if blood for IGRA testing is
drawn before or within 72 hours of the TST being planted this
should not result in false positive IGRA results due to boosting.
Thus, it does appear that the optimal time to collect blood for
IGRA is at the time of reading the TST. This approach has
already been recommended in the Canadian guidelines[8]; other
guidelines may need to be updated accordingly.
Figure 2. Schematic of the concept of ‘‘conversion and
reversion’’ and ‘‘within-subject variability’’. The conversion and
reversion points depicted are based on the manufacture’s definitions
with a hypothetical within-subject variability or borderline/grey zone
indicated. The shaded area for the T-SPOT.TB diagram is the FDA
defined grey zone.
doi:10.1371/journal.pone.0008517.g002
needed to enable a meaningful estimation of the magnitude of
variability in all settings.
Boosting Effect of TST on IGRA Results
There are now a considerable number (12) of studies that have
investigated the effect of the TST on subsequent IGRA results
including an additional study undertaken by the US Navy and
CDC, reported in the package insert for the manufacturer of the
QFT assay (Cellestis Limited, Victoria, Australia). These studies
however have used different generations of the various IGRA
assays as well as using vastly different time points, range 3 days to
730 days, upon which to base their conclusions. These differences
precluded any numeric pooling (meta-analysis). The conclusions
about whether boosting of IGRA responses occurs after the TST
also needs to be related to the initial IGRA or TST status of the
individual.
In general, there is growing evidence that the TST can indeed
boost subsequent IGRA results. However, the effect appears to be
more apparent in those individuals who were already IGRApositive to begin with (i.e. previously sensitized to M. tuberculosis or
possibly other mycobacteria). Also, the effect seems apparent only
after the first few days (day 3 post TST) and potentially wanes after
3 months, but this requires further confirmation. There are no
data which allow us to predict when the boosting effect of TST is
likely to wane.
Although the boosting studies presented in this systematic
review could be considered to present contradictory evidence, this
is probably not the case. All the studies that demonstrated boosting
used time points between 7 and 28 days for the second IGRA (post
TST.) The studies that showed no evidence of boosting generally
had time points less than 7 days or greater than 3 months for the
second IGRA. The crucial time point is clearly day three (time of
TST reading) but future boosting studies must use multiple time
points. To determine the ‘‘onset’’ of boosting studies would
specifically need to examine days 1,2,3,4,5 and 6 and then
multiple days beyond the first week, to ascertain how long the
boosting effect might last occur.
PLoS ONE | www.plosone.org
Future Research Directions
It is clear that we need more data on reproducibility of IGRAs,
both short-term as well as long-term. In particular, reproducibility
studies of the two commercial assays are urgently needed, because
they are most likely to be used in routine clinical practice. Studies
in both high and low incidence settings are required as the results
may differ due to the potential confounding of concurrent TB
exposure. Better definition of a borderline/grey zone for the assay
cut point will provide clinicians with more confidence when
dealing with individuals who have values close to the cut-point.
Existing package insert data and data used for FDA and other
regulatory approvals do provide some reproducibility data, but
they do not quite provide the longitudinal within-subject
variability results that are needed for serial testing interpretation.
In any case, independent studies are necessary for policy making,
beyond the industry generated data.
Large prospective studies in both high and low burden countries
are required to come up with definitive recommendations
regarding the timing of TST and IGRA, and exact definitions
for conversions and reversions. Such studies are ongoing. It will be
important that these studies use a variety of commercially available
PPD preparations and multiple time points prior to and following
the TST. Until definitive recommendations can be made, it may
7
December 2009 | Volume 4 | Issue 12 | e8517
IGRA Variability and Boosting
be prudent to assume that IGRAs are dynamic tests that can
produce variable results. So, borderline IGRA results should
always be carefully interpreted with consideration of relevant
clinical information. It is also prudent to assume that boosting of
IGRA by TST is likely after the initial few days, although we still
do not know how long such boosting effects last.
Author Contributions
Conceived and designed the experiments: RvZS KD MP. Performed the
experiments: RvZS AZ. Analyzed the data: RvZS AZ MP. Contributed
reagents/materials/analysis tools: AZ KD MP. Wrote the paper: RvZS
MP. Provided supervision and funding support: MP, KD.
References
1. Farhat M, Greenaway C, Pai M, Menzies D (2006) False-positive tuberculin skin
tests: what is the absolute effect of BCG and non-tuberculous mycobacteria?
Int J Tuberc Lung Dis 10: 1192–1204.
2. van Zyl-Smit RN, Pai M, Peprah K, Meldau R, Kieck J, et al. (2009) Withinsubject Variability and Boosting of T Cell IFN-{gamma} Responses Following
Tuberculin Skin Testing. Am J Respir Crit Care Med 180: 49–58.
3. Veerapathran A, Joshi R, Goswami K, Dogra S, Moodie EE, et al. (2008) T-cell
assays for tuberculosis infection: deriving cut-offs for conversions using
reproducibility data. PLoS ONE 3: e1850.
4. Menzies D (1999) Interpretation of repeated tuberculin tests. Boosting,
conversion, and reversion. Am J Respir Crit Care Med 159: 15–21.
5. Pai M, Zwerling A, Menzies D (2008) Systematic review: T-cell-based assays for
the diagnosis of latent tuberculosis infection: an update. Ann Intern Med 149:
177–184.
6. Menzies D, Pai M, Comstock G (2007) Meta-analysis: new tests for the diagnosis
of latent tuberculosis infection: areas of uncertainty and recommendations for
research. Ann Intern Med 146: 340–354.
7. Mazurek GH, Jereb J, Lobue P, Iademarco MF, Metchock B, et al. (2005)
Guidelines for using the QuantiFERON-TB Gold test for detecting Mycobacterium tuberculosis infection, United States. MMWR Recomm Rep 54: 49–55.
8. Canadian tuberculosis committee (2008) Updated recommendations on
interferon gamma release assays for latent tuberculosis infection. An Advisory
Committee Statement (ACS). Can Commun Dis Rep 34: 1–13.
9. National Institute for Health and Clinical Excellence (2006) Tuberculosis:
Clinical diagnosis and management of tuberculosis, and measures for its
prevention and control. London: National Institute for Clincal Excellence.
10. Pai M, O’Brien R (2007) Serial testing for tuberculosis: can we make sense of T
cell assay conversions and reversions? PLoS Med 4: e208.
11. Pai M, Dheda K, Cunningham J, Scano F, O’Brien R (2007) T-cell assays for
the diagnosis of latent tuberculosis infection: moving the research agenda
forward. Lancet Infect Dis 7: 428–438.
12. Dheda K, Udwadia ZF, Huggett JF, Johnson MA, Rook GA (2005) Utility of the
antigen-specific interferon-gamma assay for the management of tuberculosis.
Curr Opin Pulm Med 11: 195–202.
13. Dheda K, van Zyl-Smit R, Badri M, Pai M (2009) T-cell interferon-gamma
release assays for the rapid immunodiagnosis of tuberculosis: clinical utility in
high-burden vs. low-burden settings. Curr Opin Pulm Med 15: 188–200.
14. Pai M, Riley LW, Colford JM Jr (2004) Interferon-gamma assays in the
immunodiagnosis of tuberculosis: a systematic review. Lancet Infect Dis 4:
761–776.
15. Belknap R, Kelahar J, Wall K, Daley C, Schluger N, et al. (2009) Diagnosis of
Latent Tuberculosis Infection in U.S. Health Care Workers: Reproducibility,
Repeatability and 6 month Follow-up with Interferon gamma release assays
(IGRAs). Am J Respir Crit Care Med 179: A4101.
16. Detjen AK, Loebenberg L, Grewal HM, Stanley K, Gutschmidt A, et al. (2009)
Short-term Reproducibility of a Commercial Interferon-gamma Release Assay.
Clin Vaccine Immunol 16(8): 1170–5.
17. Belknap R, Feske M, Choung G, Weinfirter P, Wall K, et al. (2009) Diagnosis of
Latent Tuberculosis Infection in Health Care Workers: Impact of recent
Tuberculin Skin test on the Inteferon-gamma release assays (IGRAs). Am J Respir
Crit Care Med 179: A1011.
18. Leyten EMS, Prins C, Bossink AWJ, Thijsen S, Ottenhoff THM, et al. (2007)
Effect of tuberculin skin testing on a Mycobacterium tuberculosis-specific
interferon-{gamma} assay. European Respiratory Journal 29: 1212–1216.
19. Richeldi L, Ewer K, Losi M, Roversi P, Fabbri LM, et al. (2006) Repeated
tuberculin testing does not induce false positive ELISPOT results. Thorax 61:
180.
PLoS ONE | www.plosone.org
20. Richeldi L, Bergamini BM, Vaienti F (2008) Prior tuberculin skin testing does
not boost QuantiFERON-TB results in paediatric contacts. Eur Respir J 32:
524–525.
21. Nguyen M, Perry S, Parsonnet J (2005) QuantiFERON-TB predicts tuberculin
skin test boosting in U.S. foreign-born. Int J Tuberc Lung Dis 9: 985–991.
22. Perry S, Sanchez L, Yang S, Agarwal Z, Hurst P, et al. (2008) Reproducibility of
QuantiFERON-TB Gold In-Tube Assay. Clin Vaccine Immunol 15: 425–432.
23. Vilaplana C, Ruiz-Manzano J, Gil O, Cuchillo F, Montane E, et al. (2008) The
tuberculin skin test increases the responses measured by T cell interferon-gamma
release assays. Scand J Immunol 67: 610–617.
24. Naseer A, Naqvi S, Kampmann B (2007) Evidence for boosting Mycobacterium
tuberculosis-specific IFN-{gamma} responses at 6 weeks following tuberculin
skin testing. European Respiratory Journal 29: 1282–1283.
25. Igari H, Watanabe A, Sato T (2007) Booster phenomenon of QuantiFERONTB Gold after prior intradermal PPD injection. The International Journal of
Tuberculosis and Lung Disease 11: 788–791.
26. Choi JC, Shin JW, Kim JY, Park IW, Choi BW, et al. (2008) The effect of
previous tuberculin skin test on the follow-up examination of whole-blood
interferon-gamma assay in the screening for latent tuberculosis infection. Chest
133: 1415–1420.
27. Baker CA, Thomas W, Stauffer WM, Peterson PK, Tsukayama DT (2009)
Serial testing of refugees for latent tuberculosis using the QuantiFERON-gold
in-tube: effects of an antecedent tuberculin skin test. Am J Trop Med Hyg 80:
628–633.
28. Cellestis Inc (2007) QuantiFERON-TB GOLD (In-Tube Method) package
insert Doc No.US05990301C. Cellestis Inc (USA). Valencia.
29. Hill PC, Jackson-Sillah DJ, Fox A, Brookes RH, de Jong BC, et al. (2008)
Incidence of Tuberculosis and the Predictive Value of ELISPOT and Mantoux
Tests in Gambian Case Contacts. PLoS ONE 3: e1379.
30. Pai M (2009) Guidelines on IGRAs: concordant or discordant? 2nd Global
Symposium on IGRAs. Dubrovnik, Croatia.
31. Pai M, Joshi R, Dogra S, Mendiratta DK, Narang P, et al. (2006) Serial testing
of health care workers for tuberculosis using interferon-gamma assay. Am J Respir
Crit Care Med 174: 349–355.
32. Hill PC, Brookes RH, Fox A, Jackson-Sillah D, Jeffries DJ, et al. (2007)
Longitudinal assessment of an ELISPOT test for Mycobacterium tuberculosis
infection. PLoS Med 4: e192.
33. Ewer K, Millington KA, Deeks JJ, Alvarez L, Bryant G, et al. (2006) Dynamic
Antigen-specific T-Cell Responses after Point-Source Exposure to Mycobacterium tuberculosis. Am J Respir Crit Care Med 174: 831–839.
34. Pai M, Joshi R, Dogra S, Zwerling AA, Gajalakshmi D, et al. (2009) T-cell assay
conversions and reversions among household contacts of tuberculosis patients in
rural India. Int J Tuberc Lung Dis 13: 84–92.
35. Lee SS, Liu YC, Huang TS, Chen YS, Tsai HC, et al. (2008) Comparison of the
interferon- gamma release assay and the tuberculin skin test for contact
investigation of tuberculosis in BCG-vaccinated health care workers.
Scand J Infect Dis 40: 373–380.
36. Franken WP, Koster BF, Bossink AW, Thijsen SF, Bouwman JJ, et al. (2007)
Follow-up study of tuberculosis-exposed supermarket customers with negative
tuberculin skin test results in association with positive gamma interferon release
assay results. Clin Vaccine Immunol 14: 1239–1241.
37. Yoshiyama T, Harada N, Higuchi K, Nakajima Y, Ogata H (2009) Estimation
of incidence of tuberculosis infection in health-care workers using repeated
interferon-gamma assays. Epidemiol Infect: 137(12): 1691–8.
8
December 2009 | Volume 4 | Issue 12 | e8517
Keep reading this paper — and 50 million others — with a free Academia account
Used by leading Academics

Judit Kis-Halas
Independent Researcher

Samuel LÉZÉ
École Normale Supérieure de Lyon

Denise L Spitzer
University of Alberta

Pablo Wright
Universidad de Buenos Aires