THE CHILD AND ADOLESCENT SOCIAL
PERCEPTION MEASURE
Joyce MagilI-Evans, Cyndie Koning, Anne Cameron-Sadava, and
Kathy M a n y k
ABSTRACT.. Tests currently available for measuring children's sensitivity to nonver-
bal aspects of communication have been criticized on methodological and conceptual grounds. The Child and Adolescent Social Perception Measure (CASP) was
developed to meet the need for a clinically useful measure which examines social
perception within a semi-naturalistic context. The CASP consists of I0 videotaped
scenes, each of which lasts 19-40 seconds. The verbal content was removed
through electronic filtering so that the ability to receive and interpret nonverbal
social cues could be measured without bias from verbal cues. Children are shown
the scenes and then questioned about the emotions portrayed. Based on standardization with 212 children and adolescents ages 6 to I.5 years old, reliability (interrater, test-retest, internal consistency) and initial validity information are reported.
Social perception or social sensitivity is a complex process which involves both sensory mechanisms (to attend to and register social cues
through vision, hearing, touch) and mechanisms to accurately interpret or
make sense of the verbal and nonverbal cues provided by social partners
(Morrison & Bellack, 1981). Trimboli and Walker (1993) state that it is very
difficult to accurately interpret verbal messages without attending to the
accompanying nonverbal cues. The social perception skills of children and
adolescents affect their ability to interact effectively. Several researchers
have clearly demonstrated the relationship between social perception skills
and social competence (e.g., Blanck, Buck, & Rosenthal, 1986; Custrini &
Portions of this paper have been presented at the Congress of the World Federation of
Occupational Therapists, London, England, 1994, and at the joint conference of the Canadian
and American Occupational Therapists, Boston, 1994.
We acknowledge funding from the Glenrose Rehabilitation Hospital Research Grants
Program. We thank each of the actors and actresseswho generously volunteered their time to
produce the videotape; the students and teachers in the schools who participated in the collection of the normative data; and the research assistantswho worked many hard hours to
make this all possible (Janet L Smith, Kara Ryan, Dixie McLean, Kate Murie, Taslim Pardhan).
Correspondence should be addressed to J. MagilI-Evans, Department of Occupational Therapy, Room 2-64 Corbett Hall, University of Alberta, Edmonton, Alberta, Canada, T6G 2G4.
Journal of Nonverbal Behavior 19(3), Fall 1995
9 1995 Human Sciences Press, Inc.
1 5~
�152
JOURNAL OF NONVERBAL BEHAVIOR
Feldman, 1989; Feldman, White, & Lobato, 1982). For example, children
with high sociometric status had higher emotion recognition scores for facial expressions than children who were less popular (Edwards, Manstead,
& MacDonald, 1984).
Researchers have examined the social perception skills of children
with psychopathology and impairments in their peer interactions in comparison to children without social skill deficits (Russell, Stokes, Jones,
Czogalik, & Rohleder, 1993; Shapiro, Hughes, August, & Bloomquist,
1993; Zabel, 1979). These studies have provided evidence that children
with psychopathology have deficits in social perception. Children with
nonverbal learning disabilities (Rourke, 1988; Semrud-Clikeman & Hynd,
1990), right-hemisphere deficit syndrome (Voeller, 1986), learning disabilities (Wiig & Harris, 1974), and Asperger's Syndrome (Wing, 1981 ) are also
reported to have difficulty judging the affective state of others. It would
appear that difficulties in social perception may impair the child's ability to
interact effectively with peers. Few of these researchers, with the exception
of Voeller (1986), have reported using any standardized measurement of
social perception and appear to rely on clinical jud[~ment. Thus, there is a
need for a measure of social perception which can be used with these
types of children and adolescents in a clinical setting.
The Development of Social Perception
Studies of the development of social perception have found positive
correlations between both cognitive ability and age and the ability to recognize photographed facial expressions of emotion. McAIpine, Singh, and
Kendall (1991) reported that 12- and 13-year-old children were significandy better at recognizing facial expressions than 5- and 6-year-olds and
8- and 9-year-olds. Philippot and Feldman (1990) found that recognition of
happiness, sadness, and fear increased from ages 3 to S with happiness
recognized by all S-year-olds, but sadness was recognized by only ,5466% of 5-year-old children. A significant increase in children's abilities to
recognize nonverbal cues from grades 1 to S was reported by Nowicki and
Duke (1994). Rosenthal and associates (Rosenthal, Hall, DiMatteo, Rogers,
& Archer, 1979) also found a significant linear trend in the scores of children from grades 3 to 6 on the Profile of Nonverbal Sensitivity (PONS).
Others (Feldman et al., 1982; Morency & Krauss, 1982; Wiggers & Van
Lieshout, 198S) have supported the increasing ability to accurately identify
the emotional state of others with age. This increased ability is not due
solely to increased expressive vocabulary as some studies asked the chil-
�153
J. MAGILL-EVANS, C. KONING, A. CAMERON-SADAVA, K. MANYK
dren to choose from lists of emotions ratl~er than generating their own label
in a free-response format.
Providing a label (e.g., happy, angry) for an expression of emotion is
more difficult than choosing the appropriate label from those provided
(e.g., choosing the happy face, choosing between the words happy, angry).
This skill also improves with age. One of the earliest researchers in this
area (Gates, 1923) asked children ages 3 to 14"what the person in the
photograph was doing and how the person felt. The children's answers
were compared to adults' interpretations. Gates noted an increasingly correct labeling of emotions with age and changes in the types of emotions
recognized at different ages. More recently, Harrigan (1984) found an increase in the ability to label six emotions with. age. Accuracy was 48% for
3-year-olds, 62% for 6-year-olds, 73% for 9-year-olds, and 82% for 12year-olds.
Gestures, body movements, and physical proximity also express emotions nonverbally. Boyatzis and Satyaprasad (1994) found that 4- and
5-year-olds were 60% accurate (adjusted for chance) in matching six gestures with the appropriate vignette. Rosenthal and associates (1979) found
that children in grades 3 to 6 were increasingly accurate on the PONS in
interpreting gestures, postures, and voice cues, a finding supported by the
work of Nowicki and Duke (1994) with children from grades 1 to 5. Little
other research has been done to examine the developmental progression in
understanding these cues (Boyatzis & Satyaprasad, 1994).
As children mature, they are better able to receive and make sense of
contradictory messages. Typically-developing preschool children are aware
of affective and situational information and can acknowledge different
messages from two sources such as verbal tone and facial expression. Children's ability to explain why conflicting messages occur together changes
with age. Lightfoot and Bullock (1990) found that preschoolers provided an
explanation for only one of the messages. Second and fourth graders had
mixed response types although half integrated the two messages by applying one explanation to both messages. Older children and adults integrated
the two messages into a single interpretation. Wells and Higgins (1989)
found that preschoolers used descriptions of the situation and statements
about the feelings of the person to explain incongruent affective and situational cues, while 8-year-olds were more likely to use explanations which
inferred previous events or possible future states. Gnepp (1983) found that
while preschoolers can receive both cues, they prefer to make inferences
based on facial expression. Sixth graders used both facial and situational
cues to make inferences and were likely to reconstruct the meaning of
facial expressions to fit the verbal message.
�154
JOURNAL OF NONVERBAL BEHAVIOR
There may be differential rates of development of social perception
associated with gender. Gates (1923) found small though inconsistent differences. Hall (1978, 1984), in a review of studies of adults and at least 12
studies of children, concluded that females were better at decoding nonverbal cues and that an age and gender interaction effect was absent indicating that the "female advantage at judging nonverbal cues is stable"
(1978, p. 854). Rosenthal and associates (1979) reported that girls in grades
3 through high school did better than boys on the PONS. Some recent
studies (e.g., Nowicki & Duke, 1994) have not reported differences by gender or minimal differences (Beck & Feldman, 1989; Holder & Kirkpatrick,
1991). Boyatzis and Satyaprasad (1994) did not find gender differences on
emotion decoding in preschool children. Because of the possibility of gender differences, care was taken to include equal numbers of males and
females in the development of the Child and Adolescent Social Perception
measure (CASP) presented in this article.
In summary, social perception is related to social competence and is
an important area to assess in children with disabilities. Normally, social
perception abilities improve with age (Rosenthal et al., 1979). Therefore,
any new measure of social perception should be sensitive to change with
increasing age. This aspect of the CASP was examined and is discussed in
the Results section.
Measures of Social Perception
Recent literature has examined the usefulness and validity of measures
of sensitivity to nonverbal cues. Followin8 a careful review, Trimboli and
Walker (1993) concluded that existing measures for adults and children
were inadequate for conceptual and methodological reasons. Earlier researchers such as Hall (1984) had also raised concerns about the possibility that the methods being employed misht be inappropriate for use in
examining ongoing interactions. New measures and methods were ne.eded
that avoid the following problems. Most measures of social perception
have limited applicability to children (Costanzo & Archer, 1989; Trimboli
& Walker, 1993) and are appropriate for a limited ranse of ages (McAIpine
et al., 1991). The methodology used in much of the research to measure
social perception has focused primarily on children's ability to accurately
identify emotional states from cues such as facial expressions. Many measures assess one source of information such as the child's ability to label
facial expressions (Bullock & Russell, 1984), to identify contextual cues
(Reichenbach & Masters, 1983), or to assign labels to tone of voice (Boyatzis & Satyaprasad, 1994). Three 8roups of researchers (Nowicki & Duke,
1994; Rosenthal et al., 1979; Shapiro et al., 1993) have developed mea-
�155
.I. MAGILL-EVANS, C. KONING, A. CAMERON-SADAVA, K. MANYK
sures of social perception which assess several components of social perception separately. Although contextual information is believed to play a
significant role in how nonverbal cues are interpreted (Walker & Trimboli,
1989), little research has included this aspect of social perception or addressed social perception as the synthesis of information from different
channels.
Only one measure, the Interpersonal Perception Task (Costanzo & Archer, 1989), was located which provided information from verbal and nonverbal cues in real-life situations. This measure has only been used with
adults and, in our view, it was not appropriate for children (e.g., one ques-.
tion is "Who is the higher status person?"; a response category used twice
is "they are lovers who hav~ been together for.
"). Given
the lack of measures which attempt to assess children's abilities to interpret
social cues from several nonverbal sources simultaneously, it was felt that
another measure was needed.
Method
Development of the CASP
The CASP was developed to provide a standardized assessment of the
child's ability to interpret social cues from many sources simultaneously.
The measure is based on a model of social interaction proposed by Doble
and MagilI-Evans (1992). Social perception as measured with the CASP is
operationally defined as the ability to attend to and infer emotional states
from nonverbal cues such as facial expression, gestures, tone of voice, and
context.
The CASP is designed for use in a clinical setting with children and
adolescents with mental health problems. To avoid some of the concerns
about earlier measures, the criteria used to guide the development process
specified that the CASP should:
1. Reflect the complexity of interactions by assessing the ability to infer
emotions from facial expression, tone of voice, gestures, postures,
and situational cues occurring simultaneously. Other measures (e.g.,
Nowicki & Duke, 1994; Rosenthal et al., 1979; Shapiro et al., 1993)
present each component separately or in limited combinations.
2. Require children to generate responses rather than choosing from a
list of possible answers (e.g., McAIpine et al., 1991, Nowicki &
Duke, 1994) as this more closely resembles what happens in interactions and allows the scorer to determine where the source of errors
may lie.
�156
JOURNAL OF NONVERBAL BEHAVIOR
3. Measure the number and type of cues that children recall using to
infer emotions in order to determine if certain cues are routinely ignored or misinterpreted.
4. Portray types of situations children and adolescents commonly encounter.
5. Be suitable for use with children ages 6-15 years without basement
and ceiling effects. Other measures (e.g., Nowicki & Duke, 1994;
Shapiro et al., 1993) are limited to children ages 6 to 11 years.
6. Be easy to administer, requiring no more than 30 to 45 minutes,
making it practical to use.
7. Have standardized scoring and provide reliability and validity information in the manual.
8. Be sensitive to change due to intervention or development.
Clinical experts in child and adolescent psychiatry (including the test
authors) developed a pool of 77 scenes based upon experience and the
existing literature. The scenes were then evaluated by independent clinical
experts in child and adolescent psychiatry who had not helped generate
the scenes. These three people rated the scenes on characteristics such as
how often children would be exposed to the type of situation described
and the importance of being able to understand the nonverbal communication in such a situation.
Based on these reviews, the 30 most frequently encountered situations
which relied on nonverbal cues for accurate interpretation were chosen for
filming. A producer was told what they were intended to portray. Children
and adolescents were selected by audition from lists supplied by a local
television company, a local theatre company, and from school drama
classes. Fourteen actors (9 females, 5 males; 12 Caucasian, 1 Asian, 1 Aboriginal) participated (2 of the Caucasians were adults). Because the focus
was on nonverbal communication, there were no scripts used for filming.
The actors and actresses provided their own dialogue making the situations
as natural as possible.
Trials were conducted to determine which method to use in removing
the verbal content while maintaining the tonal qualities (see Rosenthal et
al., 1979). Five adults with normal hearing listened to passages filtered at
different frequency levels to determine how much verbal content could be
understood. The best result was obtained by filtering the content using the
Butterworth Series 900 at 300 Hz for males and 350 Hz for females and
one young boy.
Five scenes were filmed and tested with nine children to ensure that
the methodology elicited the kinds of responses anticipated. The remaining
scenes were then filmed. A pilot study using the 30-scene version was
�157
J. MAGILL-EVANS,C. KONING, A. CAMERON-SADAVA, K. MANYK
done with eight children, resulting in six.scenes being deleted for reasons
such as poor portrayal of the scene and technical difficulties in recording.
The remaining scenes were divided by the test developers into two 12scene versions which were roughly equivalent on dimensions such as types
of emotions portrayed, number of actors/scene, estimated difficulty in understanding the situation using only nonverbal cues, and type of situation.
Each version was tested with 15 children. Based" upon a review of the
psychometric properties of the 24 different scenes (e.g., correlation with
age; correlation with total score; interscene correlations; interrater agreement), ten scenes were used to create the current version of the CASP. The
children's responses from the pilot study were used to provide exemplars of
responses for the answer key.
Description of the CASP
The CASP consists of 10 videotaped scenes which are described in
Appendix A. Each scene lasts 19-40 seconds (M = 29). There are two to
four characters per scene. Most scenes were filmed from one camera angle
(two scenes have two camera angles) and all were without close-ups so
that attention is not artificially directed to any one person. The scenes occur in a range of settings (e.g., home, school) with a range of emotions
(positive/negative/neutral) and a range of emotional intensities. One scene
(Scene 2) has definite incongruent situational and affective cues (a child
opening a gift and being unhappy). This scene was included to determine
which cues the child attended to (situation or facial expressions and gestures) and to explore the strategies used to resolve the incongruence (e.g.,
ignoring one cue; reconstructing the meaning of one cue). Because resolving incongruent cues is difficult for younger children (e.g., Lightfoot & Bullock, 1990), inclusion of more than one such scene might have made the
CASP too difficult for younger children.
The test is administered individually using a videorecorder and television and requires approximately 40 minutes (range: 20-85) to administer
due to the need to write down the responses. After each scene is shown,
questions in a standardized protocol (see Appendix B) are used to ask the
child to describe what happened in the scene, what each of the people is
feeling (e.g., sad), and how he or she could tell the person is feeling that
way (e.g., frowning).
An answer key was developed based on the actors' descriptions of
emotions they felt they portrayed in the scene, the test developers' review
of the scenes, the responses of three independent judges (clinical experts in
child and adolescent psychiatry), and responses of children in the pilot
studies. Two scores are obtained:
�158
JOURNALOF NONVERBALBEHAVIOR
. The emotion score, based on identification of each character's feelings in each scene. The child's responses are scored as: accurate (2
points), partially correct (1 point), or wrong/too vague/omitted (0
points). In order to ensure that children with limited labeling abilities
are not penalized, nonstandard wording may be used to identify
emotions (e.g., "yuck" or "grossed out" is accepted for "disgusted").
Scene scores are added to get a Total Emotion Score (TES). The maximum possible score is 85 (based on number of emotions portrayed in
all 10 scenes; in 5 instances, 1 is the maximum score for a character
who does not display any apparent emotion).
. The nonverbal cues score, based on giving one point for each nonverbal cue category which is correctly mentioned for each character
in each scene. The nonverbal cues are categorized into facial cues,
body cues, voice cues such as tone or rate, and cues related to the
context (e.g., gettin 8 a present). For example, if the child mentions a
facial cue (e.g., could tell how he was feeling "by his face") and
there is a facial cue listed on the answer key, the child receives one
point, if the child then elaborates and says "he was smiling" when
the character was actually frowning, the descriptor is noted as wrong
and commented on in the qualitative section but the child still scores
one point. Thus, the child's cues score reflects his/her attention to
cues, whether accurate or inaccurate. Qualitative information on the
misinterpretations of these cues may be of particular significance
clinically. Scene scores are added to obtain a Total Cues Score (TCS).
The maximum possible score is 134. This is based on 1 point for
each cue category (range 2-4/emotion) used to portray each of the 46
emotions.
Qualitative information about the manner in which the child responds to the measure is also obtained. This includes the child's projections of his or her own feelings, the ability of the child to attend to the
video and recall information, the child's response pattern (e.g., giving
many unrelated answers in a "shotgun" approach), knowledge of labels
of emotions, the ability to accurately integrate the individual cues in
scenes such as the one with the incongruent cues, interactions with the
examiner, unusual descriptions of emotions, and general speech and
language skills. The information obtained relates to Doble and MagillEvans' (I 992) model of social interaction and is used to guide intervention approaches.
To begin measuring the validity of the CASP, the measure was used
with a sample of typically developing children. Two hypotheses related
to construct validity were tested:
�159
J. MAGILL-EVANS, C. KONING, A. CAMERON-SADAVA, K. MANYK
I. Social perception as measured by scores on the CASP increases with
age of the respondent.
2. Scores on the CASP are not significantly correlated with a child's
expressive vocabulary (to be valid, the CASP must measure something other than expressive language abilities).
Participants
A total of 212 children drawn from seven schools representing the
range of socio-economic status and ethnicity within Edmonton, Alberta,
Canada completed the CASP. Children who spoke English as a second language or were funded for special needs (for social, emotional, physical, or
academic delay) were excluded from the study. Approximately 14% of the
participants were non-Caucasian (e.g., Aboriginal, Asian, black, etc.)
which is similar to the proportion in the general population in the Edmonton area. The children ranged in age from 6 to 15 years old (M = 10.5; 5D
TABLE 1
Total Scores by Age Group and Gender: Means and Standard Deviations
Cues scores b
Emotion scores 9
Age group
Ages 6, 7
Boys
Girls
Ages 8, 9
Boys
Girls
Ages I 0, 11
Boys
Girls
Ages 12, 13
Boys
Girls
Ages 14, 15
Boys
Girls
n
M
(SD)
M
(5D)
44
924
20
41
20
21
44
19
25
42
21
21
41
19
22
20.1
19.6
20.7
28.9
25.5
32.1
35.3
33.9
36.4
45.8
43.3
48.4
51.2
50.1
52.1
(5.8)
(6.0)
(5.7)
(8.2)
(4.2)
(9.7)
(8.7)
(9.3)
(8.1)
(9.1)
(8.6)
(9.2)
(8.0)
(9.4)
(6.6)
25.2
23.4
27.4
36.5
32.7
40.0
45.0
42.4
47.0
53.0
52. I
53.9
59.9
59.1
60.6
(8.6)
(9.2)
(7.3)
(12.7).
(I 0.1 )
(I 4.1 )
(I 1.2)
(9.4)
(I 2.3)
(I 3.3)
(I 4.8)
(I 1.9)
(I 0.4)
(I 1.7)
(9.4)
'Possible range: 0-86
bPossible range: 0-134
�160
JOURNAL OF NONVERBALBEHAVIOR
= 2.9) and were in grades one to ten (s6e Table 1). There were 103 males
and 109 females with approximately 10 males and females at each age.
Fourteen of the children (6 males, 8 females) completed the CASP
twice (see results). They ranged in age from 7 to 13 years of age (M = 9.8).
Forty-three of the other children (19 males, 24 females) ages 8 to 11 (M =
10) also completed the Expressive One Word Picture Vocabulary Test-Revised (EOWPVT-R) (Gardner, 1990). The EOWPVT-R was designed as a
quick measure of a child's expressive abilities and was normed on 1,118
children ages 2 to 12 years. It is correlated with age (r = .80), with the
Peabody Picture Vocabulary Test-Revised (r = .59, N = 1030), and the
WlSC-R vocabulary subscale (r =.47, N = 684). The split-half reliability
ranges from .84 to .92 with a median of .90.
Procedures
Five research assistants (three graduate students, two persons with undergraduate degrees) were trained to administer the CASP. Each reached
85% agreement or better with one other research assistant prior to starting
data collection. One graduate student was a qualified speech pathologist
who also administered and interpreted the EOWPVT-R. Data were collected over eight months and testing generally occurred in each child's
school. In five cases, testing was done in the child's home.
Pairs of research assistants independently rated audiotapes of 17 assessments and independently scored the CASP while it was being administered to 24 other children. The children ranged in ages from 6 to 15 years
(NI = 11.1). The correlation coefficients between the pairs of testers for
both the TES and the TCS were .95 (p < .001). There were no significant
differences between the scores assigned by each rater in the pair. For individual scenes, correlations ranged from .72 to .94 and all were significant
at p < .001. The intra-class correlation coefficient (ICC) for the TES for one
pair of testers was .94 and for the second pair, .99. For the TCS, the ICCs
were .96 and .94. Raters can reach high levels of agreement on the scoring
of the children's responses using the scoring guide and following training
procedures outlined in the manual.
Results and Discussion
Difficulty Level
The mean score for the Total Emotion Score was 36 (SD = 13.8, range
= 8-65). For individual scenes, the maximum possible score was obtained
�161
J. MAGILL-EVANS,C. KONING,A. CAMERON-SADAVA,K. MANYK
by at least one person for seven of the ten scenes. Scene difficulty as measured by the proportion of the sample who responded correctly ranged
from .27 to .62, close to the desired range of .30 to .70 (Martuza, 1977).
The mean "Total Cues Score was 44 (5D = 16.6, range = 2-82). There
were two scenes on which the maximum score possible was obtained by at
least one person. Scene difficulty ranged from .28 to .51. Because of the
relatively large amount of nonverbal information i'n each scene, it was not
expected that anyone would be able to attend to or recall all of the available information. All cues must be included in the scoring as any type of
cue may be mentioned. This raises the total score possible and decreases
the proportion correct.
Internal Consistency
Cronbach's coefficient alpha was .88 for the Total Emotion Score and
.92 for the Total Nonverbal Cues Score. This level of consistency indicates
unidimensionality of the measure (Martuza, 1977). Correlations between
scenes for TES ranged from .23 to .57 and for TCS from .28 to .68 indicating that no scene provided the same information as another scene.
Test-Retest Reliability
On average, the time between testing was 51 days (range: 30-66
days). The 14 children (ages 7-13) required an average of eight minutes
less to complete the CASP the second time it was administered. The testretest correlation coefficient was .83 (p < .001) for the Total Emotion Score
and .87 for the Total Cues Score. Correlation coefficients for individual
scenes ranged from .22 to .74 with the exception of one scene which had a
correlation of - . 0 2 for the emotion score. This would indicate that the
CASP needs to be administered in its entirety. While the total test score is
fairly stable, scene-specific scores are more variable. Because of the small
sample size, test-retest reliability needs further exploration.
Construct Validity
Hypothesis 1 stated that scores on the CASP were expected to increase
with age as the child's perceptual and information processing abilities improve. What was less clear was whether there would be marked differences between genders in social perception abilities as measured by the
CASP. Therefore, the relationships of the CASP scores to age and gender
were examined. Total emotion scores were significantly correlated with
age, r (211) = .82, as were total nonverbal cues scores, r (211) = .73.
�162
JOURNALOF NONVERBALBEHAVIOR
A multivariate analysis of variance '(MANOVA) with age (10 levels
from age 6 to 15) and gender (male, female) as between-subjects variables
and the TES and TCS as dependent variables was done. There were significant main effects of age and gender for both the TES and the TCS and no
significant interactions for age and gender which is consistent with the
literature (e.g., Hall, 1978). For age, the post-hoc univariate F-tests were
F(9, 192) = 50.9, p < .001 for TES and F(9, 192) = 28.2, p < .001 for
TCS. Older children scored higher than younger children. For gender, the
results were F(I, 192) = 11.4, p = .001 for TES (effect size using rof .24)
and F(I, 192) = 6.6, p = .011 for TCS (effect size using r of .18). Girls had
higher mean scores than boys (girls = 38.2, 46.1; boys = 33.8, 41.2). The
scores of girls and boys at each age are shown in Table 2. At three ages (7,
TABLE 2
Scores for Boys and Girls: Means and Standard Deviations
Cues scores
Emotion scores
Age group
Age 6: Boys
Girls
Age 7: Boys
Girls
Age 8: Boys
Girls
Age 9: Boys
' Girls
Age 10: Boys
Girls
Age 11 : Boys
Girls
Age 12: Boys
Girls
Age 13: Boys
Girls
Age 14: Boys
Girls
Age 15: Boys
Girls
n
M
(SD)
M
(SD)
10
10
14
10
10
11
10
10
9
15
10
10
10
10
11
11
10
12
9
10
14.7
18.3
23.1
23.1
27.0
32.1
23.9
32.1
31.3
37.6
36.2
34.6
41.2
45.945.2
50.6
50.3
50.0
49.9
54.7
(3.2)
(5.0)
(4.9)
(5.6)
(4.4)
(12.7}
(3.7)
(5.7)
(8.7)
(8.4)
(9.7)
(7.8)
(9.1)
(7.5)
(8.1)
(10.3)
(12.4)
(6.6)
(5.1)
(5.9)
18.2
24.7
27.1
30.1
38.2
38.1
27.3
42.1
41.8
47.4
42.9
46.4
51.4
52.7
52.8
54.9
57.4
58.4
60.9
63.2
(9.4)
(7.8)
(7.3)
(6.0)
(10.2)
(17.0)
(6.9)
(10.7}
(9.6)
(13.0)
(9.7)
(11.7)
(16.4}
(12.3)
(14.0)
(12.0)
(12.9)
(8.6)
(10.6)
(10.0)
�163
J. MAGILL-EVANS,C. KONING,A. CAMERON-SADAVA,K. MANYK
11, 14), boys had scores equal to or higher than 8iris. on the TES. This lack of
marked differences at each age may be due to the small numbers and needs
to be re-examined once the normative sample is larger. At present, scores in
the CASP manual are reported with boys and girls together for each age
grouping (see Table 1). However, the findings related to gender differences
and the associated effect sizes are consistent with the earlier literature (e.g.,
Hall, 1984). It is expected that as the size of the normative sample increases,
it may be necessary to have separate norms for girls and boys.
Hypothesis 2 dealt with the relationship of CASP scores and a child's
expressive vocabulary (as measured using the EOWPVT-R). Forty-three
children completed the EOWPVT-R (Gardner, 1990). The mean score for
the children tested in this study was 111.58 (SD = 9.7). There was
no significant difference between genders. The standard scores on the
EOWPVT-R were not significantly correlated with the TES, ~42) = .11, or
the TCS, ~42) = .07. This would indicate that the CASP is measuring
something more than the child's vocabulary related to social perception.
A principal components analysis using an oblique rotation was also
performed to determine the number of factors which were present in the
measure. Sixteen of the 20 scores from the TES and TCS loaded on one
factor suggesting the unidimensionality of the measure. This result needs to
be confirmed with a larger sample and with a clinical population. The fact
that scores from both the scales tended to load on one factor and the fact
that the TES correlated with the TCS at .88 would suggest that it may be
possible to use one score (the TES) as an indicator of social perception for
typically-developing children. Part of this strong association is due to the
fact the TCS questions are not even asked unless the child is able to identify an emotion in the scene.
TheTCS does offer some unique information, although this result
needs to be confirmed. A MANOVA using age group (5 levels: ages 6 & 7;
8 & 9; 10 & 11 ; 12 & 12,; 14 & 1.5) and gender as between-subjects variables and the four categories of nonverbal cues (face, voice, body, situational cues) as dependent variables was done. There were significant main
effects for age group and gender with no interaction effects. For age group,
the post-hoc univariate F-tests were significant (p < .001) for face, body,
and voice cues with Fs(4, 202) = 9.2, 96.5, and 30.0 respectively. Older
children scored higher than younger children, similar to the findings of
Nowicki and Duke (1994). Older and younger children were equally likely
to mention information about the situation. For gender, the results were
significant only for body cues, F(1,202) = 5.3, p = .022. More girls reported information related to the body which is consistent with findings by
Rosenthal and associates (1979) for children in grades 3 to 6.
�164
JOURNAL OF NONVERBAL BEHAVIOR
Two of the test developers are currentl~ conducting a study to examine
other issues related to the validity of the CASR The study examines the
ability of the CASP to distinguish between adolescents of normal IQ with
known social perception deficits (identified as having symptoms consistent
with a diagnosis of Asperger's Disorder or Autistic Spectrum Disorder) and
adolescents without social perception deficits. To date, only data on 15
males ages 12 to 15 with social perception deficits are available. Preliminary analyses indicate that the TES and the TCS are not significantly correlated with the receptive, expressive, or total language scores of the Clinical
Evaluation of Language Fundamentals-Revised (Semel, Wiig, & Secord,
1987). The mean TES is greater than 1.5 standard deviations below the
mean for boys ages 12 to 15 in the normative sample. The mean TCS is
greater than 3 standard deviations below the mean. The TES and TCS
scores were not significantly correlated (p = .35). Although the results are
very preliminary, the different results for the two scores indicates that, with
a clinical population, information which is useful for guiding intervention
may be obtained from both scores.
Clinical Utility
In order to be useful for identifyin8 children and adolescents who require additional attention and intervention, it is important to have some
standards against which to compare the child's performance on the CASP.
To ensure a sample size of 40 per 8roup, adjacent age groups (e.g., age 6
and 7, see Table 1) were combined in order to ensure a sample size of 40
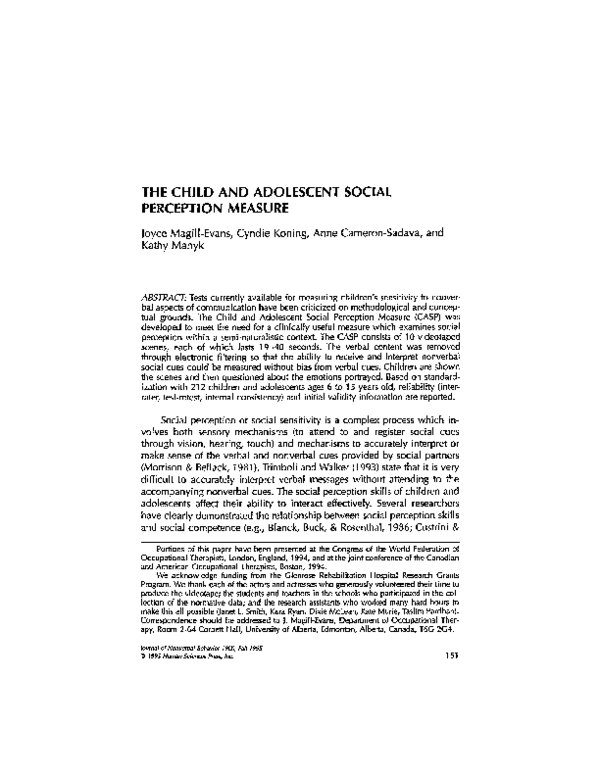
per group. There is a clear developmental progression in the scores (see
Figure 1). For the TES and TCS, each age group was significantly different
from each adjacent group (usin 8 a post-hoc Tukey-B test). However, it must
be remembered that the number of children in each abe group is relatively
small and care must be taken in interpreting the scores. The number of
children in each group will be increased as the scale is used and additional
scores are added to the data base.
To date, the CASP has been used with approximately 100 children and
adolescents with mental health problems and is reported to be useful with
this population. Children who need social skills training which focuses
specifically on social perception abilities are identified. The CASP scores
appear to be sensitive to change when used to assess children with known
social deficits who are part of an intensive intervention program aimed at
improving social perception skills. A case study by Koning, Manyk, MagillEvans, and Cameron-$adava (1995) reported that the CASP scores of a 13year-old male with Tourette's Disorder and Asperger's Disorder improved
�165
J. MAGILL-EVANS,C. KONING,A. CAMERON-SADAVA,K. MANYK
70
I~ Emotion Score
Cues Score
60
1
~
5O
~
40
:~
30
20
10
0
6&
8&9
10&11
Age Group (years)
12&13
14&15
Figure 1. Means for total emotion and nonverbal cues scores.
following intervention. More information on this aspect of the CASP is
needed.
Limitations
As with any measure in the early stages of development, the CASP has
limitations. These are primarily related to the size and representativeness of
the normative sample. The CASP was developed in Alberta, Canada and
this may limit the user's ability to identify persons with social perception
deficits who reside in different geographical areas or belong to different
cultural backgrounds. Despite efforts to include actors from diverse backgrounds, the CASP portrays primarily nonverbal communication used by
people who are Caucasian. The normative sample did not include children
with cognitive or learning difficulties as defined by the educational setting
in which they were tested. Children who spoke English as a second language or children with language difficulties were not included. Caution
must be used in interpreting the results for these groups of children. The
role of attention and short term memory skills in successful performance on
the CASP has not been studied systematically.
The results should be interpreted with caution until further normative
data have been collected and more studies of the CASP's psychometric
properties are completed (e.g., test-retest reliability with a larger sample; a
factor analysis with a larger sample and a clinical sample; concurrent validity). It is not yet clear whether the CASP has the ability to discriminate
�166
JOURNAL OF NONVERBAL BEHAVIOR
between diagnostic groups and predict f~nctioning in real life situations,
although studies to address some of these areas are underway. The CASP
measures only one aspect of social functioning and should be used in combination with measures of other aspects which employ a range of methodologies (e.g., rating scales, interviews, observations, reports of others).
This will allow the examiner to obtain a more accurate and complete picture of the child's abilities and needs.
Conclusion
The CASP is an evaluation tool which yields information about the child's
and adolescent's ability to interpret nonverbal cues in social situations. Initial data support its reliability. Construct validity has begun to be addressed. There is a clear increase in scores on the CASP with age. Social
perception is reported to increase with maturation during childhood. The
scores on the CASP cannot be explained by the child's vocabulary. The
CASP can be used clinically to assess children and adolescents with social
problems to determine whether or not deficits in social perception are a
contributing factor. With this knowledge, intervention can be provided
which specifically addresses the identified deficits in social perception and
the possible causes of those deficits. The CASP can be used to evaluate
changes in social perception abilities following interventions. Although the
measure is still in the early stages of development, it appears to hold promise as a clinically useful measure.
References
Beck, L., & Feldman, R. S. (1989). Enhancing children's decoding of facial expression. Journal
of Nonverbal Behavior, 13, 269-278.
Blanck, P. D., Buck, R. W., & Rosenthal, R. (1986). Nonverbal communication in the clinical
context. University Park, PA: Pennsylvania State University Press.
Boyatzis, C. J., & Satyaprasad,C. (1994). Children's facial and gestural decoding and encoding: Relations between skills and popularity. Journal of Nonverbal Behavior, 18, 37-.55.
Bullock, M., & Russell,J. A. (1984). Preschool children's interpretation of facial expressions of
emotion. International Journal of Behavioral Development, 7, 193-214.
Costanzo, M., & Archer, D. (1989). Interpreting the expressive behavior of others: The Interpersonal Perception Task. Journal of Nonverbal Behavior, 13, 225~245.
Crick, N. R., & Dodge, K. A. (1994). A review and reformulation of social information-processing mechanisms in children's social adjustment. Psychological Bulletin, 115, 74-101.
Custrini, R. J., & Feldman, R. S. (1989). Children's social competence and nonverbal encoding
and decoding of emotions. Journal of Clinical Child Psychology, 18, 336-342.
Doble, S., & MagilI-Evans, J. (1992). A model of social interaction to guide occupational
therapy practice. Canadian Journal of Occupational Therapy, 39, 141-150.
�167
J. MAGILL-EVANS, C. KONING, A. CAMERON-SADAVA, K. MANYK
Edwards, R., Manstead, A., & MacDonald, C. J. (1984). The relationship between children's
sociometric status and ability to recognize facial expressionsof emotion. European Journal of Social Psychology, 14, 235-238.
Feldman, R. S., White, J. B., & Lobato, D. (1982). Social skills and nonverbal behavior. In R. S.
Feldman (Ed.), Development of nonverbal behavior in children (pp. 259-277). New York:
Springer-Verlag.
Gardner, M. (1990). Manual for the Expressive One-Word Pictdre Vocabulary Test-Revised.
Novato, CA: Academic Therapy.
Gates, G. S. (1923). An experimental study of the growth of social perception. Journal of
Educational Psychology, 14, 449-461.
Gnepp, J. (1983). Children's social sensitivity: Inferring emotions from conflicting cues. Developmental Psychology, 19, 805-814.
Hall, J. (1984). Nonverbal sex differences: Communication accuracy and expressive style.
Baltimore: John Hopkins University Press.
Hall, J. (1978). Gender effects in decoding nonverbal cues. Psychological Bulletin, 85, 845-857.
Harrigan, J. (1984). The effects of task order on children's identification of facial expression.
Motivation and Emotion, 8, 157-169.
Holder, H., & Kirkpatrick, S. (1991). Interpretation of emotion from facial expressions in children with and without learning disabilities. Journal of Learning Disabilities, 24, 170-177.
Koning, C., Manyk, K., MagilI-Evans, J., & Cameron-Sadava, A. (1995). Application of the
social interaction model and use of the CASP: A case study. Manuscript submitted for
publication.
Lightfoot, C., & Bullock, M. (1990). Interpreting contradictory communications: Age and context effects. Developmental Psychology, 26, 830-836.
Martuza, V. R. (1977). Applying norm-referenced and criterion-referenced measurement in
education. Boston: Allyn & Bacon.
McAIpine, C., Singh, N., & Kendall, K. (1991). Development and validation of videotaped
role plays of six basic facial expressionsof emotion. Bulletin of the Psychonomic Society,
29, 117-120.
Morency, N. L., & Krauss, R. M. (1982). Children's nonverbal encoding and decoding of
affect. In R. S. Feldman (Ed.), Development of nonverbal behavior in children (pp.
181-199). New York: Springer-Verlag.
Morrison, R. I., & Bellack, A. S. (1981). The role of social perception in social skills. Behavior
Therapy, 12, 69-79.
Nowicki, S., & Duke, M. P. (1994). Individual differences in the nonverbal communication of
affect: The Diagnostic Analysis of Nonverbal Accuracy Scale. Journal of Nonverbal Behavior, 18, 9-35.
Philippot, P., & Feldman, R. S. (1990). Age and social competence in preschoolers' decoding
of facial expression. British Journal of Social Psychology, 29, 43-54.
Reichenbach, L., & Masters, J. C. (1983). Children's use of expressive and contextual cues in
judgments of emotion. Child Development, 54, 993-104.
Riggio, R. E. (1986). Assessmentof basic social skills. Journal of Personality and Social Psychology, 51, 649-660.
Rosenthal, R., Hall, J., DiMatteo, M. R., Rogers, P. L., & Archer, D. (1979). Sensitivity to
nonverbal communication: The PON5 test. Baltimore: John Hopkins University Press.
Rourke, B. (1988). The syndrome of nonverbal learning disabilities: Developmental manifestations
in neurological disease,disorder and dysfunction. Clinical Neuropsychologist, 2, 293-330.
Russell, R., Stokes, J., Jones, M. E., Czogalik, D., & Rohleder, L. (1993). The role of nonverbal
sensitivity in childhood psychopathology. Journal of Nonverbal Behavior, 17, 69-83.
Semel, E., Wiig, E., & Secord, W. (1987). Clinical Evaluation of Language FundamentalsRevised. San Antonio: Psychological Corporation.
Semrud-Clikeman, M., & Hynd, G. (1990). Right hemisphere dysfunction in nonverbal learning disabilities: Social academic and adaptive functioning in adults and children. Psychological Bulletin, 107, 196-209.
�168
JOURNAL OF NONVERBALBEHAVIOR
Shapiro, E., G., Hughes, S. ]., August, G., & Bloomquist, M. L. (1993). Processingof emotional
information in children with attention-deficit hyperactivity disorder. Developmental Neuropsychology, 9, 207-224.
Trimboli, A., & Walker, M. (1993). The CASTTestof nonverbal sensitivity. Journal of Language
and Social Psychology, 12, 49-65.
Voeller, K. K. (1986). Right-hemisphere deficit syndrome in children. American Journal of
Psychiatry, 143, 1004-1009.
Walker, M., & Trimboli, A. (1989). Communicating affect: The role of verbal and nonverbal
content. Journal of Language and Social Psychology, 8, 229-248.
Wells, R. S., & Higgins, E. T. (1989). Inferring emotions from multiple cues: Revealing agerelated differences in "how" without differences in "can." Journal of Personality, 57,
747-771.
Wiggers, M., & Van Lieshout, C. (1985). Development of recognition of emotions: Children's
reliance on situational and facial expressivecues. Developmental Psychology, 21, 338349.
Wiig, E., & Harris, S. R (1974). Perception and interpretation of nonverbally expressedemotions by adolescentswith learning disabilities. Perceptual and Motor Skills, 38, 239-245.
Wing, L. (1981). Asperger's syndrome: A clinical account. Psychological Medicine, 11, 115129.
Zabel, R. H. (1979). Recognition of emotions in facial expressions by emotionally disturbed
and nondisturbed children. Psychology in the Schools, 16, 119-126.
Appendix A: Description of Scenes
1.
Guy's Story - One boy is telling a story which he finds humorous to another
boy. A girl sitting with them is disgusted by the story. (Duration = 24 sec.)
2. Birthday Gift - A woman gives a teenage girl a gift. The girl is excited when
receiving the gift but her~expression changes to disappointment when she sees
the gift. The girl hides her disappointment. (Duration = 40 sec.)
3. Nintendo - A girl is playing a video game when another girl accidentally
bumps the cord and disconnects the game. The girl playing the game is annoyed and the other girl apologizes. (Duration = 35 sec.)
4. Water Fountain Conversation - A boy is excitedly telling a story to a girl. A
second boy approaches them. The pair respond with disinterest which the girl
masks with politeness. The second boy becomes uncomfortable and leaves.
The pair return to their intense conversation. (Duration = 35 sec.)
5. Boy and Morn - A mother is working in the kitchen. Her son enters, telling an
exciting story. As the mother listens, she becomes shocked. She rebukes the
boy who becomes subdued. (Duration = 24 sec.)
6. Test-takers - Three girls and a boy are seated in a classroom. The students then
hand in their tests to the teacher. The boy hands in his test with confidence.
One girl appears worried. The other two girls have neutral expressions. (Duration = 22 sec.)
7. Lunchroom o A girl seated at a table is joined by a boy who is very angry. She
tries to calm him down. The boy becomes ca|met and begins to relax. (Duration = 28 sec.)
�169
]. MAGILL-EVANS, C. KONING, A. CAMERON-SADAVA, K. MANYK
8.
9.
10.
Trio - Two girls and a boy walk behind a b.uilding with a can of beer. One girl
is nervous and uncomfortable while the others are excited. When one girl is
reluctant to drink, the other two try to pressure her to drink. (Duration = 37
sec.)
Schoolmates - A girl is seated at a desk. Another girl enters and begs her to
lend her a piece of work. The seated girl reluctantly lends the work to the
other girl's relief. (Duration = 26 sec.)
Busy Parents - A mother and father are working on'bills. Their son enters the
room expectantly but leaves looking annoyed when his parents ignore him.
(Duration = 19 sec.)
Appendix B: Test Protocol
I am going to show you some segments of a videotape. They are all different.
They are not part of the same story. The sound has been changed so you wilt not be
able to hear exactly what the people are saying. Don't worry if it sounds strange.
After each segment, I Will ask you some questions about what each of the .people
were feeling in the scene. The scenes are short. People may have more than one
feeling in a scene. Pay close attention to what is going on. I will write down your
answers so I can remember what you said.
Do you have any questions?
(AFTER THE SCENE IS SHOWN)
Tell me what happened in that scene.
Allow the child to respond and describe the scene. If the child DOES NOT mention
all of the emotions felt by all the characters or fails to mention a character ask:
What were each of the people feeling? Tell me everything they were feeling.
For each emotion identified repeat the following questions:
How could you tell that (the girl) was feeling (sad)?
character
use child's words
�
 Joyce Magill-evans