Ibis (2007), 149, 575–586
Blackwell Publishing Ltd
Do voles make agricultural habitat attractive to
Montagu’s Harrier Circus pygargus?
BEN J. KOKS, 1 CHRISTIANE TRIERWEILER, 1,2* ERIK G. VISSER, 1
COR DIJKSTRA 3 & JAN KOMDEUR 2
1
Dutch Montagu’s Harrier Foundation, PO Box 46, 9679 ZG Scheemda, Netherlands
2
Animal Ecology Group, Centre for Ecological and Evolutionary Studies, University of Groningen,
PO Box 14, 9750 AA Haren, Netherlands
3
Behavioural Biology, University of Groningen, PO Box 14, 9750 AA Haren, Netherlands
Loss and degradation of habitat threatens many bird populations. Recent rural land-use
changes in the Netherlands have led to a shift in habitat use by breeding Montagu’s Harriers
Circus pygargus. Since the 1990s, unprecedented numbers of this species have bred in
farmland compared with numbers in natural habitat. Destruction of nests by agricultural
operations, however, compromises breeding success. Between 1992 and 2005, the number
of breeding pairs in the northeastern Netherlands was positively, though weakly, correlated
with previous-year estimated abundance of voles, mostly Microtus arvalis. In good vole years,
the onset of laying was earlier and mean clutch size was larger. Vole abundance was relatively
higher in set-aside land and in high and dense vegetation. We suggest that agri-environmental
schemes aimed at increasing the availability of voles in agricultural breeding areas may be
an effective management tool for the conservation of Montagu’s Harriers in the northeastern
Netherlands.
In recent decades, many bird populations have
declined in Europe and worldwide (Tucker & Heath
1994, Norris & Pain 2002). One of the principal
causes of these declines has been habitat loss (e.g.
Owens & Bennett 2000, Bruford 2002, Newton
2004). Large areas of natural habitat have been lost
from Europe, where many bird species have become
increasingly reliant on farmland habitats (Tucker
1997). One such species is Montagu’s Harrier Circus
pygargus (Arroyo et al. 2002), the conservation status
of which is vulnerable because more than half of its
global population is found in Europe (Burfield & Van
Bommel 2004). Montagu’s Harrier is included in
Annex I of the European Birds Directive (79/409/
EEC), which lists species that are classified as particularly threatened and in need of special conservation
measures.
European Montagu’s Harriers are long-distance
Palearctic migrants, traditionally breeding in lowland
heaths, dunes, hay-meadows and (pseudo-) steppes
(Clarke 1996, Leroux 2004). Since the 1990s, 70–90%
*Corresponding author.
Email: christianetrierweiler@yahoo.com
© 2007 The Authors
Journal compilation © 2007 British Ornithologists’ Union
of breeding pairs in Western Europe have bred in
agricultural habitats (Arroyo et al. 2002). With
intensification of land use, the percentage of Harriers
breeding in farmland is also expected to increase in
Eastern Europe. Montagu’s Harriers are opportunistic
predators (Arroyo 1997) and, in vole-rich habitats,
feed mainly on voles. Up to 90% of their diet in
Western France (Butet & Leroux 1993, Salamolard
et al. 2000) and around 60% in Dutch farmland
consisted of voles (Koks et al. 2005).
Montagu’s Harriers breeding in farmland, however,
may experience lower breeding success than those in
more natural habitats. Between 20 and 70% of nests
of this ground-nesting species can be destroyed
during harvesting activities (Corbacho et al. 1997,
Koks et al. 2001, Millon et al. 2002). In the Netherlands, lucerne (alfalfa) is mown repeatedly and early
in the season (starting in May–June), which means
that clutches in this crop do not survive and even
breeding females can be killed during the harvest.
Nests in early harvested winter barley and winter
wheat are at risk as well. In the Netherlands, nests are
protected by leaving a 10 × 10-m unharvested area
around nests and placing electric fences around the
remaining vegetation to exclude terrestrial predators.
�576
B. J. Koks et al.
Nest protection in the Netherlands has proven to be
successful (Koks & Visser 2002), and farmers are
willing to participate without financial compensation.
Nest protection, however, is still very resourceconsuming in terms of time, manpower and equipment
(Arroyo et al. 2002).
Montagu’s Harriers were widespread and numerous (500–1000 pairs) in the Netherlands until the
beginning of the 20th century (Zijlstra & Hustings
1992). The Dutch population originally nested in
natural vegetation and, during the 1970s and 1980s,
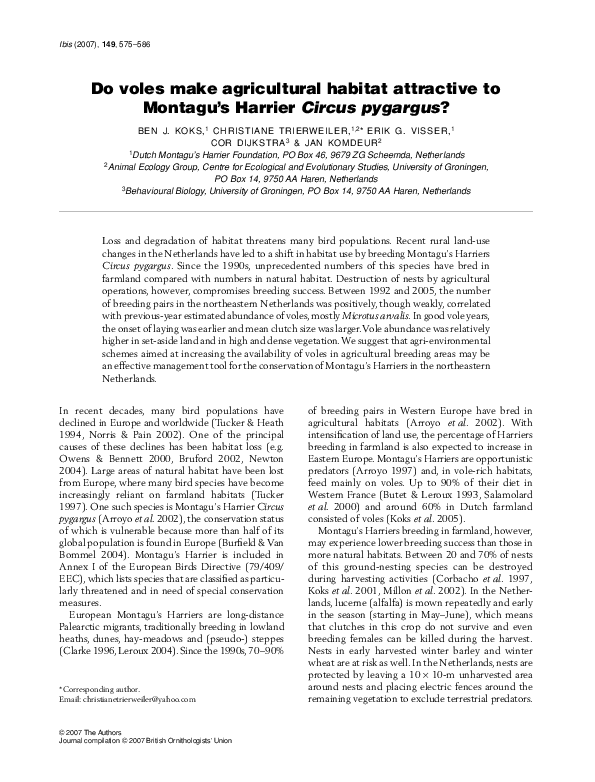
in deciduous tree plantations (Fig. 1). By 1987, the
population had declined to near extinction (Fig. 1;
Zijlstra & Hustings 1992). In the early 1990s, however,
Montagu’s Harriers were observed regularly in
agricultural habitat in the eastern part of the province
of Groningen (northeastern Netherlands). During
this period, vole numbers in farmland in East
Groningen increased rapidly, following increases in
agricultural set-aside. In 1988, 10–20% of farmland
in this area was set aside according to European
agricultural policy (Koks & Van Scharenburg 1997,
Robson 1997). Numbers of Common Voles Microtus
arvalis in the resulting fallow grassland increased
rapidly, and vole-eating raptors such as Hen Harrier
Circus cyaneus, Montagu’s Harrier, Common Kestrel
Falco tinnunculus and Short-eared Owl Asio flammeus
settled in East Groningen (Koks & Van Scharenburg
1997).
This study presents information derived from the
East Groningen population. Ecological information
and knowledge of population trends is crucial for
Figure 1. Total number of Montagu’s Harrier pairs in different
breeding habitats in the Netherlands, 1975–2005 (n = 836)
(Zijlstra & Hustings 1992, Bijlsma 1994, Dutch Montagu’s Harrier
Foundation unpubl. data).
© 2007 The Authors
Journal compilation © 2007 British Ornithologists’ Union
effective conservation management (e.g. Green 2002,
Underhill & Gibbons 2002, Komdeur & Pels 2005,
Whittingham et al. 2005), and for the development
of conservation strategies required by EU agrienvironmental policy (Ormerod & Watkinson 2000,
Fox 2004). We investigated (1) the relationship of
vole abundance with the number of Harrier pairs
present in the study area and Harrier breeding
parameters, (2) the importance of voles in the Harrier
diet and (3) the relationship between vegetation
characteristics and vole abundance. This information
can be used to determine which vegetation types
support high densities of Montagu’s Harrier prey,
and as a result, may attract higher numbers of Harriers
and sustain better breeding performance than other
vegetation types. Management of Harrier prey populations via habitat management may be an alternative
conservation strategy to intensive nest protection.
METHODS
Study area and study population
The study site was located in the eastern part of the
province of Groningen, northeastern Netherlands
(53°11′N, 7°4′E, surface area of c. 650 km2). The
relatively uniform, flat and open polder landscape
of East Groningen is mainly used for cultivation of
winter wheat but also for other land uses including
pasture and cultivation of lucerne, sugar beet, oilseed
rape and winter barley.
Montagu’s Harriers in East Groningen constituted
about two-thirds of the Dutch population between
2000 and 2005 (172 out of the total 229 pair-years,
Dutch Montagu’s Harrier Foundation unpubl. data).
The remaining pairs were located in the province of
Flevoland (29 pair-years, also in agricultural breeding
habitat), the Lauwersmeer nature reserve (26 pairyears) and in other areas (2 pair-years).
Harrier pairs and nests were located each year
(1990–2005) through observation of birds showing
territorial, mating or nesting behaviour. The total
number of pairs present in the study area was divided
into pairs that bred (successfully or not), pairs that
were territorial but did not breed and pairs of
unknown breeding status. A minority of males were
bigamous, e.g. three out of 27 males (11%) in East
Groningen in 2005. Monogamous and bigamous
pairs were treated in the same way for the analyses,
because the breeding parameters we used were
measured per nest, not per individual. Individual
birds were distinguished by colour rings and plumage
�Montagu’s Harrier in agricultural habitat
characteristics. The annual finite population growth
rate λ was calculated according to the formula λ =
nt+1/nt (Sibly et al. 2003), where nt+1 was the total
number of pairs in the following year and nt was the
total number of pairs in a given year. Linear regressions
were calculated using SPSS version 12.0.1 (SPSS Inc.).
Known nests were visited on average three times
during a breeding season (May–July). The purpose of
the first visit was to find the nest, the second visit was
made in order to check the number of young, and the
third visit was made to ring the young and measure
them (weight, wing length, claw with and without
nail, eye colour, number of fault bars). The estimated
clutch size at laying was a minimum, as we could not
exclude the possibility of partial predation. If the
clutch was incomplete during the first visit, laying
date could be back-calculated assuming eggs had
been laid every second day (Clarke 1996). For nests
which were first visited in the nestling phase, nestling
growth curves were used to calculate the age of the
young and to back-calculate approximate laying
dates (Bijlsma 1998). Means are denoted ± se.
Clutches in fields that were harvested before the
fledging of the young were protected. An electric
fence prevented terrestrial predators from entering
the nest patch. Additional nest visits were made to
check the battery of the protection fence. Protected
clutches that would have been destroyed without
intervention had the same probability of producing
at least one young as clutches that did not require
protection (probability of 63% (56/89) vs. 60%
(164/274), Dutch Montagu’s Harrier Foundation
unpubl. data).
Precautions were taken to minimize any risk of
desertion and exposure to predation due to nest visits.
Nests were only visited in the early stages of nesting
when this was necessary in order to protect them.
Care was taken not to leave a trail in the crop. Nest
desertion caused by our visits was only observed in
four pairs out of 172 pair-years in East Groningen
(1990 –2005). These were nests in lucerne that had to
be visited at a very early stage to prevent destruction
by harvesting activities. In two cases, the nest was
empty (before the start of laying) and in the other
two, the nest contained one egg.
We used laying date and clutch size as measures of
adult reproductive performance. In raptors, earlier
laid clutches have a higher chance of producing
young, and larger clutches can produce more young
(e.g. Daan et al. 1990). Laying date affects the
chances that young will be produced, regardless of
additional effects of nest protection and predation.
577
Clutch size reflects the investment of the female in
egg production, and the investment both parents
will have to make to rear the young. In this study
(investigating the relationship between reproductive
performance and food supply), fledging success is
not a useful measure: the number of fledglings
produced not only depends on the available food,
but also on nest protection and predation.
Vole abundance and vegetation
measures
Each year from 1992 to 2005 (except in 2002), the
abundance of small mammals during the first week
of August was estimated. The missing abundance in
2002 was estimated from the regression equation of
vole index vs. proportion of small mammals in pellets
based on biomass (1994, 1996–2001, 2003–05). The
proportion of small mammals in pellets was arcsine
square-root transformed before regression with the
vole index (regression line: y = 0.72 + 0.03*vole
index; F = 3.2, df = 1, P = 0.1). Although the relationship between vole index and the proportion of small
mammals in pellets was a statistically non-significant
trend, we assume it represents a biologically meaningful way to produce an estimate for the 2002 vole
abundance, especially as 2002 was a year with a low
proportion of small mammals in pellets and had the
lowest estimated vole index (according to the above
model). In order to ensure that our estimated value
did not overly influence the results, analyses involving
vole index were also performed without the 2002
data. Results were broadly similar, in terms both of
significance levels and of parameter estimates in the
regression equations.
Small mammals were trapped according to a
standard protocol (Dijkstra et al. 1995, Hörnfeldt
2004): five snap traps were baited with carrots and
arranged in a circle of diameter 4 m, if present near
vole runways or burrows, forming one station. One
transect comprised ten stations spaced 10 m apart.
On average, 14 ± 1 transects were checked annually
on three consecutive days. If transect vegetation type
had not changed, the same transect was measured in
consecutive years; otherwise, new transects were
chosen. Transects were located in different habitats,
grouped in two categories. Category one included
non-fallow vegetation types, i.e. roadsides, ditch
edges, wood plantations and plantation edges,
cereals (wheat, barley), grassland, grass seed, old
dyke used as pasture, lucerne, grassy path, and small
sample sizes of grazed nature reserve and sugar beet.
© 2007 The Authors
Journal compilation © 2007 British Ornithologists’ Union
�578
B. J. Koks et al.
Category two included fallow vegetation types, i.e.
set-aside land under different management regimes.
This category comprised whole set-aside fields
(remaining fallow for more than 5 years) and field
margins, which were managed according to agrienvironmental schemes. Margins set aside under
these schemes remain fallow for 6 years, and must
comply with set mowing, fertilizer and pesticide/
herbicide restrictions.
Almost all small mammals trapped (1845/1866)
were identified to species level. Of these (n = 1845),
92% were Common Voles (other species trapped: 4%
Apodemus sylvaticus, 3% Sorex araneus, 1% Micromys
minutus, 1% Clethrionomys glareolus, and < 1% Microtus
agrestis and Mus musculus). As most small mammals
trapped were voles, ‘small mammals’ are hereafter
referred to as ‘voles’.
To produce a vole index, a multilevel logistic
regression model with a logit link function (Quinn &
Keough 2002, Rasbash et al. 2004) was fitted to the
vole capture success data (average value over 50
traps and three trap nights for each transect in each
year, n = 177), using the program MLwiN version
2.02 (Multilevel Models Project, Institute of Education, University of London). The estimation method
was second-order penalized quasi-likelihood (PQL)
and parameter estimates were calculated by Residual
Iterated Generalized Least Squares (RIGLS; Snijders
& Bosker 1999). Level one represented the observations, level two years (1992–2005) and level three
unique transect numbers. Year was also added as a
fixed effect (categorical variable). The second fixed
effect tested was habitat type (fallow or non-fallow).
Statistical significance of the effects was determined
by Wald tests (the Wald statistic follows a χ 2
distribution). Trapping probabilities were calculated
from the model including year as well as habitat
type. These probabilities were multiplied by 100 to
derive a vole index, i.e. an estimate of the number of
voles trapped in 100 trap nights.
We tested whether sampling the same transect in
multiple years affected the number of voles trapped.
For this, we used a similar multilevel logistic
regression model as for the vole index. This model
contained two explanatory variables: habitat type
(β = 0.77 ± 0.21, Wald statistic = 13.4, df = 1, P =
0.0002) and the number of years an individual plot
was sampled (1–12 years, β = 0.006 ± 0.04, Wald
statistic = 0.02, df = 1, P = 0.8). There was no negative
effect of the number of years a transect was sampled
on the number of voles trapped, indicating that the
data were not biased by destructive sampling.
© 2007 The Authors
Journal compilation © 2007 British Ornithologists’ Union
In 2003–05, vegetation height and cover of all
vole trapping transects were measured. Vegetation
height was measured by dropping a polystyrene disc
(diameter 45 cm, height 1.5 cm) on the vegetation,
along a tubing which was calibrated with a centimetre
scale. Vegetation cover was assessed visually over a
20 × 20-cm square as the percentage of the area that
was covered by live or dead vegetation. Vegetation
height and cover were measured ten times at random
locations within each transect. To establish the effects
of vegetation height and cover on trapping probabilities, a multilevel model was fitted to the subset of
data (n = 52) for which information on vegetation
structure was available (2003–05). The model fitted
was two-level (level 1, observation; level 2, year)
because sample sizes were too small to include
transect number as a third level.
Harrier diet
During each week of each breeding season (end of
April until beginning of August, 1992–2005), perch
posts, field margins and paths along ditches near
nest-sites were checked for pellets. Pellet sample size
differed between years, so in order to exclude the
confounding effect of sample size, we included data
only from years with sample sizes of at least 150
pellets in our analyses (1994, 1996–2005). Pellets were
stored (dry) and processed at the end of the season.
The minimum number of individual prey per pellet
was counted. All prey individuals present in pellets
were assigned to prey categories (according to taxon)
and, if possible, species and age class, using characteristics of fur, teeth, feathers and other remains with
the help of identification literature (Jenni & Winkler
1994, Lange et al. 1994, Kapteyn 1999) and reference
collections. For the resulting 97 taxon, species and age
categories, an average mass was available (data from
Schipper 1973, Arroyo 1997 and Dutch Montagu’s
Harrier Foundation unpubl.). Prey numbers in each
category were multiplied by average biomass of the
category to calculate its proportion of total biomass.
Five main categories of prey in pellets (npellets =
3353) were distinguished: ‘small mammals’, ‘larger
mammals’, ‘birds’, ‘eggs’ and ‘invertebrates’. Of the
‘small mammals’ category, 1917 out of 3128 prey
items were sorted into taxonomic groups: voles
made up 95%, mice 4% and shrews 1%. Of items
identified to species level in this category, 95% were
Common Voles (1539/1620) and 5% belonged to
other species (3% Micromys minutus, 1% Apodemus
sylvaticus, and (all < 1%) Sorex araneus, Mus musculus,
�Montagu’s Harrier in agricultural habitat
Clethrionomys glareolus, Microtus agrestis and Sorex
minutus). In the ‘larger mammals’ category, 145 out
of 169 items were identified to species level, of
which 70% were Brown Hares Lepus europaeus, 15%
Rabbits Oryctolagus cuniculus, 14% Moles Talpa
europaea and 1% Brown Rats Rattus norvegicus. From
960 prey items categorized as ‘birds’, 88% were
passerines (mostly Yellow Wagtails Motacilla flava,
Meadow Pipits Anthus pratensis and Skylarks Alauda
arvensis) and 22% were other birds, such as Northern
Lapwings Vanellus vanellus and Quails Coturnix
coturnix. The remaining categories were ‘eggs’ (of
passerines and other bird species) and ‘invertebrates’
(mostly Coleoptera, Orthoptera and Odonata spp.).
In 2003, prey delivery was observed at one nest.
The nest was located in lucerne and protected. A
hide was placed outside the nest protection fence at
6 m from the nest. Observations were conducted by
one observer (C.T.) during the nestling phase (10 July
–2 August). A total of 13 observations were made,
with an average duration of 8.5 h. Prey delivered by
the parents was filmed with a video camera and
analysed subsequently. To test whether diet revealed
by pellet analysis reflected diet as shown by video
579
tape, the results of the video analysis were compared
with prey items identified from pellets collected on
the same nest in the same period.
RESULTS
Vole abundance, Harrier population
growth and breeding parameters
Annual differences in vole index were statistically
significant (Table 1). The vole index showed two
major peaks, in 1992 and 2004 (Fig. 2a). The total
number of Montagu’s Harrier pairs in the study area
increased steeply up to 1993, decreased between
1993 and 1996, and increased more or less steadily
after this time (Fig. 2a). Most of these pairs were
breeding pairs (Fig. 2b). Vole index in year t was not
significantly correlated with the total number of
Harrier pairs, the number of breeding pairs or the
number of non-breeding pairs in the same year (Linear
regression, total number: F = 0.02, df = 1, P = 0.90;
breeding: F = 0.72, df = 1, P = 0.4; non-breeding:
F = 0.08, df = 1, P = 0.8). However, the relationship
between vole index in year t and the total number of
Table 1. Multilevel logistic regression model for average vole capture success per transect per year (n = 177). Predictions of the model
multiplied by 100 produced the vole index (estimated vole number trapped per 100 trap nights).
Explanatory
variable
Fixed part
Intercept
Year
1992
1993
1994
1995
1996
1997
1998
1999
2000
2001
2003
2004
2005
Habitat type
Non-fallow
Fallow
Random part
Year level
Transect level
n (for year:
transects, for habitat
type: transect-years)
β
(se)
−2.12
(0.38)
10
14
12
12
11
11
13
13
10
13
19
21
18
Reference
−2.46
(0.47)
−2.53
(0.50)
−2.40
(0.50)
−2.14
(0.50)
−2.67
(0.51)
−1.53
(0.47)
−1.36
(0.46)
−1.89
(0.51)
−3.30
(0.52)
−1.22
(0.43)
−0.51
(0.41)
−2.21
(0.49)
84
93
Reference
0.88
(0.25)
Wald
statistic
df
P
30.39
97.37
1
12
< 0.0001
< 0.0001
17.83
2.03
1.83
1.96
2.28
1.36
4.11
4.82
2.75
0.77
5.54
11.04
2.21
12.29
0.79
0.34
(0.14)
(0.15)
Vole index
(voles/100 nights)
1
0.0005
2.81
6.31
31.29
4.98
1
1
< 0.0001
0.03
© 2007 The Authors
Journal compilation © 2007 British Ornithologists’ Union
�580
B. J. Koks et al.
Figure 2. (a) Number of Montagu’s Harrier pairs (including non-breeding pairs and pairs of unknown breeding status) in East Groningen,
Netherlands. Vole index (no. trapped/100 nights) in East Groningen (1992–2001, 2003–05) with estimated vole index of 2002 (closed
circle in parenthesis). The dashed line indicates the threshold value (2.3) of vole index above which population growth was predicted to
be positive (λ > 1) (Fig. 3a). The grey surface indicates vole indices above this line (years relatively rich in voles). (b) Percentages of
breeding pairs, non-breeding pairs and pairs of unknown breeding status of the total number of Montagu’s Harrier pairs in East Groningen
(1990–2005).
pairs in year t + 1 approached statistical significance
(F = 3.8, df = 1, P = 0.08). Furthermore, the annual
finite population growth rate λ from year t to year
t + 1 (based on the total number of pairs) was
positively correlated with vole index in year t
(Fig. 3a). Above a threshold vole index of 2.3 in year
t, population growth was predicted to be positive
(λ > 1). The relationship of λ with vole abundance
in year t − 1 was not significant (F = 0.7, df = 1, P =
0.4); the relationship between λ and the vole index
in year t + 1 approached statistical significance
(F = 4.5, df = 1, P = 0.06).
Clutches were laid significantly earlier in years
with a high vole index (Fig. 3b) and clutches were
significantly larger in years with a high vole index
(Fig. 3c). Clutch size at laying was significantly
negatively correlated with laying date (n = 144,
F = 74.8, df = 1, P < 0.0001).
Voles in Harrier diet
In terms of both numbers and biomass, small mammals were the most important prey category found
in pellets (Fig. 4a & b). The average percentage of
small mammals in the diet, based on numbers found
in the pellets of adults, was 61 ± 4% (1994, 1996–
2005) with a range of 41% (1994) to 78% (1998).
The average percentage of small mammals based on
biomass was 52 ± 4% with a range of 30% (1994) to
75% (1998). Larger mammals were more important
in terms of biomass (on average 23 ± 2%) than in
© 2007 The Authors
Journal compilation © 2007 British Ornithologists’ Union
terms of numbers (4 ± 1%). On average, birds
constituted 21 ± 2% of items found and 22 ± 3% of
biomass. Smaller prey categories (eggs and invertebrates) were less important, especially in terms of
biomass. Video observations at one nest (n = 78
items identified) suggested that small mammals
made up 83% of ingested biomass of juveniles, compared with 55% biomass as assessed from pellets of
juveniles (n = 35 items identified, Fig. 5). Larger
mammals were not observed from video playback but
accounted for 21% of biomass (1/35 items) as assessed
from pellets. Birds constituted 17% of biomass
based on video observations and 24% based on pellet
analysis. Invertebrates were a minor dietary component according to data from both video and pellets,
especially in terms of biomass (both less than 1%).
The number and biomass of small mammals estimated
from video observation was higher than from pellet
analysis, and larger mammals and birds were more
often recorded in pellets. Small mammals were, as for
adults, the most important diet component.
Vole abundance, vegetation type and
vegetation structure
The vole index was more than twice as high in fallow
habitat types as in non-fallow types (Table 1).
Additionally, significantly larger numbers of voles
were trapped both in higher and in more dense
vegetation, even when controlling for vegetation
type (Table 2). Vegetation height and cover were
�Montagu’s Harrier in agricultural habitat
581
Figure 4. Diet of adult Montagu’s Harriers: (a) prey categories in
pellets (1994, 1996–2005) as percentage based on numbers
and (b) based on biomass.
Figure 3. (a) Annual finite population growth rate λ (λ = nt+1/nt
based on the total number of Montagu’s Harrier pairs, n = 13) vs.
vole index (vi, no. trapped/100 nights) at time t (1992–2004).
λ = 0.9 + 0.02*vi; F = 5.7, df = 1, P = 0.04. Dashed line indicates
threshold value of vole index (vi = 2.3) above which population
growth was predicted to be positive (λ > 1). (b) Annual average
laying date (ld) expressed as day number starting at 1 May vs.
vole index at time t (1992–2005). Linear regression analysis on
individual laying dates (n = 204): ld = 26.2 − 0.5*vi; F = 13.0,
df = 1, P < 0.0001. (c) Annual average clutch size (cs) at laying
vs. vole index at time t (1992–2005). Linear regression analysis
on individual clutch sizes (n = 168): cs = 3.5 + 0.06*vi; F = 13.6,
df = 1, P < 0.0001. Open circles are values for 2002 based on
estimated vole index.
Figure 5. Diet of Montagu’s Harrier nestlings: prey categories as
percentages based on numbers and biomass recorded on video
at the nest (n = 78 prey items) and found in pellets collected on
the same nest during the same period (n = 35 prey items).
© 2007 The Authors
Journal compilation © 2007 British Ornithologists’ Union
�582
B. J. Koks et al.
Explanatory
variable
Fixed part
Intercept
Habitat type
Non-fallow
Fallow
Vegetation height
Vegetation cover
Random part
Year level
n
(transect-years)
β
Wald statistic
df
P
156.20
8.72
1
1
< 0.0001
0.003
Reference
0.42 (0.14)
0.03 (0.004)
0.01 (0.003)
36.93
5.25
1
1
< 0.0001
0.02
0.89
16.97
1
< 0.0001
−3.78
25
27
(se)
(0.30)
(0.22)
significantly correlated (F = 6.9, df = 1, P = 0.01).
Percentage cover was variable in short vegetation,
but was consistently high in tall vegetation.
DISCUSSION
Fluctuations in vole abundance
No regular vole cycles could be distinguished in East
Groningen (1992–2005), in contrast to observations
of vole cycles in (semi-)natural areas in the Netherlands (e.g. Dijkstra et al. 1988, Beemster & Dijkstra
1991, Bijlsma 2005). Agricultural management
may have interfered with natural fluctuations of vole
abundance in the study area: from 1992 onwards,
long-term, large-scale fallow land disappeared, and
short-term, small-scale set-aside land increased due
to new agri-environmental schemes realized after
the MacSharry reform of the European Common
Agricultural Policy.
Harrier population growth in relation to
vole abundance
We found no relationship between Montagu’s Harrier
numbers and vole abundance in the same year. Such
a relationship has been observed for Montagu’s
Harrier in western France (Salamolard et al. 2000),
for other vole-eating raptors, such as Hen Harrier
(Hamerstrom 1979, Redpath et al. 2002) and Common Kestrel (Village 1990), and for various owl species
(Village 1981, 1987, Korpimäki 1985, Hörnfeldt
et al. 1990, Taylor 1994). The growth rate of the
Harrier population from year t to year t + 1, however,
was positively though weakly correlated with the
vole index in year t. This cannot be explained by
an increase in recruits born in year t as Montagu’s
© 2007 The Authors
Journal compilation © 2007 British Ornithologists’ Union
Table 2. Multilevel logistic regression
model for average vole capture success
per transect per year (n = 52) for transects with known vegetation structure
(2003–05).
Harriers only rarely return to the breeding grounds
in their second calendar year, and usually start
breeding in their third calendar year (Clarke 1996).
In the East Groningen population, only one second
calendar year bird (a female) was observed to breed.
An increase in population size from locally born
recruits might be expected 2 years after a good vole
year, but we found no evidence of a relationship
between λ and vole index in year t − 1. This is probably
due to the low philopatry of the species (Arroyo et al.
2004), including the East Groningen population.
Despite the fact that all young fledged from known
nests since 1999 have been colour ringed, birds
known to be of local provenance comprise a relatively
small proportion of breeders in East Groningen (e.g.
13% (5/38) in 2005). This suggests that we are not
dealing with a closed population in East Groningen,
and that there is movement to and from adjacent
subpopulations of the northwestern European Montagu’s Harrier population in northern Germany
(Lower Saxony, Schleswig-Holstein) and southern
Denmark. This is confirmed both by the rapid
increase of Montagu’s Harrier pairs in East Groningen
from three pairs in 1990 to 20 pairs in 1992 (many
of these birds must have come from outside the
Netherlands, as by 1987 the Dutch population
was virtually extinct), and by ring recoveries and
resightings of Dutch birds breeding in Germany and
German birds breeding in the Netherlands (Koks &
Visser 2002, Trierweiler et al. 2006b).
The relationship between the number of Harrier
pairs and the vole index of the previous year suggests
that Montagu’s Harriers can use information on vole
abundance from the previous year when deciding
where to settle and breed after returning from their
West African wintering grounds in spring. Harriers
could be attracted to the area when food conditions
�Montagu’s Harrier in agricultural habitat
were good in the previous year, but settle in another
subpopulation when food conditions were poor, as
annual vole densities tend to vary synchronously
over relatively large areas (Newton 1998). Harriers
could also be attracted to areas where conspecific
reproductive success was high the previous year
(Arroyo et al. 2002), as a result of ‘public information’
(Valone & Templeton 2002). During a satellite
telemetry study, two Dutch Montagu’s Harrier
females have been observed passing through breeding
areas of neighbouring Harrier populations during
autumn migration, which could be a mechanism of
‘prospecting’ (Trierweiler et al. 2006a). Finally, adult
survival could be positively related to vole abundance,
with lower survival and fewer returning adults in
years following poor vole years.
Harrier breeding parameters in relation to
vole abundance
Vole numbers in summer can be considerably higher
than at the time when Montagu’s Harrier breeding
territories are established (Dijkstra et al. 1988). It has
been shown that spring vole abundance is positively
correlated with summer vole abundance of the same
year (Butet & Leroux 2001). We assume that our
summer estimates can be used to indicate food
availability some months earlier, when laying date
and clutch size are determined.
The onset of laying was earlier in good vole years,
a relationship that has also been observed in other
vole-eating raptors, such as Hen Harrier (Simmons
et al. 1986), Common Kestrel (Meijer et al. 1988)
and several owl species (Wijnandts 1984, Hörnfeldt
et al. 1990, Taylor 1994). Clutches laid earlier in
the season tended to be larger, as was observed in a
Montagu’s Harrier population in northeastern France
(Millon et al. 2002) and in other raptor species
(Wijnandts 1984, Village 1990, Taylor 1994, Dijkstra
& Zijlstra 1997). Consequently, clutches were larger
in good vole years, as has been found for Montagu’s
Harriers in western France (Salamolard et al. 2000,
Butet & Leroux 2001) and Hen Harriers in southern
Scotland (Redpath et al. 2002). In Common Kestrels,
both laying date and clutch size correlate with
measures of adult fitness (Daan et al. 1990). Vole
abundance affected both laying date and clutch size
in our study population, so if these variables are also
related to fitness in Montagu’s Harrier, creating good
vole habitats may have a positive impact on numbers
of this species. However, Harrier productivity is
also affected by other factors, such as agricultural
583
practices, nest protection, predation and weather
conditions. In summary, our data indicate that annual
vole abundance can affect timing (laying date) and
effort (clutch size) of Montagu’s Harrier reproduction
and perhaps influence local settlement in the following
year.
Voles as vital food source
The influence of vole abundance on Montagu’s Harrier
reproduction is probably due to the importance of
voles in the diet. The results of video analysis, which
found that voles constitute up to 85% of nestling
diet, are comparable with those of a similar study on
a population in cultivated land in southern France,
where voles made up 72% of nestling diet (Maurel
& Poustomis 2001). Although the results of pellet
analysis suggest a lower proportion of voles in the
diet (55%), both analyses confirm the importance of
voles to nestlings in the East Groningen population.
In the 1960s and 1970s, Schipper (1973) found that
small mammals made up only 5–29% of prey items
identified from nests in natural habitat, where the
diet was dominated by birds. Differences between the
diets of these Harriers and Harriers in East Groningen
are likely to reflect differences in prey availability.
Only two decades after Schipper’s study, Dutch
Montagu’s Harriers mostly chose not only different
breeding habitats, but also different prey.
Agri-environmental schemes:
possibilities for management of Harrier
food supply
Set-aside habitats in East Groningen were generally
more vole-rich than non-fallow types, as was found
in western France (Butet & Leroux 1989). Certain
types of set-aside can constitute very high-quality
habitat for Common Voles (Jacob 2003, Briner et al.
2005). Positive effects of set-aside land on biodiversity
and abundance of different taxa can be reinforced by
increasing the area set aside and the duration for
which it is left fallow (Van Buskirk & Willi 2004).
These and other characteristics of set-aside land such
as vegetation height, mowing regime and the seed
mixtures with which it is sown can be manipulated
through appropriate agri-environment schemes.
Vole abundance is highest in tall, dense vegetation,
but voles in such cover are less available to hunting harriers (Simmons 2000, Vulink 2001). Vole
availability to harriers could be increased through
appropriate mowing management. Mowing does not
© 2007 The Authors
Journal compilation © 2007 British Ornithologists’ Union
�584
B. J. Koks et al.
in itself lower vole survival significantly, but by
reducing cover, it makes the voles more vulnerable
to predators (Jacob 2003). Regular partial mowing
schemes could be employed to increase the availability
of voles to hunting harriers.
Harrier conservation in the agricultural
landscape
Agricultural habitat is attractive for Montagu’s
Harriers as an alternative to degraded or lost natural
breeding habitat. We suggest that creating conditions
that favour high vole abundance, by expanding and
optimizing certain agri-environmental schemes,
could improve Harrier food availability and thereby
positively influence their reproductive performance.
The decrease of prey abundance in intensively used
agricultural landscapes (Arroyo et al. 2002) could be
halted. Set-aside land not only supports high vole
densities, but also high densities of farmland birds
such as Skylark (Boatman et al. 1999, Donald 2004),
which are prey species of Montagu’s Harrier, and
an important component of farmland biodiversity.
Montagu’s Harrier conservation could be used to
promote the positive perception of agricultural landscapes as bird habitats, and to prioritize farmland bird
conservation in general.
If management of food supply in agricultural
breeding habitat proves to be successful, it might be
considered as an alternative to nest protection, which
is resource- and time-consuming. Higher prey abundance could attract more Harrier pairs and increase
Harrier fledgling production. An increase in the
numbers of Harriers breeding in farmland could make
the Dutch population less susceptible to the effects
of short-term decreases in food supply, or to losses
caused by agricultural practices.
We are very grateful to all who contributed to the project.
We would like to thank the many farmers who spared
Harrier nests and kindly gave us permission to work on
their land, especially Willem and Titia Schillhorn van
Veen, Bernard Leemhuis and Gulko ten Have. Many
thanks to B.V. Oldambt for their contribution to nest
protection. We are very grateful to all volunteers of the
Dutch Montagu’s Harrier Foundation who spent much of
their spare time helping with protection and research.
Many thanks to the students who collected data and wrote
reports and theses. Rudi Drent, Beatriz Arroyo and Rob
Bijlsma have inspired the project with their advice and
support. We thank Roger Clarke for his contribution to the
pellet analyses. Thanks to Nicolaus von Engelhardt and
Marijtje van Duijn for statistical advice and Rudi Drent,
Mark Wilson, Beatriz Arroyo, Mark Whittingham, Kees
© 2007 The Authors
Journal compilation © 2007 British Ornithologists’ Union
van Scharenburg, Jeroen Minderman and Will Miles for
helping to improve the manuscript. Dik Visser drew the
figures. Thanks to Gerrit Speek of the Dutch Ringing
Centre. The project is funded by the Ministry of Agriculture, Nature and Food quality, the Province of Groningen,
the Province of Flevoland, Vogelbescherming Nederland
(BirdLife Netherlands), the Prince Bernhard Cultural
Foundation and Avifauna Groningen.
REFERENCES
Arroyo, B.E. 1997. Diet of Montagu’s Harrier Circus pygargus in
central Spain: analysis of temporal and geographic variation.
Ibis 139: 664– 672.
Arroyo, B., García, J.T. & Bretagnolle, V. 2002. Conservation
of Montagu’s Harrier Circus pygargus in agricultural areas.
Anim. Conserv. 5: 283– 290.
Arroyo, B.E., García, J.T. & Bretagnolle, V. 2004. Montagu’s
Harrier. BWP Update (The Journal of the Birds of the Western
Palearctic) 6: 41–55.
Beemster, N. & Dijkstra, C. 1991. Roofvogels in de Nederlandse Wetlands. Variaties in Voedselaanbod: Woelmuizen.
Intern Rapport. Lelystad: Ministerie van Verkeer en
Waterstaat, Directoraat-Generaal Rijkswaterstaat, Directie
IJsselmeergebied.
Bijlsma, R.G. 1994. Ecologische Atlas van de Nederlandse
Roofvogels, 3rd edn. Haarlem: Schuyt.
Bijlsma, R.G. 1998. Handleiding Veldonderzoek Roofvogels,
2nd edn. Utrecht: Stichting Uitgeverij Koninklijke Nederlandse
Natuurhistorische Vereniging.
Bijlsma, R.G. 2005. Trends and breeding performance of raptors
in the Netherlands in 2004. De Takkeling 13: 9– 56.
Boatman, N.D., Stoate, C. & Watts, P.N. 1999. Practical management solutions for birds on lowland arable farmland. In
Aebischer, N.J., Evans, A.D., Grice, P.V. & Vickery, J.A. (eds)
Ecology and Conservation of Lowland Farmland Birds: 105 –
114. Tring: British Ornithologists’ Union.
Briner, T., Nentwig, W. & Airoldi, J.-P. 2005. Habitat quality of
wildflower strips for common voles (Microtus arvalis) and its
relevance for agriculture. Agriculture Ecosystems Environ.
105: 173–179.
Bruford, M.W. 2002. Biodiversity – evolution, species, genes. In
Norris, K. & Pain, D.J. (eds) Conserving Bird Biodiversity:
General Principles and Their Application: 1–19. Cambridge:
Cambridge University Press.
Burfield, I. & Van Bommel, F. (eds) 2004. Birds in Europe:
Population Estimates, Trends and Conservation Status.
Cambridge: BirdLife International.
Butet, A. & Leroux, A.B.A. 1989. Incidence of the fluctuations
of field vole (Microtus arvalis) populations in the reproduction
of the Montagu’s Harrier (Circus pygargus). Hypothesis of
evolution in conjunction with changes in agricultural practices
in the marshes of West France. In Lefeuvre, J.C. (ed.)
Proceedings of the 3rd International Wetlands Conference:
207 –208. Paris: Muséum National d’Histoire Naturelle.
Butet, A. & Leroux, A.B.A. 1993. Effect of prey on a predator’s
breeding success. A 7-year study on common vole (Microtus
arvalis) and Montagu’s harrier (Circus pygargus) in a West
France marsh. Acta Oecologica 14: 857–865.
Butet, A. & Leroux, A.B.A. 2001. Effects of agriculture development on vole dynamics and conservation of Montagu’s
�Montagu’s Harrier in agricultural habitat
Harrier in western French wetlands. Biol. Conserv. 100: 289–
295.
Clarke, R. 1996. Montagu’s Harrier. Chelmsford: Arlequin Press.
Corbacho, C., Sánchez, J.M. & Sánchez, A. 1997. Breeding
biology of Montagu’s Harrier Circus pygargus L. in agricultural
environments of southwest Spain; comparison with other
populations in the western Palearctic. Bird Study 44: 166–
175.
Daan, S., Dijkstra, C. & Tinbergen, J.M. 1990. Family-planning
in the Kestrel (Falco tinnunculus) – the ultimate control of
covariation of laying date and clutch size. Behaviour 114: 83 –
116.
Dijkstra, C., Beemster, N., Zijlstra, M., Van Eerden, M. &
Daan, S. 1995. Roofvogels in de Nederlandse Wetlands.
Lelystad: Ministerie van Verkeer en Waterstaat, DirectoraatGeneraal Rijkswaterstaat, Directie IJsselmeergebied.
Dijkstra, C., Daan, S., Meijer, T., Cavé, A.J. & Foppen, R.P.B.
1988. Daily and seasonal variations in body mass of the
Kestrel in relation to food availability and reproduction. Ardea
76: 127–140.
Dijkstra, C. & Zijlstra, M. 1997. Reproduction of the Marsh
Harrier Circus aeruginosus in recent land reclamations in
The Netherlands. Ardea 85: 37–50.
Donald, P.F. 2004. The Skylark. London: T. & A.D. Poyser.
Fox, A.D. 2004. Has Danish agriculture maintained farmland
bird populations? J. Appl. Ecol. 41: 427– 439.
Green, R. 2002. Diagnosing causes of population declines and
selecting remedial actions. In Norris, K. & Pain, D.J. (eds)
Conserving Bird Biodiversity: General Principles and Their
Application: 139 –156. Cambridge: Cambridge University
Press.
Hamerstrom, F. 1979. Effect of prey on predator – voles and
harriers. Auk 96: 370– 374.
Hörnfeldt, B. 2004. Long-term decline in numbers of cyclic voles
in boreal Sweden: analysis and presentation of hypotheses.
Oikos 107: 376– 392.
Hörnfeldt, B., Carlsson, B.-G., Löfgren, O. & Eklund, U. 1990.
Effects of cyclic food supply on breeding performance in
Tengmalm’s owl (Aegolius funereus). Can. J. Zool. 68: 522–
530.
Jacob, J. 2003. Short-term effects of farming practices on
populations of common voles. Agriculture, Ecosystems
Environ. 95: 321–325.
Jenni, L. & Winkler, R. 1994. Moult and Ageing of European
Passerines. San Diego: Academic Press Inc.
Kapteyn, K. 1999. Braakballen Pluizen. Utrecht: NOZOS &
KNNV-uitgeverij.
Koks, B. & Van Scharenburg, K. 1997. Meerjarige braaklegging:
een kans voor vogels, in het bijzonder de Grauwe Kiekendief!
De Levende Natuur 98: 218–222.
Koks, B.J., Van Scharenburg, C.W.M. & Visser, E.G. 2001.
Grauwe Kiekendieven Circus pygargus in Nederland:
balanceren tussen hoop en vrees. Limosa 74: 121–136.
Koks, B.J. & Visser, E.G. 2002. Montagu’s Harrier Circus
pygargus in the Netherlands: does nest protection prevent
extinction? Ornithologischer Anzeiger 41: 159–166.
Koks, B., Visser, E., Draaijer, L., Dijkstra, C. & Trierweiler, C.
2005. Grauwe Kiekendieven Circus pygargus in Nederland in
2004. De Takkeling 13: 65–79.
Komdeur, J. & Pels, M. 2005. Rescue of the Seychelles warbler
on Cousin Island, Seychelles: the role of habitat restoration.
Biol. Conserv. 124: 15–26.
585
Korpimäki, E. 1985. Rapid tracking of microtine populations by
their avian predators: possible evidence for stabilizing
predation. Oikos 45: 281–284.
Lange, R., Twisk, P., Van Winden, A. & Van Diepenbeek, A.
1994. Zoogdieren Van West-Europa. Utrecht: KNNV-uitgeverij.
Leroux, A. 2004. Le Busard Cendré. Paris: Éditions Belin.
Maurel, C. & Poustomis, S. 2001. L’étude de l’alimentation au
nid des jeunes Busards Saint-Martin Circus cyaneus et cendrés Circus pygargus par suivi vidéo. Alauda 69: 239–254.
Meijer, T., Daan, S. & Dijkstra, C. 1988. Female condition and
reproduction: effects of food manipulation in free-living and
captive Kestrels. Ardea 76: 141–154.
Millon, A., Bourrioux, J.-L., Riols, C. & Bretagnolle, V. 2002.
Comparative breeding biology of Hen Harrier and Montagu’s
Harrier: an 8-year study in north-eastern France. Ibis 144:
94 –105.
Newton, I. 1998. Population Limitation in Birds. London: Academic
Press.
Newton, I. 2004. Population limitation in migrants. Ibis 146: 197–226.
Norris, K. & Pain, D.J. (eds) 2002. Conserving Bird Biodiversity:
General Principles and Their Application. Cambridge:
Cambridge University Press.
Ormerod, S.J. & Watkinson, A.R. 2000. Editors’ introduction:
birds and agriculture. J. Appl. Ecol. 37: 699–705.
Owens, I.P.F. & Bennett, P.M. 2000. Ecological basis of extinction risk in birds: habitat loss versus human persecution and
introduced predators. Proc. Natl Acad. Sci USA 97: 12144–
12148.
Quinn, G.P. & Keough, M.J. 2002. Experimental Design
and Data Analysis for Biologists. Cambridge: Cambridge
University Press.
Rasbash, J., Steele, F., Browne, W. & Prosser, B. 2004. A
User’s Guide to MLwiN, Version 2.0. London: Institute of
Education, University of London.
Redpath, S.M., Thirgood, S.J. & Clarke, R. 2002. Field
Vole Microtus agrestis abundance and Hen Harrier Circus
cyaneus diet and breeding in Scotland. Ibis 144: E33–E38.
Robson, N. 1997. The evolution of the Common Agricultural Policy
and the incorporation of environmental considerations. In
Pain, D.J. & Pienkowski, M.W. (eds) Farming and Birds in
Europe: the Common Agricultural Policy and its Implications
for Bird Conservation: 79–116. London: Academic Press.
Salamolard, M., Butet, A., Leroux, A. & Bretagnolle, V. 2000.
Responses of an avian predator to variations in prey density
at a temperate latitude. Ecology 81: 2428 –2441.
Schipper, W.J.A. 1973. A comparison of prey selection in sympatric
Harriers Circus in Western Europe. Le Gerfaut 63: 17–120.
Sibly, R.M., Hone, J. & Clutton-Brock, T.H. 2003. Introduction
to wildlife population growth rates. In Sibly, R.M., Hone, J. &
Clutton-Brock, T.H. (eds) Wildlife Population Growth Rates:
1–10. Cambridge: Cambridge University Press.
Simmons, R.E. 2000. Harriers of the World: Their Behaviour
and Ecology. Oxford: Oxford University Press.
Simmons, R.E., Barnard, P., MacWhirter, B. & Hansen, G.L.
1986. The influence of microtines on polygyny, productivity,
age, and provisioning of breeding Northern Harriers: a 5-year
study. Can. J. Zool. 64: 2447–2456.
Snijders, T.A.B. & Bosker, R.J. 1999. Multilevel Analysis: an
Introduction to Basic and Advanced Multilevel Modeling.
London: Sage.
Taylor, I. 1994. Barn Owls: Predator–Prey Relationships and
Conservation. Cambridge: Cambridge University Press.
© 2007 The Authors
Journal compilation © 2007 British Ornithologists’ Union
�586
B. J. Koks et al.
Trierweiler, C., Koks, B.J., Bairlein, F., Exo, K.-M., Komdeur, J.
& Dijkstra, C. 2006a. Zugstrategien und Schutz NWeuropäischer Wiesenweihen (Circus pygargus). Jahresbericht Institut Vogelforschung 7: 12.
Trierweiler, C., Koks, B., Visser, E., Draaijer, L., Ploeger, J. &
Dijkstra, C. 2006b. Grauwe Kiekendieven Circus pygargus in
Nederland in 2005. De Takkeling 14: 54–67.
Tucker, G. 1997. Priorities for bird conservation in Europe: the
importance of the farmed landscape. In Pain, D.J. &
Pienkowski, M.W. (eds) Farming and Birds in Europe: the
Common Agricultural Policy and its Implications for Bird
Conservation: 79–116. London: Academic Press.
Tucker, G.M. & Heath, M.F. 1994. Birds in Europe: Their Conservation Status. Cambridge: BirdLife International.
Underhill, L. & Gibbons, D. 2002. Mapping and monitoring bird
populations: their conservation uses. In Norris, K. & Pain, D.J.
(eds) Conserving Bird Biodiversity: General Principles and Their
Application: 34–60. Cambridge: Cambridge University Press.
Valone, T.J. & Templeton, J.J. 2002. Public information for the
assessment of quality: a widespread social phenomenon.
Phil. Trans. R. Soc. Lond. B 357: 1549 –1557.
Van Buskirk, J. & Willi, Y. 2004. Enhancement of farmland biodiversity within set-aside land. Conserv. Biol. 18: 987– 994.
© 2007 The Authors
Journal compilation © 2007 British Ornithologists’ Union
Village, A. 1981. The diet and breeding of Long-eared Owls in
relation to vole numbers. Bird Study 28: 215–224.
Village, A. 1987. Numbers, territory-size and turnover of Shorteared Owls Asio flammeus in relation to vole abundance.
Ornis Scand. 18: 198–204.
Village, A. 1990. The Kestrel. London: T. & A.D. Poyser.
Vulink, J.T. 2001. Hungry Herds: Management of Temperate
Lowland Wetlands by Grazing. Lelystad: Ministerie van
Verkeer en Waterstaat, Directoraat-Generaal Rijkswaterstaat,
Directie IJsselmeergebied.
Whittingham, M.J., Swetnam, R.D., Wilson, J.D., Chamberlain,
D.E. & Freckleton, R.P. 2005. Habitat selection by yellowhammers Emberiza citrinella on lowland farmland at two
spatial scales: implications for conservation management.
J. Appl. Ecol. 42: 270–280.
Wijnandts, H. 1984. Ecological energetics of the Long-eared
Owl (Asio otus). Ardea 72: 1–92.
Zijlstra, M. & Hustings, F. 1992. Teloorgang van de Grauwe
Kiekendief, Circus pygargus, als broedvogel in Nederland.
Limosa 65: 78–79.
Received 25 April 2005; revision accepted 1 January 2007.
�
 Cor Dijkstra