1571
Effects of suppression and release on sapling
growth for 11 tree species of northern, interior
British Columbia
Elaine F. Wright, Charles D. Canham, and K.D. Coates
Abstract: Saplings of canopy tree species frequently undergo alternating periods of suppression and release before
reaching canopy size. In this study, we document the effects of periods of suppression and release on current responses
to variation in light by saplings of the 11 major tree species of northwestern, interior British Columbia. We were specifically interested in the degree to which increasing length of suppression had long-term effects on subsequent response to release in gaps or following partial cutting, and the degree to which the effects of suppression were
ameliorated with time following release. At least some saplings of all 11 species had undergone alternating periods of
suppression and release. The most shade-tolerant species generally did not show either a decline in growth over time
during suppression or a gradual increase in growth at a given light level over time during release. The least shadetolerant species exhibited significant declines in growth rate during suppression; however, in all of the species except
trembling aspen (Populus tremuloides Michx.), the effects of suppression disappeared over time during release. Failure
to account for the effects of past suppression and release leads to significant overestimates of the initial responses of
shade-intolerant species to release. Our results suggest that competitive balances between species shift substantially
over time as a result of growth history and that these shifts have significant effects on successional patterns.
Résumé : Les gaules des essences qui forment le couvert subissent fréquemment une alternance de périodes de suppression et de dégagement avant d’atteindre leur dimension finale. Dans cette étude, nous avons observé les effets de
périodes de suppression et de dégagement sur la réaction courante à une variation de la lumière chez les gaules des
11 principales espèces d’arbres du nord-ouest de la zone intérieure de la Colombie-Britannique. Nous étions plus
particulièrement intéressés à déterminer dans quelle mesure l’augmentation de la durée de la période de suppression a
des effets à long terme sur la réaction subséquente à un dégagement dans les trouées ou suite à une coupe partielle et
dans quelle mesure les effets d’une période de suppression sont compensés avec le temps suite à un dégagement. Au
moins quelques gaules de toutes les espèces avaient subi une alternance de périodes de suppression et de dégagement.
Les espèces les plus tolérantes n’ont généralement subi ni de diminution de croissance en fonction du temps en période
de suppression, ni une augmentation graduelle de croissance en fonction du temps à un niveau donné de lumière en
prériode de dégagement. Les espèces les moins tolérantes ont connu une diminution significative de leur taux de
croissance en période de suppression; cependant, chez toutes les espèces à l’exception du peuplier faux-tremble
(Populus tremuloides Michx.), les effets de la suppression ont disparu avec le temps suite au dégagement. Le fait de ne
pas tenir compte des effets de périodes passées de suppression et de dégagement entraîne une surestimation importante
de la réaction initiale à un dégagement chez les espèces intolérantes. Nos résultats suggèrent que l’équilibre compétitif
entre les espèces change de façon importante avec le temps selon l’historique de croissance et que ces changements ont
des effets majeurs sur les patrons successionnels.
[Traduit par la Rédaction]
Wright et al.
1580
Introduction
An understanding of patterns of sapling growth and mortality is fundamental to predicting forest successional dynamics (Pacala et al. 1994; Kobe 1996; Kobe and Coates
Received November 9, 1999. Accepted July 17, 2000.
E.F. Wright1 and K.D. Coates. Forest Sciences Section,
Prince Rupert Forest Region, Bag 5000, Smithers, BC V0J
2N0, Canada.
C.D. Canham. Institute of Ecosystem Studies, P.O. Box AB,
Millbrook, NY 12545, U.S.A.
1
Corresponding author. Present address: Department of
Conservation, Southern Regional Office, P.O. Box 13-049,
3/137 Kilmore Street, Christchurch, New Zealand.
e-mail: ewright@doc.govt.nz
Can. J. For. Res. 30: 1571–1580 (2000)
1997; Wright et al. 1998) and for prediction of forest regeneration in managed stands after partial or complete release
of advance regeneration (e.g., Crossley 1976; Herring 1977;
Herring and McMinn 1980; McCaughey and Ferguson
1986). There has been a great deal of study of the role of advance regeneration in gap-phase dynamics of temperate and
tropical forests (e.g., Runkle 1981; Hibbs 1982; Canham
1988; Lertzman 1992; Kneeshaw and Bergeron 1998). There
has also been a long-term debate in forestry over the management of advance regeneration following cutting (Pogue
1946; Gordon 1973; Crossley 1976; Herring 1977; Ferguson
and Adams 1980; Herring and McMinn 1980; Graham 1982;
Oliver 1985; Seidel 1985; Laackie and Fiddler 1986;
McCaughey and Ferguson 1986; Carlson and Schmidt 1989;
Bassman et al. 1992; Tesch and Korpela 1993). Saplings of
different tree species clearly have different abilities to sur© 2000 NRC Canada
1572
Can. J. For. Res. Vol. 30, 2000
Table 1. Characteristics of the data set: sample size (n), shade-tolerance ranking (low, medium, high), the range of latitude and elevation, the mean and range (in parentheses) of DBH, sapling height, and average light level from which saplings were collected for each
of the 11 study species.
Tree species
n
Tolerance
ranking*
Latitude (N)
Elevation (m)
DBH (cm)
Height (m)
Light level
(% full sun)
Western redcedar
Western hemlock
Mountain hemlock
Amabilis fir
Subalpine fir
Black spruce
Hybrid spruce
Lodgepole pine
Trembling aspen
Cottonwood
Paper birch
57
278
103
128
679
58
674
434
68
52
73
High
High
High
High
High
Medium
Medium
Low
Low
Low
Low
54°40′–55°30′
54°40′–57°08′
54°40′–55°25′
54°40′–55°30′
54°01′–59°03′
59°39′–59°37′
54°01′–59°57′
54°01′–59°57′
54°40′–55°30′
54°40′–55°30′
54°40′–55°30′
320–480
290–1255
520–1255
100–1200
320–1380
700–925
130–1370
130–1450
260–700
600–850
260–700
4.2
3.9
4.2
4.2
3.9
3.6
3.9
4.2
4.7
5.0
4.3
3.45 (1.00–7.50)
3.49 (1.00–7.80)
3.07 (0.80–7.90)
2.8 (0.03–8.40)
2.87 (0.60–10.50)
3.62 (1.10–7.60)
3.07 (0.50–9.20)
3.33 (0.40–9.70)
6.4 (2.30–10.70)
5.78 (1.10–12.00)
5.66 (2.10–9.00)
32.8
38.3
45.0
44.5
42.3
47.5
42.2
50.8
42.0
48.8
44.3
(0.4–10.3)
(0.2–10.6)
(0.3–11.6)
(0.4–11.8)
(0.3–16.5)
(0.6–6.9)
(0.1–13.3)
(0.5–14.6)
(0.0–10.3)
(0.5–12.1)
(0.8–11.7)
*Estimates are from Krajina et al. (1982), Burns and Honkala (1990), and Kobe and Coates (1997).
vive periods of suppression (Kobe 1996; Kobe and Coates
1997) and different magnitudes of response to release
(McCaughey and Ferguson 1986). In forests where gapphase dynamics represent the dominant mode of canopy recruitment, individuals of shade-tolerant species typically undergo multiple episodes of suppression and release before
reaching canopy size (Canham 1985, 1990; Merrens and
Peart 1992; Rebertus and Veblen 1993; Orwig and Abrams
1994; Cho and Boerner 1995). Attributes such as sapling
age, size, crown area and geometry, presence of injuries, and
pathogens have been used to help predict sapling growth after release (e.g., Herring 1977; Ferguson and Adams 1980;
Seidel 1980, Graham 1982; McCaughey and Schmidt 1982;
Oliver 1985; Laackie and Fiddler 1986; McCaughey and
Ferguson 1986; Canham 1988, Tesch and Korpela 1993).
However, there have been no systematic studies of whether,
and to what extent, previous periods of suppression or release have long-term effects on the growth of advance regeneration.
In this study, we examined the effects of the lengths of
previous periods of suppression and release on the growth
responses of eight conifers and three broadleaved tree species of northwestern, interior British Columbia. The 11 species ranged from very shade tolerant to shade intolerant and
represent the dominant species of early to late-successional
stands throughout the region. We were specifically interested
in the degree to which increasing length of suppression had
long-term effects on subsequent response to release in gaps
or following partial cutting, and the degree to which the effects of previous periods of suppression were ameliorated
with time following release.
Materials and methods
Study area and tree species
Data were collected for 11 tree species in study sites
throughout the Prince Rupert Forest Region, located in central to northwestern British Columbia, Canada (Table 1). The
11 species include all the dominant and codominant species
found in early to late-successional stands in this region
(Banner et al. 1993). The species span a range of shade tolerance (Krajina et al. 1982; Burns and Honkala 1990; Carter
and Klinka 1992; Klinka et al. 1992; Wang et al. 1994;
Kayahara et al. 1996; Kobe and Coates 1997). Amabilis fir
(Abies amabilis Dougl. ex Forbes), western redcedar (Thuja
plicata (Dougl. ex D Don), western hemlock (Tsuga heterophylla (Raf.) Sarg.), mountain hemlock (Tsuga mertensiana
(Bong.) Carr.), and subalpine fir (Abies lasiocarpa (Hook.)
Nutt.) are considered shade tolerant. Black spruce (Picea
mariana (Mill.) BSP), white spruce (Picea glauca (Moench)
Voss), Engelmann spruce (Picea engelmannii Parry ex
Engelm.), and Sitka spruce (Picea sitchensis (Bong.) Carr.)
are intermediate in shade tolerance. Lodgepole pine (Pinus
contorta var. latifolia Engelm.), trembling aspen (Populus
tremuloides Michx.), paper birch (Betula papyrifera
Marsh.), and black cottonwood (Populus balsamifera ssp.
trichocarpa Torr. & Gray) are considered shade intolerant.
The forests of British Columbia have been classified into
a system of biogeoclimatic zones, subzones, and variants
(Pojar et al. 1987, Meidinger and Pojar 1991, Banner et al.
1993). We sampled within the five major forest zones of interior, northern British Columbia, and from one to three
subzones within each zone, with from two to eight species
sampled within a subzone (Table 1). Within each subzone,
we sampled on sites with average soil moisture and nutrients
in mature stands, canopy gaps, regenerating burns and associated mature remnants, road and trail cuts greater than 30
years old, and in partially cut and clear-cut areas. Areas with
disturbance within the last 5 years (e.g., blowdown, insect
related dieback, and new road cuts) were carefully avoided.
A detailed analysis of geographic variation in sapling growth
(without consideration of the effects of suppression and release) is presented elsewhere (Wright et al. 1998). For this
paper, we present results from all subzones pooled (to increase sample size and statistical power, accepting that response as a function of light will be more variable for
pooled data versus that of the representative subzone) and
from one representative subzone, the moist, cool variant of
the interior cedar–hemlock forests (ICHmc2), for which we
have the largest number of species represented (nine). For
our pooled data set we break the spruces into two groups:
(i) black spruce from our boreal sampling and (ii) hybrid
spruce, which includes any of the various mixtures of white,
Sitka, and Engelmann spruce from within our sampling ar© 2000 NRC Canada
Wright et al.
1573
Table 2. Radial growth thresholds (mm radial growth/year) and
corresponding light levels used to define periods of suppression
versus release.
Tree species
Radial growth
threshold (mm/year)
Light level
(% of full sun)
Western redcedar
Western hemlock
Mountain hemlock
Amabilis fir
Subalpine fir
Black spruce
Hybrid spruce
Lodgepole pine
Trembling aspen
Cottonwood
Paper birch
0.25
0.3
0.3
0.3
0.3
0.45
0.6
0.9
1.25
1.6
1.8
6
5
5
8
8
15
12
28
20
27
37
Note: Periods of suppression were defined as periods with at least four
or more consecutive years of growth below the threshold, without three or
more consecutive years of growth exceeding the threshold. The growth
rate associated with a sapling mortality of 10% over a 3-year period
(Kobe and Coates 1997) was used as the threshold for each species. Also
reported are the approximate light levels associated with that growth rate,
from relationships in Wright et al. (1998).
eas. The complex nature of spruce hybridization in northwestern British Columbia is described in Coates et al.
(1994). In our representative ICHmc2 subzone, white and
Sitka spruce hybridize commonly.
Sampling design and measurements
Naturally regenerated saplings were obtained from a range
of height classes (0.5–12.0 m) across the full range of light
levels found within forests in this region (<5 to >90%). Sample sizes for a given species ranged from 52 to 679 saplings,
depending on the number of forest types within which saplings were collected (Table 1). Sapling sizes were uniformly
distributed across light levels for each species and climatic
region. Where saplings occurred in clusters, the dominant individuals were selected to provide us with an estimate of optimum growth for that light level. Sampling took place at the
end of the summer in 1995 and throughout the field season
in 1996. For each sapling, total height and diameter at 1.3 m
(diameter at breast height, DBH) were recorded, and a section of the stem was removed at 10 cm above the root collar
for measurement of radial growth. Except for trembling aspen, a species that regenerates primarily by root suckers in
our study area (Haeussler et al. 1990), all sample trees were
of seed origin.
Annual ring widths were measured along a representative
radius (the radius bisecting the angle formed by the longest
and shortest radii of the cross section). Ring widths were
measured with a digital ring analyzer to 0.025 mm resolution using a high-resolution colour video camera connected
to a 40× stereoscope. The most recent growth ring was discarded for saplings obtained in 1996 because of incomplete
radial growth.
Light
Hemispherical canopy photos were taken at 1–1.5 m
above the stump of each cut sapling to quantify light available for growth over the growing season. Saplings were se-
lected so that overstory canopy trees, rather than adjacent
saplings, provided shading. In addition, sample trees were
only obtained from areas where coniferous species dominated the canopy trees. GLI, an index of growing season
light availability, was computed from each photograph (using GLI version 2.0 software) following Canham (1988).
This index combines the seasonal distribution of sky brightness with the distribution of canopy openness to calculate a
single index of available light in units in percentage of full
sun for a specified growing season (mid-April through midSeptember) (Canham et al. 1990).
Characterization of patterns of suppression and release
We considered suppression to be periods with at least four
or more consecutive years of growth below a speciesspecific threshold, without three or more consecutive years
exceeding the threshold (Canham 1985, 1990). The thresholds for each species were determined on the basis of functional relationships between growth and mortality, using the
results of a recent study of 9 of the 11 tree species sampled
in the same geographic location (Kobe and Coates 1997).
Specifically, the growth rate associated with a sapling mortality rate of 10% over a 3-year period (Table 2) was chosen
as the threshold, because it coincided with a steep inflection
in the probability of mortality as a function of recent growth
(Kobe and Coates 1997). Growth rates below the threshold
resulted in sharply increasing mortality rates. Black spruce is
considered intermediate in tolerance between subalpine fir
and hybrid spruce (Krajina et al. 1982), and a threshold for
black spruce using the difference between these two species
was used in lieu of direct mortality data. The threshold for
amabilis fir was set at the threshold for subalpine fir. Because of differences in the shade tolerance of the 11 species,
the estimated light levels associated with the threshold between suppression and release ranged from 5 to 37% of full
sun. In effect, the shade-intolerant species become suppressed at much higher light levels than the shade-tolerant
species (Table 2).
On the basis of this definition, we calculated the total
number of years of suppression and release, the number of
distinct periods of suppression and release, and the length of
the most recent (or current) period of suppression and release for each sapling. The individual patterns of suppression and release varied enormously among saplings and
species. In a preliminary analysis, all independent variables
were evaluated for use as predictive variables. The best fits
were obtained using length of the most recent (or current)
period of suppression and release. While it is possible that
the entire sequence of past suppression and release events
may affect current growth, we have concentrated our analysis on the effects of the most recent periods of suppression
and release because of the very large number of permutations required to incorporate the entire growth history in the
models outlined below.
Data analysis
The basic analysis of variation in growth as a function of
light is presented elsewhere (Wright et al. 1998). That analysis examined a number of different functional relationships
between light and growth (including Michaelis–Menten,
Chapman–Richards, and Weibull functions, with and without
© 2000 NRC Canada
1574
Can. J. For. Res. Vol. 30, 2000
Table 3. Radial growth patterns of suppression and release (mean and range), by species, across all sites.
Tree species
Age (years)
No. of
periods of
suppression
Western redcedar
Western hemlock
Mountain hemlock
Amabilis fir
Subalpine fir
Black spruce
Hybrid spruce
Lodgepole pine
Trembling aspen
Cottonwood
Paper birch
31.08
36.38
53.39
49.72
47.00
41.84
34.86
22.78
12.07
12.29
15.25
0.34
0.68
1.07
0.99
0.89
0.95
0.85
0.72
0.37
0.42
0.64
(7–57)
(5–155)
(9–179)
(6–151)
(6–225)
(15–93)
(8–161)
(6–77)
(5–24)
(5–26)
(6–32)
(0–2)
(0–5)
(0–4)
(0–3)
(0–6)
(0–2)
(0–5)
(0–2)
(0–2)
(0–1)
(0–2)
No. of years
of suppression
No. of
periods of
release
No. of years
of release
Length of last
suppression
(years)
Length of last
release (years)
3.81
10.95
20.20
32.27
19.24
25.29
21.65
15.00
2.88
4.21
9.86
1.10
1.28
1.44
1.19
1.36
1.02
0.94
0.68
0.96
0.79
0.56
27.27
25.43
33.18
17.45
27.75
16.55
13.20
7.78
9.19
8.08
5.38
3.56
7.29
10.14
26.98
12.84
23.12
18.83
14.48
2.81
4.21
9.59
26.46
22.20
26.83
14.81
23.79
15.83
12.09
7.63
9.04
8.02
5.32
(0–23)
(0–88)
(0–120)
(0–123)
(0–160)
(0–78)
(0–141)
(0–77)
(0–15)
(0–24)
(0–32)
(1–2)
(1–5)
(1–4)
(0–4)
(0–6)
(0–2)
(0–5)
(0–2)
(0–2)
(0–2)
(0–2)
(7–45)
(3–89)
(3–104)
(0–74)
(0–99)
(0–36)
(0–58)
(0–27)
(0–17)
(0–23)
(0–16)
(0–22)
(0–70)
(0–69)
(0–103)
(0–146)
(0–78)
(0–141)
(0–77)
(0–15)
(0–24)
(0–32)
(5–45)
(3–82)
(3–104)
(0–69)
(0–95)
(0–36)
(0–58)
(0–27)
(0–17)
(0–23)
(0–16)
Note: Included in the table are the numbers of periods of suppression and release, the total years of suppression and release, and the lengths of the last
periods of suppression and release prior to sampling.
non-zero intercepts). Based on the results of that analysis,
we have used Michaelis–Menton functions (with a zero intercept) for the basic functional relationship between growth
and light:
[1]
aL
Y =
+ε
(ays) + L
where Y = log10(radial growth + 1), a is the asymptote of
the function at high light, s is the slope of the function at
zero light, L is GLI (in units of percent full light received
over the growing season), and ε is the error term of the
equation. Since we avoided sampling in areas that had evidence of canopy disturbance in the past 5 years, radial
growth was measured as the mean of the past 5 years to reduce measurement error. We analyzed absolute rather than
relative growth (i.e., growth relative to size), because our
data indicate that saplings of most of our species did not
show a strong size dependency within the range of sizes
sampled for this study (Wright et al. 1998). Radial growth
was log transformed to stabilize the variance.
We used eight variants of eq. 1 to examine how the basic
relationship between growth and light was altered by the
lengths of the most recent periods of suppression and release
for each sapling:
(1)
The basic growth model (eq. 1, above)
(2–4) The basic model, plus a term (d) for length of
the last (or current) period of suppression (YLS), a
shape factor (f), and a term for the role of light (h)
(allowing for the effects of past suppression to vary as
a function of current light levels):
[2]
aL − dYLS
Y =
e
(ays) + L
[3]
aL − ( dYLS) f
Y =
e
(ays) + L
[4]
aL − ( dYLS + hL )
Y =
e
(ays) + L
(5–7) The basic model, plus a term (g) for the length
of the last (or current) period of release (YLR), a shape
factor (f), and a term for the role of light (h) (as
above):
[5]
aL gYLR
Y =
e
(ays) + L
[6]
aL ( gYLR ) f
Y =
e
(ays) + L
[7]
aL gYLR + hL
Y =
e
(ays) + L
(8)
The basic model, plus terms (d and g) for the
length of the last suppression (YLS) and release periods
(YLR):
[8]
aL gYLR − dYLS
Y =
e
(ays) + L
Parameters for all models were estimated for each species
using the NONLIN procedure in SYSTAT 6.0 (Systat, Inc.
1996) and the simplex estimation method to minimize the
loss function.
We fit models to saplings of each species for all subzones
combined (Table 1), as well as separate models for saplings
collected within the moist–cool subzone of the interior
cedar–hemlock forests. The significance of the improvement
in fit of the model due to the inclusion of additional parameters (d, g, f, h) in the basic model (eq. 1) was assessed using
the extra sums of squares principle: ESS = [(SSRE1 –
SSRE2)/(df1 – df2)/(SSRE2)/(n – p)], where SSRE1 and df1
are the residual sums of squares and degrees of freedom for
the full model and SSRE2 and df2 are the residual sums of
squares and degrees of freedom for the reduced model, n is
the number of observations, and p is the number of parameters in the larger model. ESS is distributed as an F statistic
with df1 – df2, n – p degrees of freedom (Bergerud 1991).
© 2000 NRC Canada
Wright et al.
1575
Table 4. Parameter estimates of the regression models for growth as a function of current light level and the
lengths of the most recent periods of suppression and release for saplings from all sites combined.
Tree species
n
a
s
Western redcedar
Western hemlock
Mountain hemlock
Subalpine fir
Amabilis fir
Black spruce
Hybrid spruce
Lodgepole pine
Trembling aspen
Cottonwood
Paper birch
55
278
103
679
119
58
674
434
68
52
73
0.799
0.61
0.532
0.824
1.019
0.349
0.548
0.789
0.907
0.753
0.688
0.019
0.038
0.015
0.012
0.010
0.013
0.022
0.016
0.034
0.035
0.044
d
g
0.006
0.006
0.008
0.015
0.024
0.011
0.016
0.013
0.018
0.012
0.017
0.012
0.015
R2, basic
0.48
0.45
0.51
0.42
0.54
0.38
0.36
0.55
0.68
0.39
0.59
R2, full
0.47
0.54
0.57
0.62
0.53
0.72
0.71
0.48
0.72
Note: Parameters a and s control the basic shape of the response to light (eq. 1), while d and g control the magnitude of
the effects of suppression and release, respectively (eqs. 2, 5, and 8). Also reported are the R2 values for both the basic
model (eq. 1) and the full model (eqs. 2, 5, or 8, incorporating either or both of the growth history parameters). Where no
values are reported for d or g, inclusion of those parameters did not produce a significant improvement in the fit of the
regression model.
Table 5. Parameter estimates of the regression models for growth as a function of current light level and the
lengths of the most recent periods of suppression and release for saplings from ICH forests only.
Tree species
n
a
s
Western hemlock
Western redcedar
Amabilis fir
Subalpine fir
Hybrid spruce
Trembling aspen
Cottonwood
Paper birch
Lodgepole pine
77
55
79
78
74
68
52
73
68
0.858
0.799
0.911
1.044
0.623
0.907
0.753
0.688
3.496
0.027
0.019
0.010
0.015
0.017
0.034
0.035
0.044
0.009
d
g
0.016
0.026
0.024
0.011
0.016
0.005
0.012
0.015
0.020
R2, basic
0.73
0.48
0.47
0.71
0.61
0.68
0.39
0.59
0.81
R2, full
0.51
0.72
0.71
0.48
0.72
0.85
Note: Parameters a and s control the basic shape of the response to light (eq. 1), while d and g control the magnitude of
the effects of suppression and release, respectively (eqs. 2, 5, and 8). Also reported are the R2 values for both the basic
model (eq. 1) and the full model (eqs. 2, 5, or 8, incorporating either or both of the growth history parameters). Where no
values are reported for d or g, inclusion of those parameters did not produce a significant improvement in the fit of the
regression model.
Results and discussion
Interspecific variation in patterns of suppression and
release
Average stem diameters of the samples were relatively
uniform across species (ranging from 3.6 cm for black
spruce to 5.0 cm in cottonwood), as were the average light
levels in which we sampled (ranging from a mean of 32.8%
of full sun for western redcedar to a mean of 50.8% for
lodgepole pine) (Table 1). The mean ages showed much
greater variation among species, ranging from 12.1 years for
aspen saplings to 53.4 years in mountain hemlock. Mean
age, by species, was closely correlated with the mean number of periods of suppression for a species (n = 11, r =
0.848, p = 0.015), which ranged from 0.34 periods in western redcedar to a mean of 1.1 periods of suppression per individual in mountain hemlock (Table 3). For all species
except aspen and cottonwood, sapling age within species
was also positively correlated with the percentage of the sapling’s life-span spent in periods of suppression (n = 52–679,
p < 0.05). Despite this, sapling age has not been reported to
be an important factor in determining growth response fol-
lowing release for subalpine fir (Crossley 1976; Herring
1977), white or black spruce (Crossley 1976; Johnstone
1978), true fir, and mountain hemlock (Seidel 1985). Across
all species, individual saplings had undergone as many as
six distinct cycles of suppression and release, with the most
recent periods of suppression lasting as long as 146 years
(Table 3).
Interspecific variation in the effects of suppression and
release on growth for all sites
None of the models incorporating either a shape parameter (f) or a parameter for the effect of current light level on
the effect of growth history (h) (eqs. 3, 4, 6, and 7) showed a
significant improvement in fit over models that incorporated
simple terms for the length of the most recent periods of
suppression or release (d and g), (eqs. 2, 5, and 8). Two of
the 11 species (western redcedar and subalpine fir) showed
no effects of previous periods of suppression and release on
current response to light (Table 4). Both species are considered shade tolerant, and redcedar is generally considered
among the most shade tolerant of the 11 species included in
our study (Krajina et al. 1982; Burns and Honkala 1990;
© 2000 NRC Canada
1576
Can. J. For. Res. Vol. 30, 2000
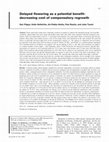
Fig. 1. Predicted radial increment growth (mm/year) for saplings of four species in interior cedar–hemlock (ICH) forests as a function
of light (GLI, in units of percentage of full sun) from the basic model (Wright et al. 1998), which does not incorporate historical effects of the most recent periods of suppression and release, versus the full model (Table 5 of this study), incorporating the effects of
suppression and release. For the full models, the length of the most recent periods of both suppression and release were set to 0 to allow comparison of the predictions of the two models of the growth of saplings in the first year of release for saplings with no previous period of suppression.
Carter and Klinka 1992; Klinka et al. 1992; Kobe and
Coates 1997). This contrasts the work by Johnstone (1978)
who found the number of years since release to be useful for
predicting growth response to release in subalpine fir.
Four species (hybrid spruce, lodgepole pine, cottonwood,
and birch) showed significant responses to the lengths of the
most recent periods of both suppression and release (Table 4). The latter three species are generally considered
among the least shade-tolerant species in the region (Kobe
and Coates 1997). For these species the cumulative effects
of the most recent periods of suppression are ameliorated by
current periods of release (i.e., significant g coefficients in
Table 4). The remaining five species had significant responses to either suppression or release (but not both) and
ranged from shade tolerant (western and mountain hemlock)
to intolerant (aspen) (Table 4). This agrees with the work of
Johnstone (1978) who also reported the number of years
since release to be an important predictive variable for determining growth response of both white and black spruce following release, whereas length of suppression was not.
Of the six species for which there was a significant negative effect of the length of suppression, the magnitude of the
effect (d) was positively correlated with the shade intolerance of the species, ranging from 0.006 in western hemlock
to 0.024 in trembling aspen. The magnitude of the positive
effect of release (g) was also roughly correlated with shade
intolerance, ranging from 0.006 in mountain hemlock to
0.018 in black spruce (Table 4).
Effects of suppression and release on sapling growth in
interior cedar–hemlock forests
Analysis of the subset of species and samples collected
from the moist-cool subzone of the interior cedar–hemlock
forests (ICHmc2 subzone) revealed similar relationships between shade tolerance and response to suppression and release (Table 5). The five most shade-tolerant species (western
hemlock, western redcedar, amabilis fir, subalpine fir, and
hybrid spruce) showed no response to the length of previous
periods of suppression, and three of the five species showed
no response to the length of release (Table 5). The three
least shade-tolerant species (lodgepole pine, cottonwood,
and birch; Wright et al. 1998) responded to the length of periods of both suppression and release (Table 5). Trembling
aspen had the greatest reduction in growth as a function of
the length of suppression and did not recover during release
(i.e., no g coefficient in Table 5), while lodgepole pine had
the smallest reduction in growth (Table 5).
Comparisons between the basic model (eq. 1, with no effects of growth history) and full models (eqs. 2, 5, or 8, with
varying effects of suppression and (or) release) demonstrate
© 2000 NRC Canada
Wright et al.
1577
Fig. 2. Predicted radial increment growth (mm/year) for saplings of the nine major tree species of interior cedar–hemlock forests as a
function of light (GLI, in units of percentage of full sun), under four different histories of suppression and release: (A) no suppression
or release, (B) 20 years of suppression, (C) 20 years of suppression followed by 20 years of release, and (D) 20 years of release with
no preceding period of suppression.
that ignoring the effects of suppression and release produces
overestimates of initial growth response to release, particularly at high light levels (Fig. 1). In particular, the extremely
rapid growth rate predicted by the basic model for lodgepole
pine under high light appears to only develop over a period
of time following release. (Table 5, Fig. 1). In effect, the
data for saplings in high light represent individuals that had
spent varying lengths of time in release. By ignoring growth
history, we overestimated the potential initial response to release for the less shade-tolerant species (Wright et al. 1998).
Figures 2A–2D show the expected current growth rate at
all light levels as a function of past growth history. Note that
at light levels below the thresholds given in Table 2, current
growth rates would represent suppression, while light levels
above the species-specific thresholds represent saplings that
are currently released. When the full model is used (but with
history factored out by setting suppression and release to
zero), aspen is dominant at all light levels <95% of full sun,
whereas spruce and amabilis fir have the lowest growth
(Fig. 2A). The high diameter growth rates of aspen, birch,
and cottonwood at <60% full sun confirm our previous con-
clusion that interspecific variation in low-light growth rates
is not predicted by shade tolerance (Wright et al. 1998) (Fig
2A). In fact, during the first year of growth for saplings with
no history of suppression, the three broadleaved species
have the highest growth rates of all species across the range
from 0 to 50% of full sun (Fig. 2A). However, growth rates
of all three of those species decline rapidly over time when
suppressed (i.e., at light levels less than 20–40% of full sun;
Table 2). Moreover, mortality rates of all three species rise
sharply with declining light levels in this range (Kobe and
Coates 1997). After 20 years of suppression, western hemlock is predicted to have the fastest growth rate at essentially
all light levels when released (Fig. 2B). In contrast, growth
of aspen saplings drops off dramatically after 20 years of
suppression, and all three of the broadleaved species initially
have relatively low growth rates when released, even at high
light levels (Fig. 2B). In contrast to previous work (e.g.,
Canham 1985, 1990; Orwig and Abrams 1994) suppression
here is defined on the basis of survival; much greater decreases in light are required to see a reduction in growth and
an increase in mortality. As a result, suppression occurs at
© 2000 NRC Canada
1578
different light levels for different species (Table 2). By our
definition, approximately 50% of saplings would survive 20
years at light levels where these species become functionally
suppressed. Twenty years of suppression at the threshold for
suppression in aspen (i.e., 20% of full sun) would reduce
growth rates of aspen saplings well below the growth rate of
western hemlock saplings that spent 20 years in much darker
light levels required to induce suppression in that shadetolerant species (i.e., 6% of full sun; Table 2).
After 20 years of suppression followed by 20 years of release, lodgepole pine growth rates exceed all other species at
light levels greater than 60% of full sun, while hybrid spruce
dominates at intermediate light levels (Fig. 2C). Because of
the lack of response to release in aspen, saplings that had
been suppressed for 20 years still have extremely low
growth rates even after 20 years of release (Fig. 2C).
Delays in response to release have been reported previously for a number of tree species, including black spruce
(Crossley 1976), subalpine fir (Herring 1977), Engelmann
spruce, (McCaughey and Schmidt 1982; Carlson and
Schmidt 1989), and true fir and mountain hemlock (Seidel
1985). The delay may reflect physiological and morphological adjustments of saplings following overstory removal
(Tucker and Emmingham 1977; Ferguson and Adams 1980;
Tucker et al. 1987). Seidel (1985) found that growth response in true fir and mountain hemlock reflected the degree
of shading provided by the overstory and hence the degree
of suppression, as did Sundkvist (1994) for Scots pine
(Pinus sylvestris L.) seedlings. This is supported by the
work of Bassman et al. (1992) who found that growth of regeneration following release was poor when the density of
other vegetation was high, indicating that partial canopy removal may not result in an increase in light for smaller saplings because of shading by competing vegetation.
Performance of regeneration after 20 years of release for
saplings that had undergone no previous periods of suppression (i.e., light levels over the past 20 years were above the
species specific thresholds for suppression given in Table 2)
are illustrated in Fig. 2D. There is a clear separation between shade-tolerant and -intolerant species, with amabilis
fir having the poorest growth over all light levels and paper
birch the highest growth at light levels <60% of full sun.
Lodgepole pine growth is greater than the three broadleaved
species at light levels exceeding 60%.
Summary and conclusions
Our results indicate that saplings of all of the major tree
species of northern, interior British Columbia frequently experience multiple episodes of both suppression and release
prior to reaching even subcanopy size. As silvicultural practices in the region shift from clear-cutting to various forms
of partial harvesting, alternating periods of suppression and
release are likely to become even more characteristic of the
process of canopy recruitment in these forests. Our results
show a clear relationship between shade tolerance and the
magnitude of the effects of past periods of suppression and
release on sapling growth. In general, there was no effect of
previous suppression on the current response of shadetolerant species to light. Similarly, the most shade-tolerant
species did not show a gradual increase in growth rate at a
Can. J. For. Res. Vol. 30, 2000
given light level during the course of release. The less
shade-tolerant species showed varying degrees of response
to both suppression and release, with the strongest responses
in the least shade-tolerant species. Our results clearly indicate that periods of suppression do not cause shade-tolerant
species to lose their ability to respond to release following
partial cutting. The less shade-tolerant species show a lag in
response to release, particularly if they have been suppressed, but the effects of prior suppression in all of the species except trembling aspen disappear during the course of
release.
Failure to incorporate these effects of growth history can
result in misleading conclusions about patterns of interspecific variation in response to light environments. This is
particularly true in the least shade-tolerant species, where
failure to incorporate the effects of history are likely to significantly overestimate initial response to release (Fig. 1).
More generally, competitive balances among species at a
given light level shift strikingly as a function of history (see
Fig. 2). SORTIE, a spatially explicit model of forest dynamics (Pacala et al. 1993) has been recently parameterized for
the interior cedar–hemlock forests of British Columbia. Initial tests of the model show that runs that do not incorporate
suppression–release dynamics do a poor job at predicting
succession in these forests (unpublished data).
Acknowledgements
We thank Bruce Catton, Saleem Dar, Ronnie Drever,
Duncan Moss, Jenyfer Neumann, and Tara Wylie for assistance in the field; S. Dar and J. Neumann for assistance with
image analysis; and Russell Klassen for assistance with radial growth measurements and data entry. We also thank two
anonymous reviewers for their helpful comments on the
manuscript. Partial funding for this research was provided by
Forest Renewal British Columbia (SB96028-RE and
SB96026-RE). This study is a contribution to the program of
the Institute of Ecosystem Studies, Millbrook, N.Y.
References
Banner, A., MacKenzie, W., Haeussler, S., Thomson, S., Pojar, J.,
and Trowbridge, R. 1993. A field guide to site identification and
interpretation for the Prince Rupert Forest Region. B.C. Ministry of Forests, Victoria. Land Manage. Handb. 26.
Bassman, J.H., Zwier, J.C., Olson, J.R., and Newberry, J.D. 1992.
Growth of advance regeneration in response to residual overstory
treatment in northern Idaho. West. J. Appl. For. 7(3): 78–81.
Bergerud, W. 1991. Picture of linear models. Forest Sciences
Branch, B.C. Ministry of Forests, Victoria. Biometr. Inf. Handb.
Ser. Handb. 1.
Burns, R.M., and Honkala, B.H. (Technical coordinators). 1990.
Silvics of North Amercia. Vol. 1 and 2. U.S. Dep. Agric. Agric.
Handb. 654.
Canham, C.D. 1985. Suppression and release during canopy recruitment in Acer saccharum. Bull Torrey Bot. Club, 112: 134–145.
Canham, C.D. 1988. An index of understory light levels in and
around canopy gaps. Ecology, 69: 1634–1638.
Canham, C.D. 1990. Suppression and release during canopy recruitment in Fagus grandifolia. Bull. Torrey Bot. Club, 117: 1–7.
Canham, C.D., Denslow, J.S., Platt, W.J., Runkle, J.R., Spies, T.A.,
and White, P.S. 1990. Light regimes beneath closed canopies
© 2000 NRC Canada
Wright et al.
and tree-fall gaps in temperate and tropical forests. Can. J. For.
Res. 20: 620–631.
Carlson, C.E., and Schmidt, W.C. 1989. Influence of overstory removal and western spruce budworm defoliation on growth of advance conifer regeneration in Montana. USDA For. Serv. Res.
Pap. INT-409.
Carter, R.E., and Klinka, K. 1992. Variation in shade tolerance of
Douglas fir, western hemlock and western redcedar in coastal
British Columbia. For. Ecol. Manage. 55: 87–105.
Cho, D.S., and Boerner, R.E.J. 1995. Dendrochronological analysis
of the canopy history of two Ohio old-growth forests. Vegetatio,
120: 173–183.
Coates, K.D., Haeussler, S., Lindeburgh, S., Pojar, R., and Stock,
A.J. 1994. Ecology and silviculture of interior spruce in British
Columbia. Canada – British Columbia Economic and Regional
Development, Victoria. For. Resour. Dev. Agree. Rep. 220.
Crossley, D.I. 1976. Growth response of spruce and fir to release
from suppression. For. Chron. 52: 189–193.
Ferguson, D.E., and Adams, D.L. 1980. Response of advance
grand fir regeneration to overstory removal in northern Idaho.
For. Sci. 26: 537–545.
Gordon, D.T. 1973. Released advance reproduction of white (Abies
concolor) and red fir (Abies magnifica) growth, damage, mortality. USDA Forest Serv. Res. Pap. PSW-95.
Graham, R.T. 1982. Influence of tree and site factors on western
redcedar’s response to release: a modelling analysis. USDA For.
Serv. Res. Pap. INT-296.
Haeussler, S., Coates, D., and Mather, J. 1990. Autecology of common plants in British Columbia: a literature review. Canada –
British Columbia Forest Resources Development Agreement.
B.C. Ministry of Forests, Victoria. For. Resour. Dev. Agree.
Rep. 158.
Herring, L.J. 1977. Studies of advance subalpine fir in the
Kamloops forest district. B.C. Forest Service, Victoria. Res.
Note 80.
Herring, L.J., and McMinn, R.G. 1980. Natural and advance regeneration of Engelmann spruce and subalpine fir compared 21
years after site treatment. For. Chron. 57: 55–57.
Hibbs, D.E. 1982. Gap dynamics in a hemlock–hardwood forest.
Can. J. For. Res. 12: 522–527.
Kayahara, G.J., Chen, H.Y.H., Klinka, K., and Coates, K.D. 1996.
Relations of terminal growth and specific leaf area to available
light in naturally regenerated seedlings of lodgepole pine and interior spruce in central British Columbia. B.C. Ministry of Forests, Victoria. Res. Rep. 09.
Klinka, K., Wang, Q., Kayahara, G.J., Carter, R.E., Blackwell,
B.A. 1992. Light-growth response relationships in Pacific silver
fir (Abies amabilis) and subalpine fir (Abies lasiocarpa). Can. J.
Bot. 70: 1919–1930.
Kneeshaw, D.D., and Bergeron, Y. 1998. Canopy gap characteristics and tree replacement in the southeastern boreal forest. Ecology, 79: 783–794.
Kobe, R.K. 1996. Intraspecific variation in sapling mortality and
growth predicts geographic variation in forest composition.
Ecol. Monogr. 66: 181–201.
Kobe, R.K., and Coates, K.D. 1997. Models of sapling mortality as
a function of growth to characterize interspecific variation in
shade tolerance of eight tree species of northwestern British Columbia. Can. J. For. Res. 27: 227–236.
Krajina, V.J., Klinka, K., and Worrall, J. 1982. Distribution and
ecological characteristics of trees and shrubs of British Columbia. Faculty of Forestry, University of British Columbia, Vancouver.
1579
Laackie, R.J., and Fiddler, G.O. 1986. Overstory removal: stand
factors related to success and failure. USDA For. Serv. Res. Paper PSW-183.
Lertzman, K. 1992. Patterns of gap-phase replacement in a subalpine, old-growth forest. Ecology, 73: 657–669.
McCaughey, W.W., and Ferguson, D.E. 1986. Response of advance
regeneration to release in the inland mountain west: a summary.
In Proceedings—Future Forests of the Mountain West: a Stand
Culture Symposium, 29 Sept. – 3 Oct. 1986, Missoula, Mont.
USDA Forest Service, Intermountain Research Station,
Missoula, Mont. pp. 255–266.
McCaughey, W.W., and Schmidt, W.C. 1982. Understory tree release following harvest cutting in spruce–fir forests of the
Intermountain West. USDA For. Serv. Res. Pap. INT-285.
Meidinger, D., and Pojar, J.(Compilers and Editors). 1991. Ecosystems of British Columbia. B.C. Ministry of Forests, Victoria.
Spec. Rep. Ser. 6.
Merrens, E.J., and Peart, D.R. 1992. Effects of hurricane damage
on individual growth and stand structure in a hardwood forest in
New Hampshire, USA. J. Ecol. 80: 787–795.
Oliver, W.W. 1985. Growth of California red fir advance regeneration after overstory removal and thinning. USDA For. Serv. Res.
Pap. PSW-180.
Orwig, D.A., and Abrams, M.D. 1994. Contrasting radial growth
and canopy recruitment patterns in Liriodendron tulipifera and
Nyssa sylvatica: gap-obligate versus gap-facultative species.
Can. J. For. Res. 24: 2141–2149.
Pacala, S.W., Canham, C.D., and Silander, J.A., Jr. 1993. Forest
models defined by field measurements: 1. The design of a northeastern forest simulator. Can. J. For. Res. 23: 1980–1988.
Pacala, S.W., Canham, C.D., Silander, J.A., Jr., and Kobe, R.K.
1994. Sapling growth as a function of resources in a north temperate forest. Can. J. For. Res. 24: 2172–2183.
Pogue, H.M. 1946. Regeneration and growth of white spruce after
logging. Department of Lands and Forests, Victoria, B.C. pp. 1–
26.
Pojar, J., Klinka, K., and Meidinger, D.V. 1987. Biogeoclimatic
classification in British Columbia. For. Ecol. Manage. 22: 119–
54.
Rebertus, A.J., and Veblen, T.T. 1993. Structure and tree-fall gap
dynamics of old-growth Nothofagus forests in Tierra del Fuego,
Argentina. J. Veg. Sci. 4: 641–654.
Runkle, J.R. 1981. Gap regeneration in some old-growth forests of
the eastern United States. Ecology, 62: 1041–1051.
Seidel, K.W. 1980. Diameter and height growth of suppressed
grand fir saplings after overstory removal. USDA For. Serv. Res.
Pap. PNW-275.
Seidel, K.W. 1985. Growth response of suppressed true fir and
mountain hemlock after release. USDA For. Serv. Res. Pap.
PNW-344.
Sundkvist, H. 1994. Initial growth of Pinus sylvestris advance reproduction following varying degrees of release. Scand. J. For.
Res. 9: 360–366.
SYSTAT, Inc. 1996. SYSTAT for Windows: statistics, version 6
edition. SYSTAT, Inc., Evanston, Ill.
Tesch, S.D., and Korpela, E.J. 1993. Douglas-fir and white fir advance regeneration for renewal of mixed-conifer forests. Can. J.
For. Res. 23: 1427–1437.
Tucker, G.F., and Emmingham, W.H. 1977. Morphological changes
in leaves of residual western hemlock after clear and shelterwood cutting. For. Sci. 23: 195–203.
Tucker, G.F., Hinckley, T.M., Leverenz, J., and Jiang, S. 1987. Adjustments of foliar morphology in the acclimation of understory
© 2000 NRC Canada
1580
Pacific silver fir following clearcutting. For. Ecol. Manage. 21:
249–268.
Wang, G.G., Quian, H., and Klinka, K. 1994. Growth of Thuja
plicata seedlings along a light gradient. Can. J. Bot. 72: 1749–
1757.
Can. J. For. Res. Vol. 30, 2000
Wright, E.F., Coates, K.D., Canham, C.D., and Bartemucci, P.
1998. Species variability in growth response to light across climatic regions in northwestern British Columbia. Can. J. For.
Res. 28: 871–886.
© 2000 NRC Canada
Academia.edu no longer supports Internet Explorer.
To browse Academia.edu and the wider internet faster and more securely, please take a few seconds to upgrade your browser.
Effects of suppression and release on sapling growth for 11 tree species of northern, interior British Columbia
Canadian Journal of Forest Research, 2000
...Read more
Related Papers
Canadian Journal of …, 2006
Download

Download

Annals of Forest Science, 2010
Download

Download

Oikos, 2015
Download

Journal of Vegetation Science, 1993
Download


Canadian Journal of Forest Research, 2014
Download

Annals of Forest Science, 2004
Download

Botany, 2009
Download


Download

