Journal of Toxicology and Environmental Health, Part B, 15:281–316, 2012
Copyright © Taylor & Francis Group, LLC
ISSN: 1093-7404 print / 1521-6950 online
DOI: 10.1080/10937404.2012.672150
POTENTIAL EFFECTS OF CHLORPYRIFOS ON FETAL GROWTH OUTCOMES:
IMPLICATIONS FOR RISK ASSESSMENT
Pamela J. Mink1,2, Carole A. Kimmel1, Abby A. Li1
1
Exponent, Inc., Health Sciences Group, Menlo Park, California, USA
Department of Epidemiology, Rollins School of Public Health, Emory University,
Atlanta, Georgia, USA
2
Chlorpyrifos (CPF) is one of the most widely used organophosphate insecticides in the United
States. By December 2000, nearly all residential uses were voluntarily canceled, so that today,
CPF is only used to control insect pests on a variety of crops. Periodic review of the potential
effects of CPF on all developmental outcomes is necessary in the United States because the
Food Quality Protection Act mandates special consideration of risk assessments for infants
and children. This article reviews epidemiologic studies examining the association of potential
CPF exposure with growth indices, including birth weight, birth length, and head circumference, and animal studies focusing on related somatic developmental endpoints. It differs
from earlier reviews by including an additional cohort study and providing in-depth systematic evaluation of the patterns of association across different studies with respect to specificity
of biomarkers for CPF, consistency, dose response, strength of association, temporality, and
biological plausibility (Hill 1965), as well as consideration of the potential role of effect modification and bias. The review did not identify any strong associations exhibiting consistent
exposure-response patterns that were observed in more than one of the four cohort studies
evaluated. In addition, the animal data indicate that developmental effects occur at doses that
produce substantial maternal toxicity and red blood cell (RBC) acetylcholinesterase (AChE)
inhibition. Based on consideration of both the epidemiologic and animal data, maternal RBC
AChE inhibition is a more sensitive endpoint for risk assessment than somatic developmental
effects reviewed in this article.
exposure and 8–34 ng/kg-d for chronic dietary
food exposure with food handling establishment uses (U.S. EPA b). Children and adults,
including pregnant females, who are farm
workers or living on or near farms may be
exposed through additional pathways, including dermal or inhalation routes.
CPF and other organophosphates (OP)
are currently regulated based on red blood
cell (RBC) or brain acetylcholinesterase (AChE)
inhibition; the latter is considered to be a
primary mode of action for toxicity, especially related to the acute clinical signs of
Chlorpyrifos (CPF) is an organophosphorus
insecticide, acaricide, and miticide currently
used to control insect pests on a variety of food
and feed crops, most commonly corn. Prior to
June 2000, CPF was also widely used for indoor
pest control and pet collars, but most household uses were phased out beginning in June
2000 and canceled by January 2001 (U.S. EPA
2002; 2006). Therefore, the primary route of
exposure to the general U.S. population of children and adults today is dietary, and such exposure has been estimated to be approximately
0.15–0.32 µg/kg-d for acute dietary food-only
The authors are grateful to Dow AgroSciences LLC for funding support. The analyses, conclusions, and opinions expressed in this
article are solely those of the authors and may not represent those of Dow AgroSciences LLC. The authors also acknowledge editorial
support from Rebecca Edwards, and scientific technical support from Drs. Kimberly Lowe and Laura McIntosh.
Address correspondence to Abby A. Li, Exponent, Inc., Health Sciences Group, Attn: Rebecca Edwards, 149 Commonwealth Drive,
Menlo Park, CA 94025-1133, USA. E-mail: abbyli@exponent.com
281
�282
neurotoxicity following short-term high-dose
exposures. Other modes of action for acute toxicity have also been proposed, including alterations of presynaptic cholinergic functions or
noncholinergic neurochemical processes that
may contribute to differential expression of
toxicity among different OP (Liu and Pope
1998; Pope 1999; Udarbe Zamora et al. 2008).
Young rats are more sensitive to acute effects
of CPF than adults, and these differences may
be attributable, in part, to age differences
in metabolic enzymatic activity, especially at
higher doses (Eaton et al. 2008; Timchalk et al.
2006). Plasma butyrylcholinesterase (BuChE)
inhibition may occur at exposure levels below
those that provide brain or RBC AChE inhibition and is used as a marker of exposure in
occupational settings.
Human and mechanistic animal studies
have led to the hypothesis that developmental
effects occur at subclinical exposure levels by
mechanisms other than AChE inhibition (Rauh
et al. 2006). Slotkin and Seidler (2007) stated
that the fact that prenatal effects are elicited
at “exposures below the threshold for inhibition of fetal brain cholinesterase reinforces
the importance of other mechanisms underlying the developmental neurotoxicity of CPF,
and potentially of other OP, and points to the
inadequacy of cholinesterase activity as the sole
factor for assessing exposure or safety” (426).
Therefore, a systematic evaluation of
human and animal developmental studies is
needed, including comparisons with AChE
inhibition. Careful consideration of all developmental outcomes is important in providing
the scientific basis for risk assessment, including
science policy decisions required by the U.S.
Environmental Protection Agency (EPA) Food
Quality Protection Act (FQPA), which requires
special protections for infants and children.
A companion paper focuses on the developmental neurobehavioral data on CPF (Li et al.
2012). This review focuses on epidemiologic
studies that evaluated associations between
CPF exposure and growth indices, including
birth weight, birth length, and head circumference. This review assesses the evidence for
and against a causal relationship between CPF
P. J. MINK ET AL.
exposure, as measured in umbilical cord blood,
urinary metabolites, or air monitoring samples,
and these outcomes.
The human data for growth indices are
of interest because analyses were reported
for birth outcomes before and after cancelation of residential uses and included data
based on personal maternal monitoring of
CPF exposures. In addition, this review evaluates whether the PON1 genotype, associated with detoxification of the toxic metabolite
chlorpyrifos oxon (CPO), can modify associations between CPF exposure and fetal growth.
Finally, the human data were compared with
animal data for similar outcomes from developmental or reproductive animal studies published in the literature that include at least
3 CPF dose levels and 20 litters/dose group,
which are the standard requirements for developmental toxicity studies based on the U.S.
EPA Guidelines for Developmental Toxicity Risk
Assessment (U.S. EPA 1991).
The present review of the animal and
epidemiologic studies on birth and growth outcomes differs from previous reviews (Clegg
and van Gemert 1999a; Eaton et al. 2008;
Weselak et al. 1999b; 2007; Zhao et al.
2005; 2006;) by contributing in-depth analyses of outcomes and including an additional
study published in 2010 (Barr et al. 2010).
The two 1999 expert panel reports (Clegg
and van Gemert 1999a; 1999b) were written
prior to publication of the epidemiologic studies included in this review. Eaton et al. (2008)
summarized each of the major epidemiologic
studies of CPF exposure and birth outcomes
in children, based on authors’ reported findings, and provided comprehensive analyses of
exposures. This review differs from the Zhao
et al. (2005) review of CPF and birth weight,
the Weselak et al. (2007) review of pesticides and birth outcomes, and the Eaton et al.
(2008) reviews by (1) providing comparisons of
methodologies (including exposure measurement) and results; (2) reporting in tables the
magnitude and direction of associations and
95% confidence intervals so that the reader can
evaluate the precision of estimates and whether
the direction of associations are consistent for
�BIRTH OUTCOMES
similar exposure-outcome associations across
studies; (3) considering the potential role of systematic error (bias); (4) discussing findings from
the human studies in a causal framework (e.g.,
data addressing strength of the association,
consistency across studies, exposure-response
patterns of association); and (5) directly comparing the human data with the relevant animal
data for biological plausibility.
In summary, this article evaluates whether
the epidemiologic data indicate a strong or otherwise meaningful pattern of association of CPF
exposure with birth weight, birth length, and
head circumference at birth across different
cohort studies. This is one of the scientific issues
considered to be of primary importance in
evaluating children’s health assessment for CPF,
including determination of uncertainty factors
required under FQPA.
METHODS
Scope of the Review
The scope of the literature search included
epidemiologic studies that investigated postulated associations between in utero exposure
to CPF and growth endpoints in neonates,
including head circumference, birth weight
and length, and longitudinal growth indices in
children; however, no studies met our inclusion criteria that included longitudinal growth
indices in children. Abdominal circumference
and ponderal index (PI; analogous to the body
mass index in adults) were evaluated in some
studies and results are included. Studies that
reported results for adolescents or adults were
excluded. The literature search was not limited
by the geographic location of the study; however, our review includes only peer-reviewed
studies that were published in English. Case
reports and case series were excluded because
they do not test hypotheses, estimate effects,
or otherwise provide information on associations between an exposure and an outcome.
Studies based on accidental or intentional poisonings were also excluded because this review
is focused on evaluating effects of exposures
resulting from standard uses (e.g., agricultural
and residential).
283
All studies that inferred CPF exposure but
did not directly measure and quantify exposure
levels were excluded. This included any study
that evaluated CPF exposure based on the residential location of the study participant with
respect to agricultural activities (e.g., distance
to nearest farm). Studies that measured air
CPF concentrations at the individual level were
included. Studies that described CPF biomonitoring but did not evaluate an association
between exposure and the growth indices of
interest were evaluated, but were not included
in our final review. Because AChE inhibition
is considered to be a mode of action for CPF,
results on AChE levels and these outcomes from
one of the studies are also reported.
Outcomes of interest were based strictly
on the epidemiologic studies. To address the
question of biological plausibility, animal data
from robust study designs for endpoints related
to those measured in the epidemiologic studies were evaluated. The inclusion criteria for in
vivo animal studies were at least 3 CPF dose
levels and 20 litters/dose level, the minimum
regulatory requirements for reproduction and
developmental studies to enhance confidence
in the data. In addition, the route of exposure had to be relevant to human exposures,
and the period of exposure had to include
gestational exposures. Because there were no
longitudinal epidemiologic studies measuring
height and weight at different ages in children, the literature search for animal studies
was restricted to outcomes of fetal weight or
birth weight. Other relevant findings reported
in these selected animal studies (e.g., AChE
inhibition, maternal toxicity, and general developmental toxicity data) that aid in evaluation of
birth or fetal weight were also evaluated.
Literature Search
The literature search included articles published in English through May 31, 2011. For the
epidemiologic studies, a comprehensive search
of the published literature was conducted in
MEDLINE using the following search terms:
“organophosphate,” OR “organophosphorus,”
OR “chlorpyrifos,” “head circumference,”
�284
P. J. MINK ET AL.
“head size,” “birth weight,” “birth length,”
“weight,” “length,” “fetal growth,” OR “infant
growth,” “Ponderal Index,” “small for gestational age,” “small-for-gestational-age,” “small
size,” “birth outcome.” In addition, reference
lists in recent reviews on CPF were crosschecked to identify any relevant papers that
may have been missed by our search terms.
For the animal studies, MEDLINE was used
to search for published journal animal articles
written in English using the following search
terms: chlorpyrifos and (development or reproduction or developmental) and (“birth weight”
or “body weight” or “fetal weight” or “weight”)
and (rat or rats or mice or mouse or rodent
or mammal or monkey or primate or animal)
NOT (“bugs” or “cockroach” or “in vitro” or
“zebrafish” or “cows” or “cow”). The following inclusion criteria were intended to ensure
robustness and reliability of the animal studies and relevance to the human studies on
birth outcomes: gestational exposures, 3 CPF
dose levels, 20 or more litters per dose group,
the litter was the experimental unit of analyses for fetal or pup birth weight, route of
exposure was relevant to humans (oral, dermal, or inhalation), and data were presented.
Of the 43 papers found, only 11 were original papers involving gestational exposures.
Of these 11 papers, 5 were eliminated because
the sample size was 5–10, the litter was not the
experimental unit, and/or the route of exposure was subcutaneous (sc) injections. Although
the sc injection route might have advantages for
investigative mechanistic studies, it can affect
the pharmacokinetics of CPF, such as bypassing
first-pass metabolism (Marty et al. 2007; Slotkin
et al. 2006), and degree of cholinesterase (ChE)
inhibition and toxicity (Carr and Nail 2008).
An exception was made for one oral study with
a sample size of 10 that was included because
the primary focus of this study was to evaluate
the effect of CPF on body weight (Lassiter et al.
2008).
CPF and OP Biomarkers Included
in This Review
This review focused on studies that
analyzed the associations between biomarkers
of CPF and birth outcomes. The CPF and other
OP biomarkers (Table 1) included in this review
and their specificity to CPF exposure are as
follows (Barr and Angerer 2006; Bravo et al.
2004; Needham 2005):
• CPF and chlorpyrifos-oxon (CPO) are
biomarkers of highest specificity for CPF that
are measured in blood plasma or serum. CPF
is bioactivated to CPO, the primary toxic
active metabolite of concern. Environmental
exposure to CPO is also possible (Barr and
Angerer 2006).
• 3,5,6-Trichloro-2-pyridinol (TCPy) is the most
common urinary biomarker of CPF exposure,
but with important limitations including that
it may reflect exposures other than the parent compound CPF. Briefly, CPO is rapidly
hydrolyzed to TCPy and diethylphosphate
(DEP) (Figure 1). CPF can also be dearylated to form TCPy and diethylthiophosphate
(DETP) (Figure 1). However, TCPy is also
a metabolite of chlorpyrifos-methyl and triclopyr (Barr and Angerer 2006; Whyatt et al.
2009). It is an environmental degradate
present in food, the environment, or homes,
as a breakdown product from exposure to
CPF, CPO, or chlorpyrifos-methyl (Barr and
Angerer 2006; Eaton et al. 2008; Whyatt
et al. 2009). Significant intra-individual variability in repeat urine samples from the same
individual has been observed (Whyatt et al.
2009).
• Diethylphosphates (DEPs) represent a
broad class of OP metabolites measured
in urine that include DEP, DETP, and
diethyldithiophosphate (DEDTP). Only DEP
and DETP are metabolites of CPF (Table 1,
Figure 1). DEPs are relatively nonspecific as
a biomarker of CPF because other OP are
metabolized to DEPs and may be present in
the environment (Table 1).
• Dimethyl phosphates (DMPs) are urinary
metabolites that cannot be formed from
CPF (Table 1). They are metabolites of several methyl OP, including malathion and
chlorpyrifos methyl (a pesticide registered
separately from CPF). These metabolites
are important to consider in evaluation of
whether associations between DAPs and
�BIRTH OUTCOMES
285
TABLE 1. Biomarkers of Organophosphate Exposures and Their Relevance to Chlorpyrifos
Chemical structure
Not a CPF metabolitea
DEPsb
DMPsc
DAPsd
Chemical name
Common acronym
Chlorpyrifos
CPF
Chlorpyrifos-oxon
CPO
3,5,6-Trichloropyridinol
TCPy
Diethylthiophosphate
DETP
√
√
Diethylphosphate
DEP
√
√
Diethyldithiophosphate
DEDTP
√
√
√
Dimethylthiophosphate
DMTP
√
√
√
Dimethylphosphate
DMP
√
√
√
Dimethyldithiophosphate
DMDTP
√
√
√
a Urinary
biomarkers that cannot be formed from CPF.
refers to broad class of urinary OP metabolites containing ethyl groups.
c “DMPs” refers to broad class of urinary OP metabolites containing methyl groups that are not biomarkers of CPF.
d “DAPs” refers to DEPs and DMPs collectively and include OP metabolites that are not biomarkers of CPF.
b “DEPs”
birth outcomes are more relevant to DMPs
compared to DEPs.
• Dialkyl phosphates (DAPs) are a class of
OP metabolites measured in urine, which
include both DEPs and DMPs (Table 1).
Therefore, DAPs are highly questionable
biomarkers of CPF compared to DEPs
because they include metabolites that cannot be formed from CPF. As with DEPs,
DAPs are also a nonspecific environmental
degradate of OP.
EPIDEMIOLOGIC STUDY RESULTS
Epidemiologic Studies Included
in This Review
Table 2 summarizes the study characteristics (including consideration of smoking,
alcohol, and drug exposure) of the eight
epidemiologic reports evaluating the association between CPF exposure and growth
outcomes in neonates. These were reports
from the following four cohorts: the Columbia
Center for Children’s Environmental Health
(CCCEH) (Perera et al. 2003; Rauh et al. 2006;
Whyatt et al. 2004; 2005), the Mount Sinai
Center for Children’s Environmental Health
and Disease Prevention Research (Mt. Sinai)
(Berkowitz et al. 2004; Wolff et al. 2007), the
Center for Health Assessment of Mothers and
Children of Salinas (CHAMACOS) (Eskenazi
et al. 2004), and the New Jersey Cohort of
Pregnant Women and their Children (New
Jersey) (Barr et al. 2010).
All four cohort studies presented results
for head circumference, birth length, and
birth weight. Two studies, the Mt. Sinai study
�286
P. J. MINK ET AL.
H
Cl
Cl
Cl
N
O
S
P
CH3
O
O
CH3
Chlorpyrifos (CPF)
CYP
H
Cl
Cl
Cl
S O
P O
O
O
N
CH3
CH3
-or -
H
H
Cl
Cl
Cl
N
O
Cl
O
P
+
Esterases
O
O
Chlorypyrifos oxon (CPO)
CH3
Cl
CH3
+
N
P
HO
OH
P
O
O
DETP
Phase II
conjugation
DEP
CH3
H
Cl
O
O
CH3
TCPy
O
HO
S
Cl
Cl
CH3
CH3
Cl
N
O-Conjugate
FIGURE 1. Major metabolic pathways of chlorpyrifos metabolism. CPF is metabolized by cytochrome P-450 (CYP). CPO is the primary
toxic metabolite and is detoxified by esterases including carboxylases and paraoxonase (PON1) (color figure available online).
(Wolff et al. 2007) and CHAMACOS study
(Eskenazi et al. 2004), reported results for the
ponderal index, calculated as (birth weight
in g × 100)/(length in cm)3 (Eskenazi et al.
2004). Results for abdominal circumference
were reported only by the New Jersey cohort
study (Barr et al. 2010). Although all four publications cited from the CCCEH cohort reported
results that met our inclusion criteria, the purpose of the publication by Rauh et al. (2006)
was to evaluate associations between prenatal
CPF exposures and neurobehavioral outcomes.
We review those results in a separate article (Li
et al. 2012).
The CCCEH cohort included nonsmoking women, ages 18–35 yr, self-identified as
African American or Dominican residing in
northern Manhattan or the South Bronx for
at least 1 yr before pregnancy (Perera et al.
2003; Whyatt et al. 2004; 2005). The women
were included if they were free of diabetes,
hypertension, or known HIV (human immunodeficiency virus). Covariates included in the
final models were race/ethnicity, gestational
age, parity, maternal prepregnancy weight and
new weight gain during pregnancy, maternal
self-reported environmental tobacco smoke in
the home, sex of the newborn, and season
of delivery. Annual household income, maternal education, maternal marital status, material hardship during pregnancy, and degree of
housing disrepair were not included in the final
model because they did not affect the results
(Whyatt et al. 2004)
The Mt. Sinai cohort included women
pregnant for the first time with one child
without serious chronic diseases such as diabetes, hypertension, thyroid disease, or serious pregnancy complication that could affect
fetal growth and development. The mother
and infant were excluded if there was severe
prematurity or congenital malformation. The
largest ethnic group was Hispanics, followed
by African-Americans and whites. Models
included race/ethnicity, infant sex, and gestational age. Prepregnancy body mass index,
�TABLE 2. Characteristics of the Epidemiologic Studies Reporting Associations Between Chlorpyrifos or Relevant Metabolites and Fetal Growth Outcomes
Study Cohort
and Location
Author
(sample size;
enrollment or birth
dates)
Perera et al. 2003
Columbia
(n = 263;
Center for
n = 113 for
Children’s
plasma) Enrolled
Environmental
9/98–11/99b
Health
(New York,
USA)
Consideration of
tobacco,
ethanol, drug exposure
Chlorpyrifos
measure or
metabolitea
287
CPF (parent
Illicit drug users and
compound)
active smokers were
excluded based on
self-reported history
and plasma cotinine
concentrations
>15 ng/ml. Covariates
included maternal
self-reported
environmental
tobacco smoke in the
home. Cotinine and
alcohol consumption
were not significant
predictors of outcomes
and were not
included.
Detection limit/
mean or median
exposure levels
Source and
timing of sample
Head
circumference
Birth
weight
Birth
length
Detected in 94% of
samples, arithmetic
mean = 7.6 pg/g
Umbilical Cord
Plasmac
X
X
X
Whyatt et al. 2004
(n = 314; n = 286f
cord blood) Births
3/98–7/02
CPF (parent
compound)
31% of CPF samples were
below LOD (LOD not
reported)
Mean = 4 pg/g
(umbilical cord plasma)
Umbilical Cord
X
Plasmac
Personal air
samples were
collected in the
3rd trimester
for two days
X
X
Whyatt et al. 2005
(n = 571;
n = 341 cord
blood) Enrolled
1/98–1/04
CPFd (parent
compound)
X
Umbilical Cord
Detected in 64% of cord
Plasmac
blood samples,
mean = 3.7 pg/g;
Personal air
detected in 99.7% of air
samples were
samples;
collected in the
mean = 14.3 ng/m3
3rd trimester
for two days
X
X
Rauh et al. 2006
(n = 254) Births
2/98–5/02
CPF (parent
compound)
LOD = 0.5–1 pg/g;
80 samples below LOD
Median levels not
provided
X
X
Umbilical Cord
Plasmac
X
Ponderal
index
Abdominal
circumference
(Continued)
�TABLE 2. Continued
Study Cohort
and Location
Author
(sample size;
enrollment or birth
dates)
Mt. Sinai Center Berkowitz et al. 2004
(n = 404) Enrolled
for Children’s
3/98–3/02
Environmental
Health and
Disease
Prevention
Research
(New York,
USA)
Consideration of
tobacco,
ethanol, drug exposure
Women consuming more TCPy
than 2 alcoholic
beverages per day or
using illegal drugs
were excluded.
“Active and passive
cigarette smoking
were not included in
the final models
because they did not
affect the results and
only increased the
variance. (Berkowitz
et al. 2004).
288
DEP, DAP
Wolff et al. 2007
(n = 404) Enrolled
3/98–3/02
The Center for
Health
Assessment of
Mothers and
Children of
Salinas
(California,
USA)
Eskenazi et al. 2004
(n = 488)
10/99–10/00
Chlorpyrifos
measure or
metabolitea
“Smoking, alcohol, and
illicit drug use were
not included in the
models because very
few women reported
use and controlling for
these variables did not
alter the results.”
Environmental
tobacco smoke and
caffeinated beverages
also did not alter the
results and were not
included.
Detection limit/
mean or median
exposure levels
Source and
timing of
sample
Head
circumference
Birth
weight
Birth
length
LOD level = 11.0 µg/L;
57% of samples were
below LOD
Maternal urine
collected in
3rd trimestere
X
X
X
DEP detected in 88.1%,
DAP detected in
97.2%;
Median = 18.1 nm/L
DEP, 75.9 nm/L DAP
Maternal urine
collected
during the 3rd
trimester
X
X
X
X
X
Maternal urine
collected at
mean = 13 wks
(range
4–29 wks) and
mean = 26 wks
(range
18–39 wk)
X
X
X
TCPy, DEP, DAP TCPy detected in 77% of
samples; median 3.3
µg/L DEP and DAP
detected in 99.8% of
samples;
median = 22 nmol/L
for DEP, 136 nmol/L for
DAP
Ponderal
index
Abdominal
circumference
�Study Cohort
and Location
Author
(sample size;
enrollment or birth
dates)
New Jersey
Cohort (New
Jersey, USA)
Barr et al. 2010
(n = 150)
7/03–5/04
289
Consideration of
tobacco,
ethanol, drug exposure
Chlorpyrifos
measure or
metabolitea
Detection limit/
mean or median
exposure levels
Source and
timing of
sample
Head
circumference
Birth
weight
Birth
length
“The vast majority of the
population was
non-smoking (96%).”
Women were
excluded if they were
taking medications
that could interfere
with metabolism of
environmental
chemicals.
No information on
controlling for
smoking, alcohol or
illicit drug use.
CPF (parent
compound)
Maternal Blood:
Mean = 0.09ng/g
(SD = 0.87), Median =
0.0007 ng/g; detected
in 98.6% of samples
Cord Blood:
Mean = 0.55ng/g
(SD = 0.73),
Median = 0.0007;
detected in 62.8% of
samples
Maternal blood
(collected
immediately
prior to birth)
and umbilical
serum
X
X
X
∗ LOD = limit of detection; SD = standard deviation; See footnotes in Table 2 for additional covariates included in the final statistical models.
a CPF = chlorpyrifos; DAP = total dialkyl phosphates; DEP = diethylphosphate; TCPy = 3,5,6-trichloro-2-pyridionol.
b Based on Whyatt et al. 2002 as cited by Perera et al. 2003.
c Maternal blood was used when cord blood was unavailable.
d Chlorpyrifos was also measured in maternal air samples during the third trimester of pregnancy.
e Maternal blood and cord blood was also used to assess PON1 activity at the PON1 polymorphisms.
f Based on 256 cord blood samples plus 31 imputed values based on maternal cord levels.
Ponderal
index
Abdominal
circumference
X
�290
P. J. MINK ET AL.
maternal weight gain, blood lead levels, and
cesarean section delivery were not included
in the final models because they did not
affect the results. Marital status and educational levels were not included in the analysis
because they were “too closely correlated with
race/ethnicity” (Berkowitz et al. 2004).
The CHAMACOS cohort consisted primarily of low-income Latina women living in an
agricultural community in the Salinas Valley,
California, without gestational or preexisting
diabetes, hypertension, twin births, or stillbirths (Eskenazi et al. 2004). Women with
infants diagnosed with congenital anomalies
at birth were included. Approximately 42% of
the women worked in the field during pregnancy or worked at other agricultural jobs
(e.g., packing shed, nursery and greenhouse
work), and 85% had agricultural workers living in their homes during pregnancy. All models
were adjusted for gestational age, and included
variables for maternal age, pregnancy weight
gain, week of initiating prenatal care, parity,
infant sex, mother’s country of birth, body mass
index, and family income.
The New Jersey cohort included women
pregnant with one nonanomalous fetus scheduled for an elective cesarean birth at term
at Saint Peter’s University Hospital in New
Bruswick, NJ. Women were excluded if the
hemoglobin level was less than 8 mg/dl, if
there was evidence for labor or rupture of
membranes at the time of operative delivery, and if they were taking medications that
might interfere with metabolism of environmental chemicals. The statistical models were
adjusted for maternal age, primagravida, maternal prepregnancy body mass index, infant sex,
and gestational age.
Biomarkers of CPF Exposures
The main CPF exposures reported in
the reviewed studies were measured and
quantified from biological specimens obtained
directly from women during pregnancy or from
the umbilical cord at delivery (Table 2). This
included measuring the parent compound CPF
in maternal or umbilical cord blood, as well
as measuring metabolites of CPF in maternal
urine during pregnancy, including TCPy, DEPs,
and DAPs. As discussed in greater detail in
the methods section, TCPy is a more specific biomarker of CPF than the nonspecific
OP urinary metabolites DEPs and DAPs. All
of these urinary metabolites have limitations
as biomarkers for CPF because they may
also reflect exposure to environmental degradates of OP (including CPF) or to other OP
(Needham 2005).
The New Jersey cohort (Barr et al. 2010)
analyzed birth outcomes based on maternal
(immediately prior to birth by Cesarean section) and umbilical cord serum levels of CPF.
Maternal and cord serum samples were not
correlated in the New Jersey cohort (r = 0.12),
and results for these two measures were
reported separately (Barr et al. 2010). In contrast, the CCCEH cohort study (Perera et al.
2003; Rauh et al. 2006; Whyatt et al. 2004;
2005) analyses were based on umbilical cord
plasma levels of CPF at birth and air measurements collected during the third trimester
of pregnancy. In the CCCEH cohort, maternal
plasma levels were used only in cases where
cord samples were not collected because
maternal and cord plasma samples were correlated (r = .76), and estimates of cord plasma
levels from maternal plasma were based on
formulas derived from a regression analysis
(Whyatt et al. 2004). The CPF levels in maternal air samples were collected via a personal
air monitor that was worn in a backpack during the daytime for two consecutive days and
placed by the bed while sleeping during the
third trimester of pregnancy (Whyatt et al.
2005).
The urinary metabolites TCPy, DEPs, and
DAPs were measured in the Mt. Sinai and
CHAMACOS studies (Berkowitz et al. 2004;
Eskenazi et al. 2004; Wolff et al. 2007).
The CHAMACOS and Mt Sinai studies measured the following six DAPs (Eskenazi et al.
2004; Wolff et al. 2007): DEP, DETP, DEDTP,
DMP, DMDTP, and DMTP. The first three were
summed to obtain the total concentration of
DEPs, and the latter three were summed to
obtain the total concentration of DMPs. DAPs
�BIRTH OUTCOMES
were defined as the sum of all the DEPs
and DMPs. DMPs are discussed in this review
only when relevant to interpreting associations
reported for DAPs.
Exposure to OP pesticides was also
assessed in the CHAMACOS study by measuring AChE in whole blood and BuChE in plasma
from mothers during pregnancy and from the
umbilical cord at delivery (Eskenazi et al. 2004;
Wolff et al. 2007). Wolff et al. (2007) also
measured BuChE in maternal plasma during
the third trimester of pregnancy in the Mt.
Sinai study. AChE and BuChE are nonspecific
measures of general exposure to OP and possibly carbamates. Neither cohort study measured
CPF in maternal plasma.
Maternal Information and Self-Reported
CPF Exposure
Each cohort study administered a questionnaire to obtain information on study participants; however, the specific contents of the survey varied across the cohorts. The New Jersey
cohort (Barr et al. 2010) also obtained information about maternal characteristics from
hospital records. In general, the objectives of
the surveys were to obtain information about
demographic characteristics, personal habits,
maternal medical history, and the personal
use of pesticides among the study participants. As described earlier and in Tables 2
and 3, information obtained from the questionnaires may or may not have been used
in the final multivariate models presented in
each study. The CHAMACOS study (Eskenazi
et al. 2004) administered the questionnaire
two times during the pregnancy (first interview:
mean = 13 wk, range = 4–29 wk; second interview: mean = 26 wk, range = 18–39 wk).
The women who participated in the CCCEH
study (Perera et al. 2003; Rauh et al. 2006;
Whyatt et al. 2004; 2005) and the Mt. Sinai
study (Berkowitz et al. 2004; Wolff et al.
2007) completed their surveys during the third
trimester of pregnancy. The timing of questionnaire administration was not stated for
the New Jersey cohort (Barr et al. 2010).
Women in that study were recruited from
291
lists of patients scheduled for elective cesarean
birth, so it seems plausible that questionnaires
were administered during the third trimester of
pregnancy. Although pesticide exposure data
were collected via questionnaire, none of the
studies reported associations between selfreported CPF exposure and any of the birth
outcomes.
Associations of CPF and Metabolites
With Growth Outcomes
Table 3 provides the results of analyses of
growth indices by CPF or metabolite for each of
the reports included in this review. Table 4 summarizes results relevant to the potential interaction of PON1 enzyme activity (phenylacetate
as a substrate) or PON192 genotype and CPFrelated biomarkers of exposure for each of the
growth indices.
Head Circumference
No statistically significant associations were
observed between head circumference and
CPF in blood (maternal serum or umbilical cord
plasma or serum) or with TCPy measured in the
urine in the CCCEH (Perera et al. 2003; Rauh
et al. 2006; Whyatt et al. 2004; 2005), New
Jersey (Barr et al. 2010), Mt. Sinai (Berkowitz
et al. 2004), or CHAMACOS (Eskenazi et al.
2004) cohorts. There was no statistically significant association between maternal personal
air samples of CPF during the third trimester
of pregnancy and head circumference in the
CCCEH cohort (Whyatt et al. 2004).
Associations between head circumference
and the less specific biomarkers DEP and DAP
were in opposite directions in the two studies
that evaluated these associations. Specifically,
the CHAMACOS cohort reported a statistically
significant 0.32-cm increase in head circumference associated with each 1-unit (nmol/L,
log10 scale) increase of the DAP metabolite (no
creatinine adjustment) (Eskenazi et al. 2004).
In contrast, the Mt. Sinai cohort study reported
a statistically significant 0.26 cm decrease in
head circumference for every 1-unit (nmol/L,
log10 scale) increase of the DAP metabolite
�TABLE 3. Summary of growth indices by metabolite
CPF in Blood or Air Samples
TCPy in Urine Samples
DEP and DAP in Urine Samples
HEAD CIRCUMFERENCE (cm)
COLUMBIA COHORT (CCCEH)
Perera et al. 2003a (cord plasma)
292
Ln- CFP (All Participants): Ln-HC β = −0.005, n = 113
Ln- CFP (African American Participants): Ln-HC β =
−0.003, n = 57
Ln- CFP (Dominican Participants): Ln-HC β = −0.005,
n = 56
Whyatt et al. 2004c (cord plasma)
Ln-CPF in cord blood samples: β = −0.01 (95% CI =
−0.13, 0.11), n = 287
Ln-CPF in maternal personal air samples: β = −0.04
(95% CI = −0.18, 0.10), n = 271
Whyatt et al. 2005c (cord plasma)
No association observed between Ln- CFP in blood or air
samples and head circumference (data not shown)
Rauh et al. 2006f (cord plasma)
CPF exposure initially categorized into undetectable
(n = 80) and 3 tertiles in detectable range (n = 65, 39
and 44). Lower 3 groups were combined and
compared with highest group:
Ln-CPF≤6.17pg/g: mean = 34.35 (SD = 1.84), n = 204
Ln-CPF >6.17pg/g: mean = 34.03(SD = 1.69), n = 50
NEW JERSEY COHORT
Barr et al. 2010g
Maternal Serum:
CPF ≤0.0007ng/g: 35.0 in (SD = 1.3), n = 34
CPF >0.0007ng/g: 33.4 in (SD = 0.6), n = 104 (75th
percentile of 138)
Cord Serum:
CPF ≤1.32ng/g: 35.0 in (SD = 1.2), n = 37
CPF >1.32ng/g: 34.9 in (SD = 1.4), n = 111 (75th
percentile of 148)
CHAMACOS
Eskenazi et al. 2004b
No detectable levels (referent), n = 41
TCPy <3.3ug/L: β = 0.06 (95% CI = −0.37, 0.49), n = 220
TCPy ≥3.3ug/L: β = 0.04 (95% CI = −0.39, 0.47), n = 221
CHAMACOS
Eskenazi et al. 2004b
Log10 -DEP: β = 0.28 (95% CI: −0.02, 0.59), n = 486
Log10 -DAP: β = 0.32 (95% CI: 0.03, 0.62), n = 485
MT. SINAI COHORT
Berkowitz et al. 2004d
TCPy<11.0 µg/L: mean = 33.8 (SD = 1.7), n = 216
TCPy >11.0 µg/L: mean = 33.8 (SD = 1.7), n = 171
MT. SINAI COHORT
Wolff et al. 2007e
Log10 -DEP (no creatinine adjustment): β = −0.067 (SE = 0.12),
n = 318
Log10 -DEP (creatinine adjustment): β = −0.052 (SE = 0.12),
n = 318
Log10 -DAP (no creatinine adjustment): β = −0.26
(SE = 0.13), n = 318
Log10 -DAP (creatinine adjustment): β = −0.25 (SE = 0.13),
n = 318
�CPF in Blood or Air Samples
TCPy in Urine Samples
DEP and DAP in Urine Samples
BIRTH WEIGHT (g)
293
COLUMBIA COHORT
Perera et al. 2003a (cord plasma)
Ln- CFP (All Participants): Ln-BW β = −0.04, n = 113
Ln- CFP (African American Participants): Ln-BW β =
−0.05, n = 57
Ln- CFP (Dominican Participants): Ln-BW β = −0.02,
n = 56
Whyatt et al. 2004c (cord plasma)
Ln-CPF in cord blood samples: β = −42.6 (95% CI =
−81.8, −3.8),n = 287
Newborns were categorized into 4 exposure groups:
Group 1 <LOD and Groups 2,3,4 >LOD divided into
low, mid and high tertile exposure groups. Sample
size reported to be 32, 20, 24, 25% for Groups
1,2,3,4, respectively.
Group 1 vs. 2: β = 39.2 (95% CI = −107.3, 185.7),
n = 57
Group 1 vs. 3: β = −50.9 (95% CI = −188.2, 86.3),
n = 69
Group 1 vs. 4: β = −150.1 (95% CI = −287.7, −12.5),
n = 72
Ln-CPF in maternal personal air samples: β = −17.7
(95% CI = −64.2, 28.9), n = 271
Whyatt et al. 2005c (cord plasma)
Ln-CPF in participants born before 1/1/01: β = −67.3
(95% CI = −116.6, −17.8), n = 237
Ln-CPF in participants born after 1/1/01: β = 30.7
(95% CI = −108.6, 169.9), n = 77
No association between air samples and birth weight
(data not shown)
CHAMACOS
Eskenazi et al. 2004b
No detectable levels (referent), n = 41
TCPy <3.3ug/L: β = −6.0 (95% CI = −138, 126), n = 220
TCPy ≥3.3ug/L: β = 27.0 (95% CI = −106, 159), n = 221
MT. SINAI COHORT
Berkowitz et al. 2004d
TCPy <11.0 µg/L: mean = 3284 (SD = 441), n = 216
TCPy >11.0 µg/L: mean = 3296 (SD = 434), n = 171
CHAMACOS
Eskenazi et al. 2004b
Log10 -DEP: β = 52.0 (95% CI: −40.0, 144.0), n = 486
Log10 -DAP: β = 42.0 (95% CI: -46.0, 131.0), n = 485
MT. SINAI COHORT
Wolff et al. 2007e
Log10 -DEP (no creatinine adjustment): β = −52.0 (SE = 32.0),
n = 318
Log10 -DEP (creatinine adjustment): β = −56.0 (SE = 32.0),
n = 318
Log10 -DAP (no creatinine adjustment): β = −25.0 (SE = 34.0),
n = 318
Log10 -DAP (creatinine adjustment): β = −27.0 (SE = 34.0),
n = 318
(Continued)
�TABLE 3. Continued
CPF in Blood or Air Samples
BIRTH WEIGHT (g) Continued
294
COLUMBIA COHORT (cont.)
Rauh et al. 2006f (cord plasma)
CPF exposure initially categorized into undetectable
(n = 80) and 3 tertiles in detectable range (n = 65, 39
and 44). Lower 3 groups were combined and
compared with highest group:
Ln-CPF≤6.17pg/g: mean = 3450.93 (SD = 448.30),
n = 204
Ln-CPF >6.17pg/g: mean = 3239.58(SD = 558.09),
n = 50
NEW JERSEY COHORT
Barr et al. 2010g
Maternal Serum:
CPF ≤0.0007ng/g: 3548 (SD = 448), n = 34
CPF >0.0007ng/g: 3053 (SD = 111), n = 104 (75th
percentile of 138)
Cord Serum:
CPF ≤1.32ng/g: 3544 (SD = 433), n = 37
CPF >1.32ng/g: 3581 (SD = 422), n = 111 (75th
percentile of 148)
TCPy in Urine Samples
DEP and DAP in Urine Samples
�CPF in Blood or Air Samples
TCPy in Urine Samples
DEP and DAP in Urine Samples
BIRTH LENGTH (cm)
295
COLUMBIA COHORT
Perera et al. 2003a (cord plasma)
Ln-CPF (All Participants): Ln-BL β = −0.02, n = 113
Ln-CPF (African American Participants): Ln-BL β =
−0.01, n = 57
Ln-CPF (Dominican Participants): Ln-BL β = −0.02,
n = 56
Whyatt et al. 2004c (cord plasma)
Ln-CPF in cord blood samples: β = −0.24 (95% CI =
−0.47, −0.01), n = 287
Newborns were categorized into 4 exposure groups:
Group 1 <LOD and Groups 2,3,4 >LOD divided into
low, mid and high tertile exposure groups. Sample size
reported to be 32, 20, 24, 25% for Groups 1,2,3,4,
respectively.
Group 1 vs. 2: β = 0.17 (95% CI = −0.70, 1), n = 57
Group 1 vs. 3: β = −0.21 (95% CI = −1, 0.61), n = 69
Group 1 vs. 4: β = −0.75 (95% CI = −1.6 to 0.06),
n = 72
Ln-CPF in maternal personal air samples: β = −0.02
(95% CI = −0.28, 0.25), n = 271
Whyatt et al. 2005c (cord plasma)
Ln-CPF in participants born before 1/1/01: β =
−0.43 (95% CI = −0.73, −0.14), n = 237
Ln-CPF in participants born after 1/1/01: β = 0.07 (95%
CI = −0.65, 0.79), n = 77
No association between air samples and birth length
(data not shown)
Rauh et al. 2006f (cord plasma)
CPF exposure initially categorized into undetectable
(n = 80) and 3 tertiles in detectable range (n = 65, 39
and 44). Lower 3 groups were combined and
compared with highest group:
Ln-CPF≤6.17pg/g: mean = 51.05 (SD = 3.60); n = 204
Ln-CPF >6.17pg/g: mean = 50.02 (SD = 2.41); n = 50
CHAMACOS
Eskenazi et al. 2004b
No detectable levels (referent), n = 41
TCPy <3.3ug/L: β = 0.09 (95% CI = −0.70, 0.87), n = 220
TCPy >3.3ug/L: β = 0.44 (95% CI = −0.35, 1.22), n = 221
CHAMACOS
Eskenazi et al. 2004b
Log10 -DEP: β = 0.40 (95% CI: −0.15, 0.94), n = 486
Log10 -DAP: β = 0.52 (95% CI: -0.01, 1.05), n = 485
MT. SINAI COHORT
Berkowitz et al. 2004d
TCPy <11.0 µg/L: mean = 50.4 (SD = 2.4), n = 216
TCPy >11.0 µg/L: mean = 50.8 (SD = 2.4), n = 171
MT. SINAI COHORT
Wolff et al. 2007e
Log10 -DEP (no creatinine adjustment): β = −0.02 (SE = 0.18),
n = 318
Log10 -DEP (creatinine adjustment): β = 0.017 (SE = 0.18),
n = 318
Log10 -DAP (no creatinine adjustment): β = −0.13 (SE = 0.19),
n = 318
Log10 -DAP (creatinine adjustment): β = −0.13 (SE = 0.19),
n = 318
NEW JERSEY COHORT
Barr et al. 2010g
Maternal Serum:
CPF ≤0.0007ng/g: mean = 51.3 (SD = 3.0), n = 34
CPF >0.0007ng/g: mean = 49.8 (SD = 0.2), n = 104
(75th percentile of 138)
Cord Serum:
CPF ≤1.32ng/g: mean = 51.4 (SD = 3.1), n = 37
CPF >1.32ng/g: mean = 50.9 (SD = 1.7), n = 111 (75th
percentile of 148)
(Continued)
�TABLE 3. Continued
CPF in Blood or Air Samples
TCPy in Urine Samples
DEP and DAP in Urine Samples
PONDERAL INDEX (g/cm3 )
None reported
CHAMACOS
Eskenazi et al. 2004b
No detectable levels (referent), n = 41
TCPy <3.3ug/L: β = −0.01 (95% CI = −0.12, 0.11),
n = 220
TCPy ≥3.3ug/L: β = −0.04 (95% CI = −0.16, 0.08),
n = 221
CHAMACOS
Eskenazi et al. 2004b
Log10 -DEP: β = −0.01 (95% CI = −0.09, 0.07), n = 486
Log10 -DAP: β = −0.04 (95% CI = −0.12, 0.04), n = 485
MT. SINAI COHORT
Wolff et al. 2007e
Log10 -DEP (no creatinine adjustment): β = −0.04 (SE =
0.02), n = 318
Log10 -DEP (creatinine adjustment): β = −0.04 (SE = 0.02),
n = 318
Log10 -DAP (no creatinine adjustment): β = −0.002 (SE =
0.023), n = 318
Log10 -DAP (creatinine adjustment): β = −0.003 (SE = 0.023),
n = 318
ABDOMINAL CIRCUMFERENCE (in.)
296
NEW JERSEY COHORT
None reported
Barr et al. 2010g
Maternal Serum:
CPF ≤0.0007ng/g: mean = 32.0 (SD = 2.7), n = 34
CPF >0.0007ng/g: mean = 29.2 (SD = 0.8), n = 104
(75th percentile of 138)
Cord Serum:
CPF ≤1.32ng/g: mean = 32.0 (SD = 2.7), n = 37
CPF >1.32ng/g: mean = 32.5 (SD = 2.3), n = 111 (75th
percentile of 148)
None reported
Note: bold text indicates p<0.05.
BMI: body mass index; BL: birth length; BW: birth weight; CPF = chlorpyrifos; CI = confidence interval; DAPs = total dialkyl phosphates; DEPs = diethylphosphates; HC = head
circumference; Ln = log transformed; SD = standard deviation; SE = standard error; TCPy = 3,5,6-trichloro-2-pyridionol.
a Adjusted for BMI, parity, cotinine, sex of baby, and gestational age.
b Adjusted for timing of urine collection, timing of entry into prenatal care, maternal age, parity, infant sex, country of birth, weight gain, BMI, poverty level, gestational age, and (gestational
age)2 .
c Adjusted for gestational age of newborn, maternal prepregnancy weight and net weight during pregnancy, newborn sex, parity, race/ethnicity, environmental tobacco smoke in the home,
season of delivery, and for head circumference whether or not the delivery was by cesarean section.
d Adjusted for race/ethnicity, infant sex, and gestational age.
e Adjusted for maternal age, race/ethnicity, maternal BMI x pregnancy weight gain (interaction), infant sex, and gestational age.
f No adjustments reported.
g Adjusted for maternal age, primigravida, race, prepregnancy BMI, infant sex, and gestational age.
�TABLE 4. Summary of PON1 results presented by the Mt. Sinai Cohort that are related to potential CPF biomarker exposure
Berkowitz, et al.
2004a
297
Head circumference (HC; cm)
Birth weight (BW; g)
Birth length (cm)
Ponderal index (g/cm3 )
PON1 Enzyme Activityb
PON1 Enzyme Activity
PON1 Enzyme Activity
Not reported
TCPy < LOD:
Tertile1 PON1 activityc : mean = 33.6
(SD = 1.8), n = 76
Tertile2 PON1 activity: mean = 33.7
(SD = 1.7), n = 62
Tertile3 PON1 activity: mean = 34.1
(SD = 1.7), n = 70
TCPy > LOD:
Tertile1 PON1 activity: mean = 33.3
(SD = 1.5), n = 47
Tertile2 PON1 activity: mean = 34.0
(SD = 1.5), n = 57
Tertile3 PON1 activity: mean = 34.1
(SD = 1.6), n = 55
TCPy < LOD:
Tertile1 PON1 activityc : mean = 3237
(SD = 456), n = 76
Tertile2 PON1 activity: mean = 3255
(SD = 436), n = 62
Tertile3 PON1 activity: mean = 3337
(SD = 444), n = 71
TCPy>LOD:
Tertile1 PON1 activity: mean = 3278
(SD = 395), n = 47
Tertile2 PON1 activity: mean = 3327
(SD = 406), n = 57
Tertile3 PON1 activity: mean = 3270
(SD = 409), n = 55
TCPy < LOD:
Tertile1 PON1 activityd : mean = 50.3
(SD = 2.3), n = 75
Tertile2 PON1 activity: mean = 50.1
(SD = 2.2), n = 62
Tertile3 PON1 activity: mean = 50.3
(SD = 2.3), n = 71
TCPy>LOD:
Tertile1 PON1 activity: mean = 50.9
(SD = 2.3), n = 46
Tertile2 PON1 activity: mean = 51.0
(SD = 2.3), n = 57
Tertile3 PON1 activity: mean = 50.8
(SD = 2.4), n = 55
(p-value for trend in HC across
PON1 tertile levels among
participants with
TCPy>LOD = 0.014)
(p-value for interaction between
PON1 activity and TCPy >0.05)
PON 1 genotypes Q192R, L55M,
−909, −162, −108
No statistically significant results with
TCPy, data not shown
(No statistically significant trends)
(No statistically significant trends)
PON 1 genotypes Q192R, L55M,
−909, −162, −108
No statistically significant results with
TCPy, data not shown
PON 1 genotypes Q192R, L55M,
−909, −162, −108
No statistically significant results with
TCPy, data not shown
(Continued)
�TABLE 4. Continued
Wolff, et al. 2007d
Head circumference (HC; cm)
Birth weight (BW; g)
Birth length (cm)
Ponderal index (g/cm3 )
No interactions between PON1 enzyme
or PON192 genotype and head
circumference by DAPs (data
analyzed but not shown; DEPs not
tested)
PON1 Enzyme Activity
Interactions between
PON192 genotype and birth length
by DAPs or DEPs were tested but
results were not reported
No statistically significant association
between PON1 enzyme or PON192
and Ponderal Index by DEP levels
(data not shown)
298
Maternal Log10 -DEPs < Median Level:
Tertile1 PON1 activityc : mean = 3305
(SE = 53), n = 60
Tertile2 PON1 activity: mean = 3348
(SE = 57), n = 53
Tertile3 PON1 activity: mean = 3396
(SE = 64)† , n = 45
Maternal Log10 -DEPs > Median Level:
Tertile1 PON1 activity: mean = 3233
(SE = 56)† , n = 53
Tertile2 PON1 activity: mean = 3282
(SE = 57), n = 51
Tertile3 PON1 activity: mean = 3279
(SE = 54), n = 56
(p-value for interaction between
PON1 and DEPs = 0.88)
(† p-value for BW among participants in
3rd tertile (higher PON1 enzyme
activity) and DEPs< median level
versus participants in 1st tertile (lower
PON1 enzyme activity) and
DEPs>median level = 0.042, 164g
difference)
�Head circumference (HC; cm)
Wolff, et al. 2007d
(continued)
Birth weight (BW; g)
Birth length (cm)
Ponderal index (g/cm3 )
PONQ192R Genotype
Maternal Log10 -DEPs < Median Level:
PON192RR (slow): mean = 3346
(SE = 69), n = 39
PON192RQ (medium): mean = 3278
(SE = 46), n = 84
PON192QQ (fast): mean = 3453
(SE = 60)‡ ||, n = 33
Maternal Log10 -DEPs > Median Level:
PON192RR (slow): mean = 3254
(SE = 63)‡, n = 55
PON192RQ (medium): mean = 3285
(SE = 50), n = 66
PON192QQ (fast): mean = 3232
(SE = 52) ||, n = 42
299
(p-value for interaction between
PON192 and DEPs = 0.076)
(‡p-value for BW among participants
with PON192QQ and DEPs< median
level versus participants with
PON192RR and DEPs>median levels
= 0.020, 199g difference)
(|| p-value for BW among participants
with PON192QQ and
DEPs < median level versus
participants with PON192QQ and
DEPs > median levels = 0.005)
Note: Bold text indicates statistical significance for trends across PON1 tertiles subdivided by CPF related biomarker exposure, or statistically significant interactions between PON1 or
PON genotype and relevant biomarkers (DEP, DAP, TCPy).
a Adjusted for race/ethnicity, infant sex, and gestational age.
b Phenylacetate was used as substrate for all PON1 enzyme assays in this table.
c Maternal PON1 activity was categorized based on tertile distribution. Wolff et al. 2007 describes tertiles as tertile 1: <96 mg/m-mL (slow activity); tertile 2: 97–116.6 mg/m-mL; tertile 3:
116.7–200 mg/m-mL (fast activity). Berkowitz et al. 2004 did not provide details on tertile distribution, but we assume the tertiles are defined similarly because of nearly identical cohort (both have
sample size of 404 with only minor discrepancies in the reported characteristics of population).
d Adjusted for race, sex, gestational age, and creatinine level. Urinary metabolites included samples with creatinine >20 mg/dL. PON activity was cut at >96 and <116.7 µg/mL/min for the
second tertile.
�300
P. J. MINK ET AL.
(no creatinine adjustment) (Wolff et al. 2007).
Wolff et al. (2007) also reported a numerical 0.25 cm decrease in head circumference
associated with the DAP metabolite when the
model was adjusted for creatinine. A similar discordant pattern was reported across the
CHAMACOS and Mt. Sinai cohorts for the DEP
metabolite; however, these associations were
statistically nonsignificant (Table 3).
Birth Weight
The CCCEH cohort study reported no statistically significant associations between personal air levels of CPF collected over a
period of 48 h during the third trimester of
pregnancy and birth weight. However, there
were statistically significant inverse associations
between umbilical cord plasma CPF and birth
weight in four separate publications of data
from the CCCEH cohort. Specifically, Perera
et al. (2003) reported a statistically significant
0.04-g decrease in the log of birth weight
among all participants in the cohort for every
unit increase (log-transformed pg/g) in CPF.
Statistically significant results of a similar magnitude were observed for African American
participants but not Dominican participants.
Subsequent analyses did not stratify results on
ethnicity, because the tests for interaction were
statistically nonsignificant. Information beyond
the lack of significance of the statistical tests
of interaction was not provided in the other
CCCEH reports. Thus, in the absence of stratified data, it is unknown whether patterns of
association were materially similar or different
for the two ethnic groups, regardless of the
results of the statistical tests for other CCCEH
publications.
Whyatt et al. (2004) reported a statistically significant 42.6-g decrease for each
unit increase (log transformed pg/g) of CPF.
Additional analyses indicated that this association was not strictly monotonic, and was
driven by stronger associations at higher levels of exposure. Specifically, when stratified
into 4 exposure groups (CPF levels < LOD
[level of detection], CPF levels > LOD divided
into tertiles), the birth weight in the highest
exposure tertile averaged 150 g lower (95% CI:
–28.7 to –12.5) than the undetectable group,
whereas the birth weight in the lowest exposure tertile was 39.2 g higher on average (95%
CI: –107.3 to 185.7g) (Table 3). Rauh et al.
(2006) reported that participants with CPF levels > 6.17 pg/g had a statistically significant
lower mean birth weight than participants with
CPF < 6.17 pg/g (3239.58 g versus 3450.93 g,
respectively). This cutoff point (6.17 pg/g) was
based on combining the undetectable group
with the two lower tertiles into a new “lowexposure” group and comparing to the upper
tertile.
In 2000–2001, the U.S. EPA implemented
regulatory actions to phase out the residential use of CPF. Whyatt et al. (2005) reported
that children in the CCCEH cohort born prior
to January 1, 2001, had a statistically significant 67.3-g decrease in birth weight per
unit increase in CPF (log transformed pg/g;
n = 237). In contrast, the association was
positive and statistically nonsignificant among
children born after that date (n = 77). A similar
analysis using third-trimester personal ambient
air samples of CPF was statistically nonsignificant for children born both before and after
January 1, 2001 (Whyatt et al. 2004).
There were no statistically significant associations between CPF in maternal serum and
umbilical cord serum and birth weight in the
New Jersey cohort study, which enrolled participants beginning in July, 2003, after cancelation
of residential uses (Barr et al. 2010) (Table 3).
None of the reported associations between
TCPy (Berkowitz et al. 2004; Eskenazi et al.
2004), DEP or DAP (Eskenazi et al. 2004; Wolff
et al. 2007), and birth weight in the Mt. Sinai
and CHAMACOS studies was statistically significant, and the associations varied in magnitude,
with both negative (inverse) and positive findings. Residential exposures to OP pesticides,
including CPF, in the Mt. Sinai study have
been considered to be relatively similar to the
CCCEH study in terms of pathway, amount,
rate, and type (Needham 2005), and TCPy is a
relatively specific biomarker of CPF compared
to other urinary metabolites. As described
previously, however, TCPy levels may reflect
�BIRTH OUTCOMES
exposures other than, or in addition to, CPF
(parent compound) (Barr and Angerer 2006;
Needham 2005). Nevertheless, the inverse
associations between umbilical cord CPF levels and birth weight reported by the CCCEH
cohort study were not corroborated by a similar
cohort in New York with residential exposures
and data on TCPy and DEP; nor did the CCCEH
investigators observed similar findings based on
air monitoring data.
Birth Length
The CCCEH (Perera et al. 2003; Rauh et al.
2006; Whyatt et al. 2004; 2005) and New
Jersey cohorts (Barr et al. 2010) evaluated the
association between CPF in serum and birth
length. There were no statistically significant
associations between CPF in maternal serum
and umbilical cord serum and birth length in
the New Jersey cohort (Barr et al. 2010). The
CCCEH cohort studies reported mixed results,
depending on the analysis. Specifically, Perera
et al. (2003) reported a statistically significant
0.02-cm decrease in birth length among all
participants for every unit increase (log transformed pg/g) in cord plasma CPF. Statistically
significant results of similar magnitude were
observed among the Dominican participants
but not the African American participants. This
was in contrast to the pattern observed by
Perera et al. (2003) for birth weight, a pattern that appeared to be limited to African
American infants. As discussed previously for
birth weight, subsequent analyses that reported
data on birth length did not stratify on ethnicity,
because the statistical tests for interaction were
nonsignificant (Rauh et al. 2006; Whyatt et al.
2004; 2005). Whyatt et al. (2005) observed
that children born prior to January 1, 2001, had
a significant 0.43-cm decrease in birth length
for every unit (log transformed pg/g) increase
in cord plasma CPF, but there was essentially no association among newborns after
this date.
When stratified into 4 exposure groups
(CPF umbilical cord levels < LOD, CPF levels > LOD divided into tertiles), the birth
length in the highest exposure group averaged
301
0.75 cm less than in the group with CPF
levels below the LOD; however, this association
was statistically nonsignificant and the overall pattern did not appear monotonic (Whyatt
et al. 2004) (Table 3). Rauh et al. (2006)
reported similar mean birth lengths (50.02 cm
versus 51.05 cm, respectively) among participants with CPF > 6.17 pg/g versus those
with CPF < 6.17 pg/g. Despite the statistically significant inverse association reported
in the linear regression analyses (Perera et al.
2003; Whyatt et al. 2004; 2005), analyses that
compared each exposure tertile to the nondetect group yielded statistically nonsignificant
results (Whyatt et al. 2004), and the mean
birth length was similar for the highest exposure
tertile compared to the other groups combined
(Rauh et al. 2006). Furthermore, there were no
material or statistically significant associations
between personal air levels of CPF and birth
length in the CCCEH cohort.
None of the reported associations between
TCPy (Berkowitz et al. 2004; Eskenazi et al.
2004), DEP or DAP (Eskenazi et al. 2004; Wolff
et al. 2007), and birth length was statistically
significant. The direction of the associations for
the DEP and DAP metabolites was generally
positive in the CHAMACOS cohort (Eskenazi
et al. 2004) but mostly negative in the Mt. Sinai
cohort (Wolff et al. 2007). Taken together, the
evidence for an association between CPF and
birth length is weak.
Ponderal Index and Abdominal
Circumference
The associations between TCPy and/or
DEP and DAP and ponderal index were evaluated in the CHAMACOS (Eskenazi et al.
2004) and Mt. Sinai cohorts (Wolff et al.
2007), with generally null findings. The association between CPF and abdominal circumference of the neonate was evaluated by the
New Jersey cohort (Barr et al. 2010). Mean
abdominal circumference was approximately
the same for participants categorized above or
below the 75th percentile for CPF levels in
maternal and umbilical cord sera (Barr et al.
2010).
�302
P. J. MINK ET AL.
Potential Effect Modification
by PON1 Status
Analyses based on PON1 polymorphisms and enzyme activity were included
only in reports from the Mt. Sinai cohort
study (Berkowitz et al. 2004; Wolff et al.
2007). Briefly, CPF is metabolized to the
toxic metabolite CPO, which is then rapidly
hydrolyzed to TCPy by microsomal esterases
including PON1 and CPF oxonase, or by
nonenzymatic hydrolysis (Needham 2005).
The authors were interested in evaluating if
any effects of exposure to OP may be modified
by PON1 enzyme activity level or genotype.
Table 4 summarizes results relevant to
the potential interaction of PON1 enzyme or
PON1 genotype and CPF-related biomarkers
of exposure that were presented in two
reports from the Mt. Sinai Study (Berkowitz
et al. 2004; Wolff et al. 2007). Berkowitz
et al. (2004) stratified maternal PON1 enzyme
activity into “low,” “medium,” and “high”
based on the tertile distribution. The range
of PON1 enzyme activity in the different
PON1 tertiles was not described, but the cut
points for PON1 enzyme activity (as measured in plasma using phenylacetate as a substrate) are assumed to be <96, 97–116.6, and
116.7–200 mg/m-ml for PON1 tertiles 1, 2 and
3, respectively, as reported for the same cohort
by Wolf et al. (2007).
Berkowitz et al. (2004) analyzed associations among TCPy; PON1 activity for each
of five PON1 genotypes; and birth weight,
birth length, or head circumference. The five
different PON1 genotypes (Q192R, L55M, –
909, –162, and –108) were measured in
maternal blood samples obtained during the
third trimester and cord blood samples were
obtained at birth. Wolff et al. (2007) evaluated associations among DEPs, DMPs, or DAPs;
maternal blood (third trimester) PON1 activity or PONQ192R genotype; and birth weight,
birth length, or head circumference. Berkowitz
et al. (2004) considered mothers with genotype
PON192 RR and PON192 QQ to possess the
phenotype of higher and lower PON1 activity,
respectively, based on previous research.
There were no statistically significant interactions between PON1 activity and TCPy levels for any of the birth outcomes (Berkowitz
et al. 2004). There was a statistically significant
positive trend in head circumference across
PON1 tertiles among those with TCPy levels
above the limit of detection (LOD), but not
below the LOD (Table 4). However, the magnitude of the head circumference for these
infants was similar across PON1 activity tertiles
for the TCPy < LOD groups (33.6, 33.7, and
34.1 cm) and TCPy > LOD group (33.3, 34,
and 34.1 cm) (see Table 4). Given the absence
of a main effect for TCPy, and the similarity of
patterns among those with TCPy levels above
and below the LOD, it is not surprising that
the test for interaction between PON1 activity and TCPy levels for head circumference
was statistically nonsignificant. Furthermore, a
significant trend was observed in head circumference when PON1 activity was considered
alone, without level of TCPy, with adjusted
means of 33.5, 33.9, and 34.1 cm for tertiles 1, 2, and 3, respectively. Thus, there is
uncertainty about the contribution CPF exposure has on observed PON1 associations in the
Mt. Sinai Study. At present, evidence that CPF
may exert a detrimental effect on head circumference in infants of mothers who exhibit low
PON1 activity is weak.
Wolff et al. (2007) reported “weak, nonsignificant inverse associations” with three birth
outcomes (independent of PON1 status): DEPs
with birth weight, DEPs with ponderal index,
and DAPs with head circumference (Wolff
et al. 2007). Based on these results, interactions
between levels of DEPs or DAPs and PON1 status were evaluated. In addition, birth length
was shorter by 0.68 cm among mothers with
PON192RR (slower) than PON192QQ (faster)
genotype independent of biomarker exposure
(Wolff et al. 2007).
There was no statistically significant interaction among DEP level, PON1 activity level,
and birth weight; however, there was a
statistically significant 164 g (5%) decrease
in birth weight of babies born to mothers
with slow PON1 enzyme activity and DEP
levels above the median compared to babies
�BIRTH OUTCOMES
born to mothers with fast PON1 enzyme
activity and DEP levels below the median
(Table 4). A similar pattern was observed
in the PONQ192R/DEP interaction analyses,
in which babies born to women with the
PON192RR genotype (slow) and DEP levels
above the median weighed 199 g less (6%
decrease) than babies born to women with the
PON192QQ genotype (fast) and DEP levels
below the median, but the test for interaction
was not significant. In addition, the birth weight
of babies born to women with the PON192QQ
genotype who had DEP levels below the
median was higher than for babies born to
women with the PON192QQ (fast) genotype who had DEP levels above the median,
but similar comparisons across heterozygotes
and those with PON192RR (slow) genotypes
were statistically nonsignificant. There was no
statistically significant effect modification of
PON1 activity by TCPy on birth weight for
the same cohort (Berkowitz et al. 2004); thus,
the interpretation of the DEP-PON1 activity
or genotype findings with respect to CPF is
not clear. Only results of analyses of DEPs,
PON1 status, and birth weight were reported
by Wolff et al. (2007). Wolff et al. (2007)
stated that after taking into account the interaction of DAPs with PON1, a “small effect” of
DAPs on head circumference (Table 3) was no
longer present and there were no statistically
significant associations with Ponderal Index.
Acetylcholinesterase (AChE)
and Fetal Growth
The CHAMACOS study (Eskenazi et al.
2004) measured AChE levels in maternal blood
collected at the second pregnancy interview, in
umbilical cord blood, and in predelivery maternal blood. None of these measures was statistically significantly associated with the three
fetal growth measures of interest, specifically
head circumference, birth weight, or birth
length. There was no significant correlation
between DAP levels and ChE levels collected
at the second pregnancy interview (Pearson
r = .02). Furthermore, somewhat surprisingly,
there was a weakly positive but statistically
303
significant correlation between DAPs measured
in pregnancy urine and predelivery maternal blood (Pearson r = .11) and umbilical
cord blood AChE levels (Pearson r = .13).
Eskenazi et al. (2004) suggested that this deviation from the expected negative correlation
may be a result of “substantial measurement
error” in both variables, and/or because DAP
metabolites are specific to OP, whereas AChE
activity may also reflect exposure to n-methyl
carbamate (Eskenazi et al. 2004). The Mt. Sinai
study measured BuChE in maternal blood and
observed no association between DEP or DAP
exposures or birth outcomes with maternal
BuChE in the Mt. Sinai Study (Wolff et al.
2007).
DISCUSSION OF EPIDEMIOLOGIC
STUDIES
Our review of the data from four
epidemiologic cohort studies identified a number of statistically significant results, several
resulting from different analyses of the same
exposure–outcome association in the same
cohort study using different exposure modeling approaches or study population subgroups
(e.g., CPF measured in cord plasma and birth
weight in the CCCEH study, Table 3). There
were no notable or consistent patterns of association across the different cohort studies. One
possible reason for the lack of consistency
across the studies is, of course, that there is
no “true” causal association between exposure
to CPF and any of the fetal growth outcomes
evaluated in these studies. Alternative explanations for these data should also be considered.
For example, no more than two of the four
cohort studies evaluated associations between
the same biomarker of exposure and the same
outcome. Thus, one needs to consider the studies in terms of the level of information they
provide about CPF specifically (as opposed to
information about OP, generally), as well as
what is meant by “consistent findings” in the
context of these four studies.
Two of the cohort studies (CCCEH and
New Jersey) measured CPF in umbilical cord
�304
blood (plasma or serum). A strength of this
approach is the use of a biomarker that is specific to CPF (Barr et al. 2010; Perera et al.
2003; Rauh et al. 2006; Whyatt et al. 2004;
2005). Furthermore, the biomarker represents
all sources of exposure (e.g., inhalation, ingestion, dermal). A limitation of this approach is
that exposure and outcome information were
measured at roughly the same point in time,
making it difficult to establish a temporal relationship between exposures during gestation
and outcome. The half-life of CPF in blood
is relatively short, about 24 h (Barr et al.
2010). If exposure is relatively constant over
time, then cord blood levels at birth may represent exposure levels throughout pregnancy;
however, there were no data available to validate this assumption. In the CCCEH study,
personal air monitoring CPF levels measured
during the third trimester of pregnancy were
only weakly correlated with CPF levels in cord
plasma (r = .19) or maternal plasma at delivery
(r = .21) (Whyatt et al. 2005).
There were no significant associations
between personal air CPF levels measured during the third trimester on any of the birth
outcomes (Whyatt et al. 2004; 2005). These
associations between personal air CPF levels
and birth outcomes remained nonsignificant
when analyses were stratified on year of delivery before versus after January 1, 2001 (Whyatt
et al. 2004). Indoor (collected continuously
from 32nd week of pregnancy until delivery)
and maternal personal air levels (collected over
48 h during 32nd week of pregnancy) of CPF
were correlated (r = .85) and both declined
four- to fivefold between 2001 and 2004 after
the ban on residential uses (Whyatt et al.
2007). Maternal personal air levels also correlated with indoor samples collected immediately (r = .86) and 8 wk after (r = .87) the
maternal air sampling (Whyatt et al. 2007).
This suggests that maternal personal air levels
of CPF may be reflective of inhalation exposures over 2 mo during the 3rd trimester of
pregnancy that result from indoor residential
uses. A limitation is that personal air samples may not reflect all possible routes of
exposure. The extent to which noninhalation
P. J. MINK ET AL.
routes of exposure contributed to residential
exposures is uncertain (Whyatt et al. 2009).
The Mt. Sinai and CHAMACOS cohort studies had the advantage of estimating exposure
based on maternal urine samples collected during pregnancy; thus, exposure measurement
clearly preceded measurement of fetal growth
outcomes and may better represent a time
period of critical growth and development.
On the other hand, these cohorts used less
specific biomarkers of CPF exposure, namely,
TCPy, DEPs, and DAPs. As discussed previously, the metabolites in urine may reflect
exposures other than, or in addition to, CPF.
All of the studies suffered by relying on measurements collected at one (or at most, two)
points in time. The extent to which the measures used in these analyses provided a valid
estimate of exposure to CPF and/or other OP
during the course of pregnancy is uncertain.
For example, in a biomarker validation study
(n = 102), conducted between 2001 and 2004,
the CCCEH investigators (Whyatt et al. 2009)
reported no marked association between CPF
in cord plasma and the following other exposure measures: personal and indoor air CPF
levels, maternal self-reported pesticide use, and
TCPy levels in maternal samples during pregnancy or after delivery. A limitation of this
validation study was the relatively low proportion of subjects with detectable CPF cord
blood levels (19–29% of cord blood samples in
2001–2002, and none of the samples collected
in 2003–2004) (Whyatt et al. 2009). A previous report from the CCCEH study indicated
that even though CPF in maternal personal air
samples also decreased from 2001 to 2004,
CPF was still detectable in almost all of the air
samples (Whyatt et al. 2007).
Another possible explanation for the lack
of consistent findings is different levels of
exposure to CPF across the studies. Briefly,
CPF exposure levels in the two New York
cohorts have been estimated to be higher than
exposures in the CHAMACOS cohort (Eaton
et al. 2008; Eskenazi et al. 2004). The main
source of exposure in both of the New York
cohorts was home pesticide use, whereas in the
CHAMACOS study, the likely sources included
�BIRTH OUTCOMES
diet and agricultural use. CHAMACOS participants reported working in the fields (28%) or
at other jobs in agriculture, including packing shed, nursery, and greenhouse work (14%).
Furthermore, Eskenazi et al. (2004) reported
that few of the products found in the homes
of CHAMACOS cohort study participants contained CPF.
The New Jersey cohort was assembled after
home use of CPF had been phased out (July,
2003–May, 2004), and the time span of the
CCCEH study includes both pre- and post-ban
periods (1998–2002). The median cord sera
CPF level reported for the New Jersey cohort
was 0.0007 ng/g (0.7 pg/g) (Barr et al. 2010),
which is lower than the mean cord plasma CPF
level of 4 pg/g for the CCCEH cohort (Barr
et al. 2005; Whyatt et al. 2004; 2005). Whyatt
et al. (2004; 2005) presented data from the
CCCEH stratified on date of birth before and
after January 1, 2001, in an effort to evaluate the potential impact of the cancellation
of residential use of CPF. Inverse associations
between cord blood CPF and birth weight
and birth length observed among births prior
to 2001 were no longer present after January
1, 2001. Whyatt et al. (2004) reported that
cord plasma CPF levels in the CCCEH study
were significantly lower among newborns after
January 1, 2001 (geometric means of 0.6 pg/g
after January 1, 2001, compared to 2.5 pg/g
prior to January 1, 2001). Whyatt et al. (2004)
also commented that few newborns had high
CPF exposure levels after 2001, but did not
report the number exposed at different levels. Furthermore, Rauh et al. (2006) observed
no statistically significant difference in mean
birth length among newborns with cord blood
CPF levels in the upper versus lower exposure
categories (Table 3). Thus, further evaluation
of the pattern of associations for birth length
(and birth weight) at different exposure levels
(i.e., dose response), including a comparison
of these dose-response associations during the
two time periods, may be helpful. One would
expect the magnitude of associations at given
exposure levels to be approximately the same
regardless of the time period. Further analyses to evaluate other factors that potentially
305
changed over time and may influence fetal
growth may also be helpful, because these factors may also explain some of the changes
observed. Finally, it should be noted that CPF
biomarker levels in the CCCEH study were
variable as reported by Rauh et al. (2006).
Rauh et al. (2006) reported the logarithmically transformed mean CPF level in cord blood
for three time periods as follows: 0.92 pg/g
(preban, before January 2000), 0.81 pg/g (midban, January 2000 to December 2000), and
0.90 pg/g (postban, January 2001 and later).
The potential role of uncontrolled or
incompletely controlled confounding also
needs to be considered as possible explanations for the weak to modest associations
observed. The results from the New Jersey
cohort study (Barr et al. 2010) were initially consistent with those of the CCCEH
study for birth weight and birth length until
they adjusted for covariates. The New Jersey
study adjusted for fewer covariates overall
compared to the CCCEH study, but there were
some differences. Specifically, the New Jersey
study adjusted for maternal age, whereas the
CCCEH study did not. The New Jersey study
adjusted for prepregnancy body mass index
(BMI), whereas the CCCEH study adjusted
for prepregnancy weight and net pregnancy
weight gain. The differences in adjustment for
these variables may or may not have changed
the results.
Study design features resulted in few or no
preterm births being included in the New York
and New Jersey cohorts. Eskenazi et al. (2004)
observed a lower rate of preterm births, a
major cause of low birth weight, in the
CHAMACOS cohort (6.4%) compared with
Mexican-born women in the United States
(10%). Relatively few women in any of the
four cohort studies reported smoking during
pregnancy. Specifically, approximately 6%, 5%,
and 4% of the women in the CHAMACOS
study, Mt. Sinai Study, and New Jersey study,
respectively, reported smoking during pregnancy (Barr et al. 2010; Eskenazi et al. 2004;
Wolff et al. 2007). Women were excluded from
the CCCEH study if they reported any smoking
during pregnancy or if cotinine levels in blood
�306
collected at delivery were above 15 ng/mL
(Whyatt et al. 2004). Despite this restriction on
maternal smoking, 38% of the women in the
CCCEH study reported a smoker in the home
(Whyatt et al. 2004), whereas only 8.3% of
women in the CHAMACOS study reported living with a smoker during pregnancy (Eskenazi
et al. 2007). Only the CCCEH study reported
results after adjustment for either environmental tobacco smoke or cotinine. Investigators
from the CHAMACOS study indicated that
results were similar after adjustment for either
maternal smoking or environmental tobacco
smoke, and that they did not include maternal
smoking in the final model in part because of
small numbers (Eskenazi et al. 2004).
Regression modeling methods were used
to evaluate the association between these
metabolite levels and fetal growth outcomes,
particularly head circumference, birth weight,
and birth length. The regression models
reported varied within and across the studies
by several key factors, including the metabolite
measured, the timing of exposure measurement (pregnancy or delivery), timing of data
collection (before or after home use of CPF
was banned), and the outcome. In addition,
modeling choices such as using continuous versus categorical variables, performing logarithmic transformations on continuous variables,
and inclusion of additional covariates varied
across the studies. These differences need to be
considered when evaluating the findings across
studies. In addition, linear regression models
were used for many analyses, but most studies did not describe models that tested this
assumption of linearity or that formally evaluated nonlinearity. As one example, it would
have been helpful if CCCEH investigators had
offered guidance in interpreting the validity of
the linear regression models in view of the
results of the analyses of the categorical analyses, which indicated a possible nonlinear component to the association between CPF and
birth weight (Whyatt et al. 2004).
Measures of fetal growth (birth weight,
birth length, and head circumference) may be
considered more objective than measures of
cognitive or psychomotor development, but
P. J. MINK ET AL.
these endpoints are also subject to a number
of sources of variability. These include genetic
variables such as height and weight of the parents, nutrition, and uncertainties around dating
of gestational age at birth (i.e., time from conception), as well as measurement error.
Considered together, the results from the
four cohort studies have not indicated a consistent, strong association between biomarkers
of CPF exposure and measures of fetal growth
across the different cohort studies. A clear pattern of associations did not emerge when considering the relative specificity of the different
biomarkers used in the studies, because essentially null results were observed for the New
Jersey cohort study, which used CPF in cord
serum as a biomarker, or for the CHAMACOS
study, which used the biomarker TCPy (in addition to the less specific biomarkers DEP and
DAP). It should be noted, however, that CPF
measures in the New Jersey cohort study indicated very low exposure levels, which is not
surprising, given that the study was initiated
after home use of CPF was banned in the
United States. The CCCEH and Mt. Sinai cohort
studies observed statistically significant results
for different biomarker-outcome associations,
and there was no corroboration of any finding across studies. Thus, it would be premature
to draw causal conclusions based on these
inconsistent, uncorroborated findings.
ANIMAL STUDY RESULTS
Five research papers met our inclusion criteria of robust studies with data on birth weight,
growth, and fetal crown–rump length after gestational and early postnatal exposure to CPF
(Table 5). Two papers included results of two
separate animal studies in mice (Deacon et al.
1980) and rats (Breslin et al. 1996). One of
the papers was a developmental neurotoxicity
study in rats (Maurissen et al. 2000), but
because this review focuses on pup birth
growth measures, only those endpoints are
discussed here. Brief summaries of other general developmental and maternal toxicity are
also discussed relative to the primary outcomes
of interest. One additional paper found that
�TABLE 5. Birth outcomes and other related measures in animal CPF studies
Exposure route,
duration, and dose
levels (mg/kg-d)
Species and
number of litters
(litters/dose group)
Breslin et al.
1996
Developmental
Gavage GD6-15
0, 0.1, 3, 15
Fischer 344 rats
N=24–29
0.1 mg/kg-d based on
↑fetal weight (however,
authors consider
NOAEL >15 based on
historical control data)
Breslin et al.
1996
Reproduction
Diet 10 wk prior to
mating for
2 – generations
0, 0.1, 1, 5
Sprague-Dawley
rats
F1: 1 mg/kg-d based
on ↓ pup weight at 5
mg/kg-d in male and
female pups on Day 1
(not statisitically
significant).
Reference
Type of Study
F1 N=24–30
F2 N=22–26
NOEL fetal or pup birth
weight
307
F2: 0.1 mg/kg-d based
on ↓ pup weight in F2
male on Day 1 (not stat
sig; 1 mg/kg-d not
considered by authors
to be treatment related)
NOEL pup mortality
or dead fetuses
>15 mg/kg-d
F1: 1 mg/kg-d
F2: 1 mg/kg-d
(however, authors
consider loss of 5
litters at 5 mg/kg-d
compared to 3 in
controls not
treatment-related)
NOEL maternal
toxicity
NOEL maternal
RBC or brain ChEI
NOEL pup RBC or
brain ChEI
3 mg/kg-d based on
clinical signs of ChEI
0.1 based on RBC
ChEI (sacrificed
GD15, 4 h after
dosing)
Not measured
1 mg/kg-day based
on, histopathology in
adrenal cortex,
evidence of maternal
neglect, slight
decreases in feed
consumption during
last 2 wk of lactation
F1 and F2: 0.1
mg/kg-d RBC
ChEI; 1 mg/kg-day
brain ChEI
(sacrificed 25–27
wk of age following
19–21 wk of
exposure)
Not measured
>5 mg/kg-d based on
clinical findings during
gestation
Maurissen et al.
2000 and
Mattsson et al.
2000
Developmental
Neurotoxicity
Gavage GD6-LD10
0, 0.3, 1, 5
Sprague-Dawley
rats N=20
1 mg/kg-d based on ↓
birth weight in males
and females
1 mg/kg-d pup
body weight on day
of birth, and pup
death prior to PND
4 culling
1 mg/kg-d based on
clinical signs of ChEI,
body weight gain
decreases GD17-20
< 0.3 mg/kg-d
RBC ChEI GD20,;
0.3 brain ChEI
(sacrificed 2-4 h
after dosing GD20)
1 mg/kg-d at
GD20, (sacrificed
2-4 h after dosing)
Farag et al.
2003
Developmental
Gavage GD6-15
0, 5, 15, 25
Fischer 344 rats
N=24–28
15 mg/kg-d based on ↓
fetal weight at 25
mg/kg-d
15 mg/kg-d
5 mg/kg-d based on
clinical signs of ChEI
(tremors) and reduced
body weights
5 mg/kg-d based
on brain ChEI
(sacrificed GD 21,
6 d after last dose)
>25 mg/kg-d fetal
brain
(Continued)
�TABLE 5. Continued
Exposure route,
duration, and
dose levels
(mg/kg-d)
Species and
number of litters
(litters/dose
group)
Akhtar et al.
2006
Developmental
Gavage GD0-20
0, 9.6, 12, 15
Wistar rats
N=20
12 mg/kg-d based on
↓ fetal weight at 15
mg/kg-d
12 mg/kg-d
Lassiter et al.
2008a
Developmental
Gavage
GD7-PND21
0, 2.5
Long Evans rats
N=9–10
>2.5 mg/kg-d, based
on no effects on birth
weight and body
weights prior to
weaning (after PND
51 ↑body weight in
males only)
Deacon et al.
1980
Developmental
(initial study)
Gavage GD6-15
0,1, 10, 25
CF-1 Mouse
29–36
10 mg/kg-d based on
↓ fetal weight at 25
mg/kg-day
Deacon et al.
1980
Developmental
(repeat study at
lower doses)
Gavage GD 6-15
0, 0.1, 1, 10
Reference
Type of Study
NOEL fetal or pup
birth weight
308
NOEL maternal
RBC or brain
ChEI
NOEL pup RBC or
brain ChEI
9.6 mg/kg-d based
on reduced body
weight gain at 12
mg/kg-day and
clinical signs of ChEI
at 15 mg/kg-d
Not measured
Not measured
>2.5 mg/kg-d
>2.5 mg/kg-d
Not measured
Not measured
>25 mg/kg-d
1 mg/kg-d based on
clinical signs of ChEI
<1 mg/kg-d RBC
ChEI (sacrificed
5 h after last
dose)
1 mg/kg-d fetal
homogenate
(sacrificed 5 h after
last dose)
>10 mg/kg-d
>10 mg/kg-d
0.1 mg/kg-d RBC
ChEI (sacrificed 5
h after last dose)
1 mg/kg-d fetal
homogenate (based
on non-statistically
significant ChEI;
sacrificed 5 h after
last dose)
NOEL pup
mortality or dead
fetuses
NOEL maternal
toxicity
Fetal crown-rump
length NOEL=10
mg/kg-d
CF-1Mouse
23–30
>10 mg/kg-d based
on no effects on fetal
weight
Fetal crown-rump
length NOEL=10
mg/kg-d
Note: NOAEL, no-observed-adverse-effect level; NOEL, no-observed-effect level; GD, gestation day; PND, postnatal day; ChEI cholinesterase inhibition.
a This study did not meet our a priori inclusion criteria of n = 20. It was included because the primary focus of this study was body weight.
�BIRTH OUTCOMES
did not meet our inclusion criteria but looked
at birth and early postnatal weight (Lassiter
and Brimijoin 2008) is also summarized in
Table 5.
In the developmental toxicity study in
Fischer 344 (F344) rats reported by Breslin
et al. (1996), fetal weight was increased at all
doses above controls, with statistically significant increases of 5.6% and 4.2% at 3 and
15 mg/kg-d, respectively (Table 5). Breslin et al.
(1996) did not consider the increased fetal
body weight to be treatment related, because
there was no clear dose response and the
weight rise was within the range of historical
control data. There was a statistically nonsignificant elevation in fetal crown-rump length at
3 but not at 0.1 or 15 mg/kg-d, and it was
not considered to be treatment related. The
highest CPF dose level produced clear signs
of maternal toxicity, including tremors, vaginal
bleeding, excessive salivation, and decreased
body weights.
In the two-generation reproduction study
in Sprague-Dawley rats (Breslin et al. 1996), the
most relevant findings for birth outcomes were
those noted at birth. No developmental effects
were seen at birth except for reduced pup
weight at postnatal day (PND) 1 (day of birth;
not statistically significant). During lactation,
there were statistically significant decreased
pup weights at PND 4 and 21 and increased
pup mortality in F1 pups at 5 mg/kg-d on
PND 14 and 21.These changes were not seen
in F2 pups, although there was an increase
in pup mortality due to entire litter losses at
5 mg/kg-d that was not considered treatmentrelated (5 litter losses at 5 mg/kg-d vs. 3 in controls). Histologic alterations in the zona fasciculata of the adrenal gland in P1 and P2 males
and females were observed at the 5-mg/kg-d
dose level. These effects during lactation indicate that the 5-mg/kg-d dose level was maternally toxic. In addition, significant RBC AChE
inhibition was measured in P1 and P2 adults
at 1 (67–69% inhibition) and 5 (70–75%
inhibition) mg/kg-d. Brain AChE inhibition of
48% was measured in P1 and P2 adults at
5 mg/kg-d. At 0.1 mg/kg-d, AChE inhibition
measured in P2 males was considered spurious
309
because there was no marked effect in either
the P1 males or females or the P2 females.
Maurissen et al. (2000) reported significantly reduced pup body weights at birth
and 4 d later prior to culling in SpragueDawley rats exposed to 5 but not to 0.3 or
1 mg CPF/kg-d. There was increased mortality in pups (more than half cannibalized) in
the high-dose (5 mg/kg-d) group with a resultant decrease in live litter size before litter size
standardization on PND 4. In addition, delays
in vaginal opening, pinna detachment, and
preputial separation were noted at 5 mg/kg-d
only, although the latter two were not statistically significant. Clinical signs of toxicity, including muscle fascilitations and decreased body
weight gains, were noted in dams at 5 mg/kg-d.
At GD20, there was significant (90%) brain
AChE inhibition at 5 mg/kg-d, and substantial
RBC ChE inhibition at 5, 1, and 0.3 mg/kg-d.
Farag et al. (2003) observed effects of
CPF on fetal body weight in the F344 strain
of rats at 25 but not 5 and 15 mg/kg-d.
Signs of developmental toxicity consisting of
decreased fetal weight and viability as well
as increased fetal death and early resorption,
and increased fetal variations were also seen
at 25 mg/kg-d but not at 5 or 15 mg/kg-d.
Maternal toxicity in the form of depressed body
weight and AChE inhibition was observed at
15 and 25 mg/kg-d, with significant ChE inhibition (31% and 49%, respectively) measured
6 d after the last CPF dose (PND 21).
Akhtar et al. (2006b) reported decreased
fetal weight, increased fetal death, and “minor
insignificant” malformations in Wistar rats at
15 mg/kg-d but not at 9.6 and 12 mg/kg-d.
Clinical signs of AChE inhibition toxicity and
decreased food consumption were observed in
dams at 15 mg/kg-d. A significant decrease in
maternal body weight gain was measured at
12 and 15 mg/kg-d.
In CF-1 mice exposed to 1, 10, and
25 mg/kg-d during organogenesis, fetal weight
and crown–rump length were reduced only at
25 mg/kg-d (Deacon et al. 1980). In addition, there were significant reductions in skeletal ossification of the skull bones, delayed
ossification of the sternebrae, and unfused
�310
P. J. MINK ET AL.
sternebrae in the 25 mg/kg-d fetuses, all indicating delayed growth and bone development.
Maternal plasma and RBC AChE levels measured in a separate group of animals treated
on gestation days (GD) 6–10 or 6–15 were
significantly reduced at all dose levels when
measured 5 h after the last dose, as were levels
in a fetal homogenate from the 10- and 25mg/kg-d groups. Severe maternal toxicity was
seen at 25 mg/kg-d and included increased
maternal deaths, severe symptoms of AChE
inhibition, and reduced body weight gain.
In mice exposed to 0, 0.1, 1, or 10 mg/kg/d
on GD 6–15, no fetal toxicity was seen,
except for a significant reduction in the incidence of delayed skull bone ossification at
1 and 10 mg/kg-d and a significant reduction in delayed ossification of the sternebrae
at 10 mg/kg-d, suggesting that these animals
were somewhat advanced compared to controls. These changes occurred in the presence of numerically larger size (body weight
and crown–rump length) of fetuses in the two
higher dose groups (statistically non significant),
and are not considered toxicologically significant. Additional animals were treated at GD
6–10 or GD 6–15 and sacrificed 5 h after
final dosing for AChE levels. Maternal RBC
AChE and fetal homogenate AChE levels were
reduced at 1 and 10 mg/kg-d.
Lassiter et al. (2008) was a smaller study
(n = 9–10; Long-Evans rats) that did not meet
the inclusion criteria for animal studies but
was evaluated because the primary focus of
the study was on body weights. There was no
effect of CPF on neonatal body weight prior to
weaning in the one dose level (2.5 mg/kg-d)
tested.
Discussion of Animal Studies
In Terms of Biological Plausibility
for Epidemiologic Studies
The issue of biological plausibility for
epidemiologic studies includes the question of whether the findings are consistent
with comparable birth outcomes from animal studies (Table 5). In general, most chemicals will produce effects on fetal or pup
body weight in developmental or reproductive toxicity animal studies because regulatory guidelines for toxicology studies require
that the highest dose level produce some
level of toxicity. Treatment-related decreases
in fetal weight were generally seen at doses
of 15–25 mg/kg-d (no-observed-adverse-effect
level [NOAEL] = 10 mg/kg-d) in rats and mice
following gestational exposures (Akhtar et al.
2006a ; Breslin et al. 1996; Deacon et al. 1980;
Farag et al. 2003). Following exposures of the
dams throughout both gestation and lactation,
decreases in birth weight or pup weight prior to
weaning occurred more consistently at doses of
5 mg/kg-d (NOAEL = 1 mg/kg-d) (Breslin et al.
1996; Maurissen et al. 2000).
The developmental effects reported in offspring in these studies occur at doses that produce clear signs of maternal toxicity based on
clinical signs and/or AChE inhibition (Table 5).
Most of these effects are related to delayed
growth and development, particularly of the
skeleton, which is forming around the time
of examination. The growth delays in animal
studies are likely to be secondary to maternal toxicity, although potential direct effects on
the fetus cannot be ruled out. During gestation, the maternal mammal is the sole source
of nutrients, electrolytes, and oxygen, controls
homeostatic mechanisms, regulates fluids and
temperature, and provides means for the elimination of metabolic wastes (DeSesso 1987;
DeSesso et al. 2009). Environmental insults
that produce maternal toxicity (e.g., reductions
in body weight, clinical symptoms) can lead
to induction of an acute-phase response and
changes in maternal metabolism that result in
fetal or pup toxicity (DeSesso 1987; Keen et al.
2003a; 2003b).
Based on comparison with the NOAEL for
developmental toxicity, RBC AChE inhibition in
dams is a much more sensitive endpoint than
effects on fetal or pup birth weight or length.
The lowest dose at which RBC AChE inhibition
was reported was 0.3 mg/kg-d (Maurissen et al.
2000), and two studies reported no RBC AChE
inhibition at 0.1 mg/kg-d (Breslin et al. 1996;
Deacon et al. 1980). Thus, 0.1 mg/kg-d may be
regarded as a NOAEL for RBC AChE inhibition
�BIRTH OUTCOMES
in dams, based on animal studies included in
this review. These animal studies suggest that
risk assessments based on RBC AChE inhibition
in adults or offspring animals will be protective of effects on fetal weight, pup growth,
and other general developmental effects. This
is also true for specialized neurodevelopmental animal studies, the majority of which were
conducted at doses between 1 and 5 mg/kg-d,
which produce substantial RBC AChE inhibition in dams (Eaton et al. 2008; Mattsson et al.
2000; Maurissen et al. 2000; Li et al. 2012).
The Mt. Sinai cohort study evaluated the
potential interaction between biomarkers of
OP exposure and PON1 enzyme activity or
PON 1 genotype. The animal data suggest
that the overall balance between decreased
PON1 detoxification and CYP450 activation/
detoxification, as well as higher rates of ChE
enzyme synthesis in the preweanling rat (Moser
et al. 1998; Pope et al. 1991), contributes
to age-dependent and individual susceptibility
to CPF toxicity (Timchalk et al. 2006). These
experiments tend to be conducted under more
extreme conditions using knockout mice (with
PON1 status replacement) and higher acute
doses of CPF. The extent to which these differences are of importance to humans may be
dependent on exposure levels, with greater differences in susceptibility at higher acute than
at low exposure levels (Eaton et al. 2008). Cole
et al. (2005) reported that PBPK model simulations predict that PON1 Q192R polymorphism might exert the greatest impact on CPF
metabolism and detoxification at dose levels
greater than 0.5 mg/kg. At lower exposure levels, other esterase detoxification pathways are
predicted to be capable of compensating for
the interindividual differences in CPOase activity due to the PON1 Q192R polymorphism
(Cole et al. 2005). Together, these animal data
weaken the biological plausibility of interactions between CPF and PON1 activity on birth
outcomes in human studies at lower human
exposure levels.
Indeed, as discussed in greater detail earlier
in this article, the evidence for PON1 enzyme
activity or genotype modifying CPF effects on
birth outcomes in the Mt. Sinai cohort is weak.
311
Of the biomarkers measured, TCPy was the
most specific metabolite of CPF measured, and
there were no statistically significant interactions between PON1 and TCPy for any of the
birth outcomes. Even though there was a statistically significant trend in head circumference
across PON1 tertiles among participants with
TCPy greater than the LOD (but not among
those with TCPy below the LOD), the head circumference mean values for each PON1 tertile
were similar for the two TCPy groups (see
Table 4).
Estimates of exposure to pregnant women
in the epidemiologic papers that meet our
inclusion criteria were generally not expressed
in units that easily allow direct comparisons
with the animal data. Zhao et al. (2005) compared internal dose concentrations of CPF
reported in human and animal studies and
concluded that the Whyatt et al. (2004) estimate of 2.5 pg/g in human umbilical cord
blood (before January 1, 2001) is approximately 1/400 the 1-ng/g CPF level found
in the blood from rat fetuses exposed at
1 mg/kg-d (animal NOAEL for fetal RBC AChE
inhibition) (Mattsson et al. 2000). Zhao et al.
(2005) suggested that based on this large difference in internal exposure levels, there is
low biological plausibility that participants in
the CCCEH study were exposed to CPF at
levels that produced AChE inhibition or inhibited fetal growth. Such comparisons of animal
and human exposure data are limited by differences in anatomy and physiology, including
differences in respiratory, heart and metabolic
rates, as well as potential differences in target
tissue distribution and metabolic capacity.
Eaton et al. (2008) did a comprehensive
review of the literature on human and animal
toxicity and exposure data and estimated average daily combined CPF inhalation and dietary
exposures in the CCCEH and CHAMACOS
cohorts to be 0.008 and 0.007 µg/kg-d,
respectively. McKone et al. (2007) estimated
total CPF exposures (dietary, inhalation, dermal, nondietary ingestion) among CHAMACOS
pregnant women to be 1.43 to 6.73 nmol/d,
which is equivalent to 0.007 to 0.031µg/kg-d
assuming a 75.8-kg pregnant female (U.S. EPA
�312
P. J. MINK ET AL.
2011a, from NHANES). Using a physiologically
based pharmacokinetic (PBPK) model, Lowe
et al. (2009) estimated that daily doses of
0.15 µg/kg-d would result in maternal and
fetal blood CPF levels within the range of the
mean maternal and cord blood concentrations
reported by Whyatt et al. (2005) in the CCCEH
study. Despite possible differences in physiology and metabolism, these levels in humans
are several orders of magnitude below the 0.1mg/kg-d NOAEL for laboratory animals based
on RBC AChE inhibition in the developmental and reproduction studies included in this
review and would not be expected to affect
growth and development in humans.
SUMMARY CONCLUSIONS AND
IMPLICATIONS FOR RISK ASSESSMENT
This review presents a comprehensive analysis that compares and contrasts results across
human and animal studies which evaluated the
hypothesis that CPF adversely affects birth outcomes related to fetal growth. Using guidance
recommended by Hill (1965), an assessment
was made of the evidence for and against
a causal relation between possible prenatal
CPF, as measured in umbilical cord plasma
or serum or estimated based on levels of urinary metabolites, and these growth outcomes.
Alternative explanations for the findings were
considered, such as the presence of bias in
the implementation of the study or during the
analysis.
This review of the epidemiologic literature
did not identify any strong associations exhibiting an exposure-response pattern that were
observed in more than one of the four cohort
studies evaluated. The adverse associations that
were reported were neither particularly strong
nor precise. This can be seen by general patterns of similar mean values of the birth outcome measures at different exposure levels,
beta coefficients that are close to the null value
of zero, and the relatively high standard errors
in some of the results.
The CCCEH study is the only study
that measured the parent compound CPF
levels prior to cancelation of residential CPF
use. Despite consistent statistically significant
inverse associations between CPF in cord
plasma and weight and length at birth in the
CCCEH study, no marked associations were
reported between CPF in air samples taken
from participants in the CCCEH study during
the third trimester of pregnancy and any of
the birth outcomes. In addition, the statistically
significant associations with CPF reported in
the CCCEH studies were not corroborated by
the Mt. Sinai study (TCPy, DEPs), even though
there was evidence of higher residential applications of CPF among these two New York
study populations.
Specifically, there were no statistically significant associations between birth length or
birth weight and CPF, TCPy, or DEPs in the
New Jersey, Mt. Sinai, or CHAMACOS studies. As noted previously, a majority of the
cord serum CPF values was very near the
limit of detection in the New Jersey Study
cohort (Barr et al. 2010). No material or statistically significant associations were observed
between CPF in cord blood and head circumference in the CCCEH or New Jersey
cohort studies. The Mt. Sinai and CHAMACOS
studies observed statistically significant associations between head circumference and DAPs,
but not with DEPs or TCPy. However, these
associations were in opposite directions. The
Mt. Sinai study reported statistically significant
trends and other group differences between
PON1 activity or PON192 genotype and DEPs,
DAPs, or TCPy on birth outcomes. As discussed
earlier in detail, these results are inconsistent
preliminary results.
Considered together, the data from the four
epidemiologic cohort studies do not support a
causal association between CPF exposures during pregnancy and measures of fetal growth.
At present, there is insufficient scientific evidence to support the use the epidemiologic
data on birth outcomes to derive a point of
departure or require additional uncertainty factors for risk assessment purposes.
Challenges to future epidemiologic
research on CPF exposure and fetal growth
outcome measures include limited exposure
�BIRTH OUTCOMES
among most individuals, difficulties in
estimating exposure during critical periods of
development, and consistency in biomarkers
measured across multiple studies to allow
comparisons. Although measuring the parent
compound in umbilical cord blood has many
clear advantages, it may be less feasible than
collecting urine samples in many populations.
Furthermore, it represents only one point in
time. Collection of maternal blood at additional, earlier times in pregnancy would greatly
enhance the information about exposure
during pregnancy in future studies. Additional
analyses from the existing cohorts including
repeated measures of growth outcomes and
patterns (e.g., height, weight, BMI), correlations among all available exposure measures
(self-report, biomarker, air monitoring data),
and correlations among fetal growth outcomes
and neurobehavioral outcomes in infancy and
early childhood may also be informative.
There is strong evidence from robust
animal studies in the published literature that
313
effects on fetal and birth weight occur at doses
that are several orders of magnitude higher
than those estimated in the human studies,
and only at levels that produce substantial
maternal RBC AChE inhibition and other signs
of maternal toxicity, including reduced body
weight or weight gain, or death in the most
severe cases. The lowest dose level producing treatment-related decreases in fetal or birth
weight is 5 mg/kg-d based on statistically nonsignificant decreases in body weight on the
day of birth (Maurissen et al. 2000). In this
study, there was substantial (>40%) maternal
RBC AChE inhibition at 0.3 mg/kg-d, the lowest dose level tested (Figure 2). Indeed, using
a response level of 10% RBC AChE inhibition compared to background, the U.S. EPA
estimated the lower confidence bound on the
benchmark dose (BMDL10 ) to be 0.03 mg/kg-d
in rat dams following GD6-20 exposures (U.S.
EPA 2011b). Thus, based on consideration of
both the epidemiologic and animal data, RBC
AChE inhibition is a more sensitive endpoint
FIGURE 2. Comparison of NOAELs and LOAELs for fetal weight, birth weight, and maternal toxicity from animal studies with human
exposure estimates. Human exposure estimates were calculated from McCone et al. (2007) based on CHAMACOS study. McKone et al.
(2007) estimated total CPF exposures (dietary, inhalation, dermal, nondietary ingestion) among pregnant women in the CHAMACOS
cohort to be 1.43 to 6.73 nmol/d, which is equivalent to 0.007 to 0.031µg/kg-d, assuming a 75.8-kg pregnant female (U.S. EPA 2011a,
from NHANES). Lowe et al. (2009) estimated exposures based on umbilical cord blood levels from the CCCEH cohort (Whyatt et al.
2005). The NOAEL of 1 mg/kg-d for pup birth weight is based on non-statistically significant treatment-related decreases at 5 mg/kg-d
Breslin et al. (2006) and Maurissen et al. (2000) (see Table 5). The LOAEL of 5 mg/kg-d for maternal toxicity (e.g., tremors) and pup death
is based on Maurissen et al. (2000). The NOAEL of 12 mg/kg-d for fetal birth weight is the highest NOAEL for effects in multiple studies
as summarized in Table 5.
�314
P. J. MINK ET AL.
for risk assessment than somatic developmental
effects reviewed in this article.
REFERENCES
Akhtar, N., M. K. Srivastava, and R. B.
Raizada. 2006b. Transplacental disposition
and teratogenic effects of chlorpyrifos in rats.
J. Toxicol. Sci. 31: 521–27.
Barr, D. B., R. Allen, A. O. Olsson, R.
Bravo, L. M. Caltabiano, A. Montesano,
J. Nguyen, S. Udunka, D. Walden, R. D.
Walker, G. Weerasekera, R. D. Whitehead,
Jr., S. E. Schober, and L. L. Needham. 2005.
Concentrations of selective metabolites of
organophosphorus pesticides in the United
States population. Environ. Res. 99: 314–26.
Barr, D. B., C. V. Ananth, X. Yan, S. Lashley,
J. C. Smulian, T. A. Ledoux, P. Hore, and
M. G. Robson. 2010. Pesticide concentrations in maternal and umbilical cord sera and
their relation to birth outcomes in a population of pregnant women and newborns in
New Jersey. Sci. Total Environ. 408: 790–95.
Barr, D. B., and J. Angerer. 2006. Potential uses
of biomonitoring data: A case study using the
organophosphorus pesticides chlorpyrifos
and malathion. Environ. Health Perspect.
114: 1763–69.
Berkowitz, G. S., J. G. Wetmur, E. BirmanDeych, J. Obel, R. H. Lapinski, J. H.
Godbold, I. R. Holzman, and M. S. Wolff.
2004. In utero pesticide exposure, maternal paraoxonase activity, and head circumference. Environ. Health Perspect. 112:
388–91.
Bravo, R., L. M. Caltabiano, G. Weerasekera,
R. D. Whitehead, C. Fernandez, L. L.
Needham, A. Bradman, and D. B. Barr.
2004. Measurement of dialkyl phosphate
metabolites of organophosphorus pesticides
in human urine using lyophilization with gas
chromatography-tandem mass spectrometry
and isotope dilution quantification. J. Expos.
Anal. Environ. Epidemiol. 14: 249–59.
Breslin, W. J., A. B. Liberacki, D. A. Dittenber,
and J. F. Quast. 1996. Evaluation of the
developmental and reproductive toxicity
of chlorpyrifos in the rat. Fundam. Appl.
Toxicol. 29: 119–30.
Clegg, D. J., and M. van Gemert. 1999a.
Determination of the reference dose for
chlorpyrifos: Proceedings of an expert panel.
J. Toxicol. Environ. Health B Crit. Rev. 2:
211–55.
Clegg, D. J., and M. van Gemert. 1999b.
Expert panel report of human studies on
chlorpyrifos and/or other organophosphate
exposures. J. Toxicol. Environ. Health B Crit.
Rev. 2: 257–79.
Cole, T. B., B. J. Walter, D. M. Shih, A. D.
Tward, A. J. Lusis, C. Timchalk, R. J. Richter,
L. G. Costa, and C. E. Furlong. 2005. Toxicity
of chlorpyrifos and chlorpyrifos oxon in
a transgenic mouse model of the human
paraoxonase (PON1) Q192R polymorphism.
Pharmacogenet. Genom. 15: 589–98.
Deacon, M. M., J. S. Murray, M. K. Pilny, K. S.
Rao, D. A. Dittenber, T. R. Hanley, Jr., and
J. A. John. 1980. Embryotoxicity and fetotoxicity of orally administered chlorpyrifos
in mice. Toxicol. Appl. Pharmacol. 54:
31–40.
Eaton, D. L., R. B. Daroff, H. Autrup, J.
Bridges, P. Buffler, L. G. Costa, J. Coyle,
G. McKhann, W. C. Mobley, L. Nadel, D.
Neubert, R. Schulte-Hermann, and P. S.
Spencer. 2008. Review of the toxicology of
chlorpyrifos with an emphasis on human
exposure and neurodevelopment. Crit. Rev.
Toxicol. 38(suppl. 2): 1–125.
Eskenazi, B., K. Harley, A. Bradman, E.
Weltzien, N. P. Jewell, D. B. Barr, C.
E. Furlong, and N. T. Holland. 2004.
Association of in utero organophosphate
pesticide exposure and fetal growth and
length of gestation in an agricultural
population. Environ. Health Perspect.
112:1116–24.
Eskenazi, B., A. R. Marks, A. Bradman, K.
Harley, D. B. Barr, C. Johnson, N. Morga,
and N. P. Jewell. 2007. Organophosphate
pesticide exposure and neurodevelopment
in young Mexican-American children.
Environ. Health Perspect. 115: 792.
Farag, A. T., A. M. El Okazy, and A. F. ElAswed. 2003. Developmental toxicity study
�BIRTH OUTCOMES
of chlorpyrifos in rats. Reprod. Toxicol. 17:
203–08.
Hill, A. B. 1965. The Environment and Disease:
Association or Causation? Proc. R. Soc. Med.
58: 295–300.
Lassiter, T. L. and S. Brimijoin. 2008. Rats gain
excess weight after developmental exposure to the organophosphorothionate pesticide, chlorpyrifos. Neurotoxicol. Teratology
30: 125–30.
Li, A. A., K. A. Lowe, L. J. McInstosh, P. J. Mink.
2012. Evaluation of epidemiology and animal data for risk assessment: Chlorpyrifos
developmental neurobehavioral outcomes.
J. Toxicol. Environ. Health B Crit. Rev. 15:
109–184.
Liu, J., and C. N. Pope. 1998. Comparative
presynaptic neurochemical changes in rat
striatum following exposure to chlorpyrifos
or parathion. J. Toxicol. Environ. Health A 53:
531–44.
Lowe, E. R., T. S. Poet, D. L. Rick, M. S.
Marty, J. L. Mattsson, C. Timchalk, and M. J.
Bartels. 2009. The effect of plasma lipids
on the pharmacokinetics of chlorpyrifos
and the impact on interpretation of blood
biomonitoring data. Toxicol. Sci 108:
258–72.
Mattsson, J. L., J. P. Maurissen, R. J. Nolan, and
K. A. Brzak. 2000. Lack of differential sensitivity to cholinesterase inhibition in fetuses
and neonates compared to dams treated
perinatally with chlorpyrifos. Toxicol Sci 53:
438–46.
Maurissen, J. P., A. M. Hoberman, R. H.
Garman, and T. R. Hanley, Jr. 2000. Lack
of selective developmental neurotoxicity in
rat pups from dams treated by gavage with
chlorpyrifos. Toxicol. Sci. 57: 250–63.
McKone, T.E., R. Castorina, M.E. Harnly, Y.
Kuwabara, B. Eskenazi, A. Bradman. 2007.
Merging models and biomonitoring data to
characterize sources and pathways of human
exposure to organophosphorus pesticides in
the Salinas Valley of California. Environ. Sci.
Technol. 41: 3233–40.
Moser, V. C., S. M. Chanda, S. R. Mortensen,
and S. Padilla. 1998. Age- and genderrelated differences in sensitivity to
315
chlorpyrifos in the rat reflect developmental
profiles of esterase activities. Toxicol. Sci. 46:
211–22.
Needham, L. L. 2005. Assessing exposure to
organophosphorus pesticides by biomonitoring in epidemiologic studies of birth
outcomes. Environ. Health Perspect. 113:
494–98.
Perera, F. P., V. Rauh, W. Y. Tsai, P. Kinney, D.
Camann, D. Barr, T. Bernert, R. Garfinkel,
Y. H. Tu, D. Diaz, J. Dietrich, and R.
M. Whyatt. 2003. Effects of transplacental
exposure to environmental pollutants on
birth outcomes in a multiethnic population.
Environ. Health Perspect. 111: 201–5.
Pope, C. N. 1999. Organophosphorus pesticides: Do they all have the same mechanism
of toxicity? J. Toxicol. Environ. Health B Crit.
Rev. 2: 161–81.
Pope, C. N., T. K. Chakraborti, M. L.
Chapman, J. D. Farrar, and D. Arthun.
1991. Comparison of in vivo cholinesterase
inhibition in neonatal and adult rats by
three organophosphorothioate insecticides.
Toxicology 68: 51–61.
Rauh, V. A., R. Garfinkel, F. P. Perera, H. F.
Andrews, L. Hoepner, D. B. Barr, R.
Whitehead, D. Tang, and R. W. Whyatt.
2006. Impact of prenatal chlorpyrifos exposure on neurodevelopment in the first
3 years of life among inner-city children.
Pediatrics 118: e1845–59.
Slotkin, T. A., and F. J. Seidler. 2007. Prenatal
chlorpyrifos exposure elicits presynaptic
serotonergic and dopaminergic hyperactivity
at adolescence: Critical periods for regional
and sex-selective effects. Reprod. Toxicol.
23: 421–27.
Timchalk, C., T. S. Poet, and A. A. Kousba.
2006. Age-dependent pharmacokinetic and
pharmacodynamic response in preweanling rats following oral exposure to the
organophosphorus insecticide chlorpyrifos.
Toxicology 220: 13–25.
Udarbe Zamora, E. M., J. Liu, and C. N.
Pope. 2008. Effects of chlorpyrifos oxon on
M2 muscarinic receptor internalization in
different cell types. J. Toxicol. Environ. Health
A 71: 1440–47.
�316
U.S. Environmental Protection Agency. 1991.
Guidelines for developmental toxicity risk
assessment. Fed. Reg. 56: 63798-63826.
U.S. Environmental Protection Agency.
2002. Interim reregistration eligibility
decision: Chlorpyrifos. Washington, DC:
U.S. Environmental Protection Agency,
Office of Prevention, Pesticides and Toxic
Substances.
U.S. Environmental Protection Agency. 2006.
Internal memorandum from D. Edwards
to J. Jones, Director, Office of Pesticide
Programs, regarding finalization of interim
reregistration eligibility decisions (IREDs)
and Interim tolerance reassessment and
risk management decisions (TREDs) for
the organophosphate pesticides, and
completion of the tolerance reassessment
and reregistration eligibility process for
the organophosphate pesticides. July 31,
2006. Washington, DC: U.S. Environmental
Protection Agency, Office of Prevention,
Pesticides and Toxic Substances.
U.S. Environmental Protection Agency. 2011a.
Chlorpyrifos: Preliminary human health
risk assessment for registration. U.S.
Environmental Protection Agency, Office of
Chemical Safety and Pollution Prevention.
Available from: http://www.regulations.gov/
#!documentDetail;D=EPA-HQ-OPP-20080850-0025 (accessed August 9, 2011).
U.S. Environmental Protection Agency.
2011b. Exposure factors handbook. U.S.
Environmental Protection Agency Office of
Research and Development National Center
for Environmental Assessment. Available
at: http://www.epa.gov/ncea/efh/pdfs/efhchapter08.pdf
Weselak, M., T. E. Arbuckle, and W. Foster.
2007. Pesticide exposures and developmental outcomes: the epidemiological evidence.
J. Toxicol. Environ. Health B Crit. Rev. 10:
41–80.
Whyatt, R. M., D. Camann, F. P. Perera, V. A.
Rauh, D. Tang, P. L. Kinney, R. Garfinkel, H.
P. J. MINK ET AL.
Andrews, L. Hoepner, and D. B. Barr. 2005.
Biomarkers in assessing residential insecticide exposures during pregnancy and effects
on fetal growth. Toxicol. Appl. Pharmacol.
206: 246–54.
Whyatt, R. M., R. Garfinkel, L. A. Hoepner,
H. Andrews, D. Holmes, M. K. Williams, A.
Reyes, D. Diaz, F. P. Perera, D. E. Camann,
and D. B. Barr. 2009. A biomarker validation study of prenatal chlorpyrifos exposure within an inner-city cohort during
pregnancy. Environ. Health Perspect. 117:
559–67.
Whyatt R. M., R. Garfinkel, L. A. Hoepner,
D. Holmes, M. Borjas, M. K. Williams, A.
Reyes, V. Rauh, F. P. Perera and D. E.
Camann. 2007. Within- and between-home
variability in indoor-air insecticide levels during pregnancy among an inner-city cohort
from New York City. Environ Health Perspect.
115(3):383–9. Epub December 11, 2006.
PubMed PMID: 17431487; PubMed Central
PMCID: PMC1849946.
Whyatt, R. M., V. Rauh, D. B. Barr, D. E.
Camann, H. F. Andrews, R. Garfinkel, L. A.
Hoepner, D. Diaz, J. Dietrich, A. Reyes,
D. Tang, P. L. Kinney, and F. P. Perera.
2004. Prenatal insecticide exposures and
birth weight and length among an urban
minority cohort. Environ. Health Perspect.
112: 1125–32.
Wolff, M. S., S. Engel, G. Berkowitz, S.
Teitelbaum, J. Siskind, D. B. Barr, and J.
Wetmur. 2007. Prenatal pesticide and PCB
exposures and birth outcomes. Pediatr. Res.
61: 243–50.
Zhao, Q., M. Dourson, and B. Gadagbui.
2006. A review of the reference dose for
chlorpyrifos. Regul. Toxicol. Pharmacol. 44:
111–24.
Zhao, Q., B. Gadagbui, and M. Dourson. 2005.
Lower birth weight as a critical effect of
chlorpyrifos: A comparison of human and
animal data. Regul. Toxicol. Pharmacol. 42:
55–63.
�
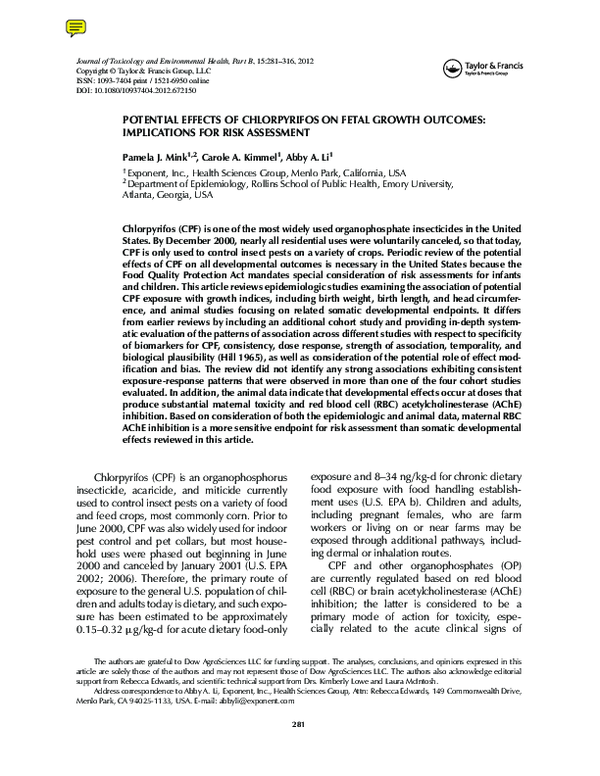
 Carole Kimmel