Shear Localization in Dynamic Deformation: Microstructural
Evolution
YONGBO XU, JINGHUA ZHANG, YILONG BAI, and MARC ANDRÉ MEYERS
Investigations made by the authors and collaborators into the microstructural aspects of adiabatic shear localization are critically reviewed. The materials analyzed are low-carbon steels,
304 stainless steel, monocrystalline Fe-Ni-Cr, Ti and its alloys, Al-Li alloys, Zircaloy, copper,
and Al/SiCp composites. The principal findings are the following: (a) there is a strain-ratedependent critical strain for the development of shear bands; (b) deformed bands and whiteetching bands correspond to different stages of deformation; (c) different slip activities occur in
different stages of band development; (d) grain refinement and amorphization occur in shear
bands; (e) loss of stress-carrying capability is more closely associated with microdefects rather
than with localization of strain; (f) both crystalline rotation and slip play important roles; and
(g) band development and band structures are material dependent. Additionally, avenues for
new research directions are suggested.
DOI: 10.1007/s11661-007-9431-z
� The Minerals, Metals & Materials Society and ASM International 2008
I.
INTRODUCTION
LOCALIZED shear deformation in the form of
intensive deformation in a narrow band generated
during dynamic deformation under high strain rates
has been a topic of great interest for decades and, thus, a
great deal of investigation has been conducted experimentally and theoretically since Zener and HollomonÕs
classic article of 1944.[1] It is interesting to note that
Tresca[2] had already observed this phenomenon in the
nineteenth century. Localized shear is an important
mode of deformation; it leads to catastrophic failure
with low ductility and it occurs frequently during highstrain-rate deformation, such as is found in ballistic
impact, explosive fragmentation, high-speed shaping
and forming, dynamic compaction and welding,
machining, and grinding. This deformation mode may
also occur during quasi-static loading, such as uniaxial
extension and cyclic fatigue. The failure of metallic
glasses and, in particular, bulk metallic glasses is a
classic example of shear localization, and it has been
shown by Lewandowski and Greer[3] that temperature
plays a role: significant temperature rises were meaYONGBO XU and JINGHUA ZHANG, Professors, are with the
Shenyang National Laboratory of Materials Sciences, Institute of
Metal Research, Chinese Academy of Sciences, Shenyang 110016,
P.R. China. Contact e-mail: ybxu@imr.ac.cn YILONG BAI,
Professor, is with the State Key Laboratory for Non-Linear
Mechanics of Continuous Media, Institute of Mechanics, Chinese
Academy of Sciences, Beijing, P.R. China. MARC ANDRE¢
MEYERS, Professor, is with the Materials Science and Engineering
Program and Department of Mechanical and Aerospace Engineering,
University of California at San Diego, La Jolla, CA 92093-0411.
This article is based on a presentation made in the symposium
entitled ‘‘Dynamic Behavior of Materials,’’ which occurred during the
TMS Annual Meeting and Exhibition, February 25–March 1, 2007 in
Orlando, Florida, under the auspices of The Minerals, Metals and
Materials Society, TMS Structural Materials Division, and TMS/
ASM Mechanical Behavior of Materials Committee.
Article published onlined February 13, 2008
METALLURGICAL AND MATERIALS TRANSACTIONS A
sured. Similarly, nanocrystalline metals are prone to
shear localization when deformed at low strain rates
and, although the imposed displacement velocities are
small, the evolution of shear bands is dynamic and leads
to early failure by virtue of a near absence of work
hardening (e.g., Jia et al.[4] and Wei et al.[5]). The
phenomenon is clearly recognizable in most steels and
in other metals, including aluminum alloys, copper,
titanium, zirconium, and uranium and their alloys;
aluminum composites reinforced with SiC particles and
whiskers; and engineering plastics.
Mechanical engineers have focused their efforts on the
macrodescription of the constitutive model, developing
the criteria required for the plastic deformation instability (Recht in 1964,[6] Culver in 1973,[7] Clifton in
1980,[8] Bai in 1981,[9] Burns and Trucano in 1982,[10]
Pan in 1983,[11] Semiatin et al. in 1984,[12] Wu and
Freund in 1984,[13] Wright and Batra in 1985,[14]
Fressengeas and Molinari in 1987,[15] Johnson in
1981,[16] Drew and Flaherty in 1984,[17] Lemonds and
Needleman in 1986,[18] Tvergaard in 1987,[19] and
Anderson et al. in 1990[20]). Most of the approaches
consist of a combination of mechanical and thermal
instability analysis. On the other hand, materials scientists have focused on the material and structural aspects
of localized shear deformation, emphasizing the effect of
the microstructures on the formation of the shear bands.
Regarding the microstructural aspects of shear localization, there are a number of reviews: Rogers,[21,22] Stelly
and Dormeval,[23] Timothy,[24] Murr,[25] Dormeval,[26]
and Meyers.[27,28] Among the numerous articles
on the topic, the articles indicated in Table I are
noteworthy.
In this article, we will review results of the microstructural aspects of the adiabatic shear localization
generated under an imposed strain rate range of 103 to
104 s-1 at ambient temperature, resulting from research
carried out by the authors over the past 20 years.
VOLUME 39A, APRIL 2008—811
�Table I.
Ti and
alloys
Principal Research Articles on Adiabatic Shear
Bands
Grebe et al.[29]
Marchand and Duffy[31]
Me-Bar and
Shechtman[33]
Meyers et al.[35,36]
Stelly et al.[30]
Shockey et al.[32]
Timothy and
Hutchings[34]
da Silva and
Ramesh[37]
Xue et al.[39]
Bai et al.[41,42]
Xu et al.[44]
Glenn and Leslie[46]
Wingrove[48]
Woodward and
Aghan[50]
Stelly et al.[52]
Giovanola[54]
Liao and Duffy[56]
Meunier et al.[58]
Lins et al.[180]
Meyers et al.[63]
Lee et al.[65]
Xue and Gray[66]
——
Chen and Vecchio[70]
Chichili et al.[38]
Hartley et al.[40]
Chen et al.[43]
Manion and Stock[45]
Thornton and Heiser[47]
Manion and
Wingrove[49]
Derep[51]
Wright and Batra[53]
Cho et al.[55]
Beatty et al.[57]
Wittman et al.[59,60]
Stainless
Xue et al.[61,62]
steels
Batra and Zhang[64]
Cerreta et al.[67]
Zirconium Kad et al.[68]
Aluminum Bai et al.[69]
alloys
Uranium, Magness[71]
Subhash et al.[72]
hafnium
Tantalum Chen et al.[43]
Vecchio et al.[74]
Nemat Nasser et al.[75] Hynes and Vecchio[193]
Steels
The emphasis is placed on the conditions of band
formation, microstructural characterization, and microstructural evolution.
II.
EXPERIMENTAL METHODS
A. Dynamic Tests
The localized shear bands were generated by three
methods, as shown in Figure 1.
(a) The thin-walled tube with integral circular flanges
matching the torsional impedance of the aluminum
bar for dynamic torsional and impact tests, which
were performed by split Hopkinson torsion bar
(SHTB) (Figure 1(a)).
(b) The hat-shaped specimen method (Figure 1(b)),
which was developed by Meyers and Manwaring[76] and has been successfully used to generate a
shear localization region in a number of metals, of
Ti,[36] steels,[57] Al alloys,[77] Ta,[43] Zircaloy,[68] and
stainless steel.[61,62,66,67] It should be noted that this
is a ‘‘forced’’ shear localization process, in contrast
to other experimental techniques, which allow the
bands to form naturally. Detailed finite element
method (FEM) computations have been carried
out on this geometry by Los Alamos National
Laboratory (LANL) researchers.[78,79]
(c) The explosive collapse of a thick-walled cylinder
(TWC) under controlled and prescribed conditions
(Figure 1(c)), which was developed by Nesterenko
and Bondar[80] and applied to Ti,[81] stainless
812—VOLUME 39A, APRIL 2008
steel,[62] and tantalum.[43] Detailed calculations are
reported by Xue et al.[82]
B. SHTB Modification
There is a difficulty associated with application of the
usual SHTB for the study of the microstructure evolution process during shear localization, because of the
transient nature of the process and the localizing field.
Therefore, Xue et al.[83] modified the usual SHTB by
attaching an unloading bar and an inside-pushed
connector. This modification eliminates the effect of
loading reverberation on postmortem observations,
making the combined measurements of the mechanical
parameters (stress and strain) and the relevant transient
microstructural observation possible.
C. Microstructural Characterization
The small width of the bands (on the order of 1 to
500 lm) renders microscopic examination difficult. In
particular, it is very hard to prepare the thin-foil
specimens for transmission electron microscopy (TEM)
examination, because the perforation produced using
ordinary methods such as double-jet polishing and ion
milling generally does not coincide with the shear-band
area. Two preparation methods are noteworthy.
(a) The ‘‘cross section and butt’’ method, used to make
the thin foils for TEM observations in some
cases.[84] The specimens are mechanically ground
and dimpled to a thickness of less than 20 lm.
Finally, the ion-beam milling is carried out with
Ar+ bombardment at 4 KV and a grazing incidence
angle of 10 deg.
(b) Electropolishing followed by ion milling: The
method described by Wittman et al.[60] and Kad
et al.[68] was also used, in which the perforation
produced by electropolishing is gradually enlarged
until it intersects the band. Figure 2(a) shows the
perforation before and after it intersects the shear
band. In this manner, one can, after viewing the
band and hole by optical microscopy, ensure that
TEM is focused on the appropriate region.
Figure 2(b) shows a Zircaloy specimen with the
perforation intersecting a band.
There are more modern sample preparation techniques, such as focused ion beam, that it is hoped will
shed some additional light on the band structure. The
microstructure and its evolution process were characterized by scanning electron microscopy (SEM), confocal laser scanning microscopy (CFLSM), field emission
scanning electron microscopy (FESEM), TEM, and
high-resolution electron microscopy (HREM).
III.
RESULTS AND DISCUSSION
A. Evolution Process of the Shear Band
The processes of formation and evolution of the
shear bands have stimulated a considerable number of
METALLURGICAL AND MATERIALS TRANSACTIONS A
�Fig. 1—Experimental methods used to generate the shear bands: (a) thin-walled-tube specimen for torsion loading, (b) hat-shaped specimen for
forced shear localization, and (c) TWC technique using explosive collapse.
Fig. 2—(a) Sequential electropolishing ion-milling technique and (b) shear band in Zircaloy at edge of perforation (courtesy of B. Kad).
METALLURGICAL AND MATERIALS TRANSACTIONS A
VOLUME 39A, APRIL 2008—813
�theoretical and experimental investigations. Among the
analytical approaches, the following are noteworthy:
(a) criteria proposed by Zener and Hollomon,[1]
Recht,[6] and Culver,[7] based exclusively on the
effects of work hardening, thermal softening, and
strain rate sensitivity;
(b) perturbation analyses of Molinari and Clifton,[85]
Clifton,[8] Bai,[9] and Grady and Kipp,[86] which
represent a significant advance over the simpler
first-generation analyses;
(c) finite element formulation in various forms (e.g.,
Kuriyama and Meyers[87]); and
(d) spacing of shear bands, which was theoretically
treated by Grady and Kipp,[86] Ockendon and
Wright,[88] and Molinari.[89]
Additional noteworthy studies are the ones by Clifton
et al. in 1984,[90] Bai et al. in 1986,[91] Wright and Batra
in 1987,[92] Shawki and Clifton in 1989,[93] Xing et al. in
1991,[94] and Liao and Duffy in 1998.[95] A number of
scaling laws have been obtained (Backman et al. in
1986,[96] Bai in 1989,[97] Dodd and Bai in 1987,[98] and
Anand et al. in 1990[99]). However, the analysis of
localized plastic shear deformation is still currently
limited by a lack of critical comparisons of theory and
experiment. Some experimental attempts to measure
the process of shear localization have been made. Costin
et al. in 1979[100] are known to be the first to measure the
temperature history of shear localization; later Hartley
et al. in 1987[101] and Marchand and Duffy in 1988[102]
have improved their infrared technique and measured
the temperature distribution and history. They assumed
that the localized shear process was divided into three
consecutive stages. In the first stage, the grid lines
incline but remain straight, implying that the deformation is homogeneous. In the second stage, the grid lines
become slightly curved, indicating inhomogeneous
deformation. In the third and final stage, the grid lines
appear discontinuous, indicating shear-band formation.
Marchand and Duffy[102] and Giovanola in 1988[103]
have independently observed the transient deformation
field of the localized shear process by means of highspeed photography and a grid pattern. More recently,
Guduru et al.[141] obtained detailed in-situ temperature
profiles at the shear-band tips in a C 300 maraging steel.
They focused on the tip of the band with a twodimensional infrared radiation (IR) array with an
acquisition rate of 106 frames per second. Each detector
was 100 · 100 lm. They observed that the front
contained ‘‘hot spots’’ with a spacing of ~0.25 to
1 mm, which they attributed to vorticity. They report
local temperature rises of up to 600 K. Some vortex-like
features are shown later (Figure 12).
All these works certainly have blazed a trail in the
experimental study of the localized shear process, but
they have not revealed the evolution process of the
microstructure occurring during shearing and have not
clarified the relationship of the mechanical parameters
with the corresponding microstructures in the bands.
The main reason for this is that the original SHTB could
not be used to study the microstructure evolution
occurring during shear localization. Xue et al.[83]
814—VOLUME 39A, APRIL 2008
Fig. 3—Stress-strain response of Ti-6Al-4V alloys subjected to
dynamic torsional loading and the corresponding patterns of the
inside scribe lines.
modified the original SHTB by a series of interrupted
tests, which enabled them to combine ingeniously the
measurements of the mechanical parameters (stress and
strain) at successive points on the stress-strain curve
with correlated microstructure observation, and to
follow the formation and evolution processes of the
shear band. Figure 3 shows four interrupted tests on the
four stress-strain curves with four prescribed loading
durations, labeled T9-38, T9-39, T9-37, and T9-21, for
Ti-6Al-4V alloys subjected to dynamic torsional loading
at average strain rates of about 3.1 · 103 s-1.[42] There is
a node in the stress-strain curve at which the average
critical strain is about 0.166. The T9-38 at point 1 is
loaded for 450 ls, close to the critical time, showing a
maximum strain of 0.160, and it represents the state near
the critical point. Within the curve, there are no kinks,
implying that the specimen is still in homogeneous
deformation, and no microstructure change is observed
during this regime of homogeneity. Beyond this point,
the stress drops slowly. The T9-39 at point 2, loaded
for about 550 ls, attained a nominal strain of 0.196
before unloading. Local maxima and minima in the
stress-strain curve for this sample is suggestive of
inhomogeneous deformation. Metallographic observation displays the distinct occurrence of shear localization; the width of the local shear zone is about 44 lm
and the maximum shear strain is 1.07, five times the
average value. A tiny elliptical void can be seen within
the shear zone. Of even more interest is that the width of
the local shear zone is much narrower than the size of
the grain, but its extension covers several grains. Loaded
for 650 ls, the T9-37 at point 3 gained a nominal strain
of 0.219. Severe localized shear band appeared. Figure 4
exhibits a drastic change in the microstructure in the
localized shear zone. Obviously, microvoids have grown
and some of them coalesced into a large crack, as shown
in Figure 5; they even extended from one grain to
another. There are still some uncracked segments in the
shear band. The width of the shear band and the
localized strain are uneven along the shear band. Near
the crack tip, the shear band is 20 lm wide, attaining a
strain of 2.14; apart from the crack zone, on the other
METALLURGICAL AND MATERIALS TRANSACTIONS A
�Fig. 4—Microvoids in the shear band generated during dynamic torsional loading in Ti-6Al-4V alloy.
Fig. 5—Shear band transversing several grains and coalescence of microcracks along the shear band during localization in Ti-6Al-4V alloy.
hand, it has a strain of 1.07 and width of about 60 lm.
The occurrence of the shear band does not significantly
affect the capacity of the material for continued deformation (point 3 in Figure 3). In fact, the steep drop in
the shear stress appears only after point 3. The specimen
T9-21 at point 4, with a loading duration of 750 ls,
presents a greater average strain of 0.26 but much lower
stress, only one-third of that at the critical point.
Figure 5 displays the morphology of the critical zone.
A long straight crack has formed along the shear band.
The half-width of the band is about 10 lm. Typically,
the sudden drop in the stress-strain curve is described as
catastrophic failure, due to the localized shearing.[31]
These observations of both stress-strain response behavior and related microstructure suggest that the critical
mechanism governing the loss in load-bearing capacity
is the microcrack coalescence within the band, rather
than the shear-band formation. However, the possibility
that the cracks were generated after deformation cannot
be excluded.
Similarly, Figure 6 shows the localized process of
shear deformation in low-carbon steels subjected to a
dynamic torsion.[44] The experiment reveals that when
the average strain is approximately 0.34, corresponding
to the loading duration of 550 ls (not shown in
Figure 6), the fiducial line on the sample shows homogeneous deformation, and there is no shear localization
METALLURGICAL AND MATERIALS TRANSACTIONS A
to be found on the cross section of the specimen, which
implies that the specimen tested is still in the workhardening stage. However, as the shear strain increases
to about 0.36, corresponding to the loading time of
750 ls (Figure 6(a)), shear localization occurs. After this
point, the specimen appears to work soften with
increasing shear stress. When the loading time is about
890 ls, the shear deformation appears to be apparent
and very narrow bands are formed, as shown in
Figure 6(c). The widths of the bands for the three times
(750, 850, and 890 ls) are 310, 110, and 100 lm,
respectively, which implies that the localized deformation is a progressive process during which shear deformation becomes gradually localized. The widths are
marked in Figure 6. The longer the loading time, the
narrower the band.
One more example is given clearly in Figure 7,
showing a series of interrupted tests performed on an
Al-Li alloy with the modified Split Hopkinson pressure
bar (SHPB) at an average strain rate of about
2.3 · 103 s-1.[77] It was found that, when the average
strain is approximately 0.10, corresponding to a loading
time of 40 ls, the deformation appears to be homogeneous, and there is no shear localization to be recognized on the cross section of the specimen, as shown in
Figure 7(a). This implies that the specimen tested is still
in work hardening. However, as the average strain
VOLUME 39A, APRIL 2008—815
�Fig. 6—Developed process of shear localization corresponding to different loading times of (a) 750, (b) 850, and (c) 890 ls.
Fig. 7—Evolution of localized shear as strain is increased in Al-Li
alloy subjected to dynamic impact compression: (a) loading time
40 ls, average strain 0.1; (b) loading time 100 ls, average strain
0.22, and local strain 3; (c): loading time 120 ls, average strain 0.28,
and local strain 0.8.
increases from 0.10 to 0.17, corresponding to a loading
time of 80 ls, localized shear deformation with a local
strain of 0.75 starts to occur, as shown in Figure 7(b).
Beyond this point, the specimen appears to work soften
as the loading time increases; localized deformation
becomes more apparent, as shown in Figure 7(c). When
loading time is about 120 ls, the shear band narrows,
with a width of 25 lm and local strain of 0.8, as shown
in Figure 7(d). Thus, the evolution of localized deformation is a rapid, progressive process during which the
localization becomes more apparent and the width of
the band becomes gradually narrower. This can be
rationalized in terms of the Bai–Dodd and Grady
equations that predict the shear-band thickness; they
will be presented in Section H.
B. Conditions for the Occurrence of the Shear Band
The criterion for shear-band formation has been one
of the most interesting research challenges; for over
two decades, approaches have been focused on the
theoretical treatments, consisting of a combination of
816—VOLUME 39A, APRIL 2008
mechanical instability analysis with thermal model.
These analyses generally concur that, once the critical
strain corresponding to the macroscopic maximum in
load on a stress-strain curve of the material has been
achieved, the shear bands form (Culver,[7] Dormeval in
1981,[104] Burns and Trucano in 1982,[10] Bai in 1987,[105]
Olson et al. in 1981,[106] Staker in 1981,[107] Semiatin and
Lahoti in 1983,[108] Wu and Freund in 1987,[109] Clifton
and Duffy,[90] Backman and Finnegan in 1973,[110]
Bedford and Wingrove in 1974[111]). Based on the
thermoplastic instability in simple shearing, Bai,[9]
Clifton,[8] and Timothy and Hutchings[112] carried out
linear perturbation analyses and suggested a maximum
load required for the shear-band formation; this is in
agreement with the maximum shear stress criterion
proposed by Culver.[7] Molinari[113] provided a more
advanced,
nonlinearized
perturbation
analysis.
Wright[114] extended this treatment and proposed a
double instability/localization criterion. They were able
to separate the two events. Staker[107] examined the
effect of the AISI 4340 steel tempering temperature on
the susceptibility to ‘‘transformed’’ band formation. He
proposed that there exists a critical strain for the
formation of transformed shear bands that depends on
the heat treatment condition of the steel. Taking into
account thermal softening and conduction, Recht[6]
proposed a critical strain rate as a criterion for the
occurrence of the shear band. In fact, the analysis made
by Clifton[8] arrives at the same expression as that
derived by Recht for high-speed machining. It should be
pointed out that all analyses mentioned here lack
sufficient supporting experimental data. Rogers pointed
out in his review[22] that ‘‘the above results also bear on
the problem of whether or not a Ôcritical strain rateÕ
exists for adiabatic shearing in a given material. The
above results and others obtained at Drexel appear to
support this concept; the results of Timothy and
Hutchings do not.’’ Rogers pointed out again that
‘‘large strain can be achieved quasi-statically in steel
without transformed band formation; hence, provided
that a minimum strain achieved, there must exist a strain
rate above which the removal of heat from the region of
deformation is sufficiently limited that the temperature
can rise above that needed for transformation to
METALLURGICAL AND MATERIALS TRANSACTIONS A
�occur—a critical strain rate.’’ Zurek in 1994[115] studied
the white-etching bands in 4340 steel and found that the
average strain of 0.5 and the associated average strain
rate of 1.8 · 104 s-1 were sufficient to induce an adiabatic shear instability in this steel, implying that both
strain and strain rate should be required for the whiteetching band formation. Bai in 1982[116] predicted in his
analysis that the condition for the band formation
should include both the stress and the strain rate.
BaiÕs prediction[116] is verified by the experimental
investigations of the aluminum and titanium
alloys.[77,117] Figure 8 shows two types of shear bands
formed in a titanium alloy subjected to dynamic impact
compression. It reveals that as the strain rate increases,
localized shear deformation develops gradually, and
when the strain rate reaches 1.75 · 103 s-1, the
deformed shear bands appear first as shown in
Figure 8(a); as deformation proceeds, the width of the
band becomes gradually narrower. When the strain rate
is approximately 2 · 103 s-1, the white shear bands
occur as the result of the further development of the
deformed shear bands, as shown in Figure 8(b).[117] This
result is confirmed further by the observation in the AlLi alloys.[77] The results are shown in Figure 9. In other
words, a critical strain rate is required, in addition to the
critical strain, for the band formation. In fact, the plastic
flow is characterized by necking in tension and compression under quasi-static conditions. Under dynamic
loading conditions, however, the plastic flow cannot
spread uniformly in the whole specimen tested, and is
therefore limited in a local region when the strain rate
reaches or exceeds a critical value. Table II shows the
values of both strain and strain rate needed for the band
Table II.
Critical Strain and Strain Rate Required for Shear
Formation in Al-Li Alloys
Alloy
Peak-Aged Alloy
-1
Strain rate (s )
Critical strain for the
deformed band
Critical strain for the
white-etching band
Underaged
1600
0.14
2000
0.17
0.17
0.21
Fig. 8—(a) Deformed and (b) white-etching bands observed in the titanium alloy subjected to dynamic impact compression loading.
Fig. 9—(a) Deformed and (b) white-etching bands generated during dynamic impact compression loading in Al-Li alloy.
METALLURGICAL AND MATERIALS TRANSACTIONS A
VOLUME 39A, APRIL 2008—817
�formation in Al-Li alloys.[77] It is seen that critical strain
is 0.14 for deformed shear-band formation, at a given
value of the strain rate (1.6 · 103 s-1). After this value,
the width of the band decreases with increasing strain.
As the strain increases from 0.14 to 0.17, a white-etching
band appears (Table II) in the peak-aged alloy. This
result is confirmed again by Li et al.,[118] who have
recently investigated shear-band formation in pure
titanium that was subjected to dynamic impact compression. They found that the shear bands began to form
when both strain and strain rates reached the critical
values of 23 and 2.8 · 103 s-1, respectively.
C. Deformed and Transformed Bands
The localized shear bands have been classified as either
deformed bands or transformed bands, on the basis of
their appearance in metallographic observation.[24,119]
The transformed band is often referred to as a whiteetching band or a white shear band in steels, and has
received much attention, because it is suggested that the
phase transformation temperature is reached in the
narrow band of material, supporting the thermoplastic
instability theory of shear localization. The white-etching
bands have been reported mainly in steels (Trent in
1941,[120] Zener and Hollomon,[1] Carrington and Marie
in 1948,[121] Andrew et al. in 1950,[122] Welsh in 1957,[123]
McIntire and Manning in 1958,[124] Rabinowicz in
1965,[125] Scott et al. in 1966 and 1967,[126] Nakajima
and Mizutani in 1969,[127] Manion and Stock in 1970,[45]
Craig and Stock in 1970,[128] Stock et al. in 1971,[129]
Wingrove in 1971,[130] Glenn and Leslie,[46] Manion and
Wingrove in 1972,[49] Thornton and Heiser,[47] Manganello and Abbott in 1972,[131] Eyre and Baxter in 1972,[132]
Backman and Finnegan,[110] Wingrove and Wulf in
1973,[133] Woodward and Aghanm,[50] Cho and Duffy,[55]
Meyers and Wittman in 1990,[59] and Zurek[115]), and in
titanium and titanium alloys (Me-Bar and Shechtman,[33]
Timothy and Hutchings in 1985,[34,134] Grebe et al.,[29]
Timothy,[24] Winter in 1975,[135] Zhou, Rosakis, and
Ravichandran in 1996,[136,137] Liao and Duffy,[56] and Xu
and Meyers in 2003[138]) and in aluminum lithium alloys
(Xu et al.[77]).
The evidence for the occurrence of phase transformation in the shear bands in steels seems to rise from the
white etch in nital, a well-defined width, distinct
boundaries between the band and the matrix, and very
high hardness. Trent[120] made the earliest observation
of the white-etching bands generated in a plough steel
wire that was crushed by a hammer, and found that
these bands appeared to be white or slightly yellow on
the sheared surface of a wire cut by hand clippers. Using
optical metallography, he observed the absence of
structure in the white-etching area, attributed any
martensitic needles to the deformation-induced transformation, and assumed this must be retained austenite
in this high-carbon steel. Some investigators refer to it as
a dislocation cell structure, while others refer to it as
consisting of extremely fine grains.[46,59] Zener and
Hollomon[1] assumed that the white-etching bands were
caused by a rapid quenching from the high temperature,
and suggested that the strain rates in their punching
818—VOLUME 39A, APRIL 2008
experiments may have reached 2.0 · 103 s-1 and the
temperature in the bands may have risen as high as
1000 oC. The hardness of the shear bands led Zener and
Hollomon to postulate that they were untempered
martensite. Carrington et al.[121] have found ‘‘white
lines’’ in steel, and they proposed that the heat produced
in the white lines probably reach the melting point of
material. Andrews et al.[122] have studied the white lines
in Ni-Cr steel subjected to dynamic impact loading using
X-ray diffraction (XRD) techniques, and examined the
tempering characteristics of the bands. They suggested
that both martensite and austenite may form in the
white lines during impact loading, and considered that
the austenite may be retained. Their experiments also
indicated that the apparent decomposition of the
austenite and the accompanying precipitation of carbide
usually proceeded from the edge of the white lines. This
implied that the center of the white lines could reach a
higher temperature than the edges, allowing more
complete solution of the carbon and carbide-forming
elements. Therefore austenite or martensite at the center
of the white lines could be expected to be more stable
and, consequently, could be the last temper. However,
Scott et al.[126] pointed out that the white-etching bands
could not show the tempering characteristics of conventional martensite, even when heated to temperatures
above normal tempering temperatures; heating to above
the austenite temperature, however, could cause a
disappearance of the white-etching bands and the
formation of a structure indistinguishable from the
remainder of the specimen. Based on the selected area
electron diffraction (SAED) analysis, they suggested
that the white band was supersaturated ferrite, with no
resemblance to the normal martensite structure. Further
investigations by TEM and X-ray show that the band
area is a typical-looking martensite with a high density
of dislocation,[59] bct martensite,[47] a fine-grained equiaxed delta ferrite, and a martensite with carbides[139] and
untempered martensite.[1] Beatty et al.[57] and Meunier
et al.[58] performed TEM examinations of the whiteetching bands and demonstrated that the shear-band
region had grains on the order of 20 to 50 nm and was
ferritic. However, other structures might form under
different conditions.
When we discuss the phase transformation in the
bands, the critical role of the temperature rise in phase
transformation should mentioned. A number of authors
proposed that the maximum temperature rise during
localization may reach several hundred degrees above
that of the surrounding matrix. This is usually inferred
indirectly from metallurgical evidence, and the shear
band is then proposed to be rapidly cooled by the
surrounding bulk material when plastic deformation
ceases, and cooling rates as high as 107 K s-1 have been
calculated.[33] However, some measurements have been
made directly by Hartley et al.,[40] Marchand and
Duffy,[31] Crisman et al. in 1989,[140] Duffy and Chi in
1992,[142] Liao and Duffy,[56] and Guduru et al.[141]
These authors used the IR detection system to determine
the temperature distribution of the bands and found
that the highest temperature in the band region was in
the range of 440 �C to 550 �C for the Ti-6Al-4V
METALLURGICAL AND MATERIALS TRANSACTIONS A
�alloys,[56] 450 �C for AISI 1018 cold-rolled steel and
AISI 1020 steel,[34] 590 �C for HY-100 steel,[56] and
460 �C for AISI 4340 steel.[143] They concluded, therefore, that there was no clear evidence to suggest that the
material within the shear band had undergone a phase
transformation. Giovanola pointed out[103] also that
there is no conclusive direct evidence for the occurrence
of phase transformation in the white-etching bands and
that the band structure is not unique; it depends on the
deformation history and the original microstructure of
the undeformed material. The only important point of
common agreement is that the structure in the transformed bands is composed of very fine grains. Rogers
mentioned in his review[21] that ‘‘whether there is a single
crystallographic structure for the transformed adiabatic
shear bands in steel or whether there are a variety of
structures dependent on the particular material and the
deformation condition is still a very open question.
There are many indications that the white-etching shear
bands may have different structures in different materials and even that the structures may be different in
parts of the bands.’’[22] In addition to etching behavior,
there are two almost universally recognized characteristics of the transformed bands in steels: their very high
hardness and their extremely fine structure. The investigation made in Al-Li alloys under high-speed impact
compression has shown[77] that the deformed bands
(Figure 9(a)) form first, corresponding to the critical
strain of 0.14, and, as deformation proceeds, localization gradually becomes apparent; finally, the whiteetching band occurs on the base of the deformed band,
corresponding to a critical strain of 0.17, as shown in
Figure 9(b). Timothy pointed out that the formation of
a ‘‘transformed’’ shear band appears to correspond to
an advanced stage of adiabatic strain localization in a
given metal, with a deformed shear band representing an
earlier stage in this process.[144] The results mentioned
here[55,144] are supported by the recent experimental
results in high-speed machining of the high-strength
steel.[145]
A number of investigations have demonstrated that
whether the bands are deformed or transformed, their
presence is generally indicated by the different etching
response in a narrow band of material in metallographic
cross sections. Figure 10 shows white shear bands
observed in 304 stainless steel subjected to explosive
collapsed loading. One of the possible reasons for the
‘‘white color’’ of the band is the occurrence of a
martensite that is too hard to be etched, causing the
white color (the a¢-martensite transformation does occur
in the band; this will be shown in Section D). In order to
verify this, the profile line scanning across the band was
Fig. 10—White-etching shear bands observed in 304 stainless steel subjected to explosive collapsed loading imaged by CFLSM at (a) and (b) low
magnification and (c) and (d) high magnification.
METALLURGICAL AND MATERIALS TRANSACTIONS A
VOLUME 39A, APRIL 2008—819
�performed by using CFLSM. If the band is lightly
etched, then the profile-scanning line should appear to
be protrusion when the scanning is across to the bands
(Figure 11). The profile scanning selected is along the
horizontal lines (the red lines in Figures 11(c) and (d),
respectively). It is seen that the profile-scanning lines do
not appear to be protrusion, as shown in Figures 11(c)
and (d). This implies that the structure in the band is not
difficult to etch. Many investigations show that the
structures within the shear bands undergo intensive
localized deformation with large strain and super-high
strain rate, forming substructures elongated along the
shear direction. This is proposed to be the real reason
for the white etching color of the band. In other words,
the white etching of the bands is an unlikely indication
of the phase transformation; in fact, the observed
substructures in the white etching differ by a degree
not observable by ordinary optical microscopy or by
SEM. Both ordinary light waves and secondary electron
waves could not ‘‘see’’ the substructure difference in
orientation in the bands. Therefore, the band appears to
be white when viewed by ordinary light under an optical
microscope or secondary electron wave in a scanning
electron microscope. So, it is reasonable to propose that
the white etching is unlikely to be the occurrence of
phase transformation in the bands. This analysis is verified further by recent experimental results in Fe-Cr-Ni
monocrystal.[146] Recent investigation has shown however, that phase transformations can occur in both the
deformed and transformed bands; these will be
described in Section D.
D. The a¢-Martensite Transformation within the Bands
Recent studies have shown that the phase transformation does occur, certainly in the shear bands in 304
stainless steel[63] and Fe-Cr-Ni monocrystal,[146] and in
the Ti-6Al-4V alloys,[84] which were deformed dynamically. Figure 12 shows a shear band and its microstructure observed in 304 stainless steel subjected to the
cylindrical collapse (TWC) test with a strain rate of
104 s-1; Figure 13 is the TEM image taken from a
field in the band shown in Figure 12, indicating a
a¢-martensite phase transformation occurring in the
band. This kind of phase transformation particularly
generates at the intersection between the shear band and
Fig. 11—Profile line scanning across the bands obtained by CFLSM: (a) the scanning area, including (b) the band, (c) area scanning, and (d)
lines scanning across the band.
820—VOLUME 39A, APRIL 2008
METALLURGICAL AND MATERIALS TRANSACTIONS A
�Fig. 12—Shear-band and vortex structure generated in cylindrical collapsed specimen of 304 stainless steel subjected to global eef = 0.92.
Fig. 13—TEM (a) bright- and (b) dark-field images, showing a¢-martensite phase transformation formed at the intersection between the
twins and the shear bands in 304 stainless steel subjected to explosive collapsed testing.
twins, and can be confirmed by dark-field image and
electron diffraction analysis. The presence of vortices,
also inferred from the IR results by Guduru et al.,[141] is
also suggested in Figure 12. The dark-field image
(Figure 13(b)) is obtained through the appropriate
martensite spot, and analysis indicates that the (�110)
planes of the a¢-martensite are coherent with the (�111)
planes of the parent austenite, and parallel to each
other. The direction, [110], of the a¢-martensite is
parallel to the [211] direction of the austenite, e.g.,
�
�
110
�
a0
�
�
== �
111 c
�
�
½0 0 2�a0 == 0 2 �
2 c
�
�
�
�
�
131 c
1 1 2 a0 == �
½1 1 0�a0 ==½2 1 1�c
which is the Nishiyama orientation. From this analysis,
it is concluded that the (110) of the a¢-martensite
nucleates along the {111} of the austenite. Essentially,
these results confirm an earlier investigation made by
Staudhammer et al.[147] in dynamic tensile testing of the
METALLURGICAL AND MATERIALS TRANSACTIONS A
Fig. 14—TEM (a) bright- and (b) dark-field images, showing that
a¢-martensite phase transformation appears at the intersection
between the twins and the shear bands in Fe-Cr-Ni monocrystal subjected to explosive collapsed testing.
same materials. These a¢-martensite laths nucleate preferentially at twin-band intersections and regions of
localized strain. They have been identified by Murr and
Ross[148] and Kestenbach and Meyers[149] in connection
with shock compression, and by Staudhammer et al.[147]
in high-strain-rate deformation. These are the twinning
and slip planes; thus, their intersections provide the
nucleus, as postulated by Olson and Cohen.[150] This
kind of phase transformation was also observed within
the shear bands in a Fe-15 pct Cr-15 pct Ni monocrystal
subjected to the dynamic explosive loading, as shown in
Figure 14.[146,151] Figures 14(a) and (b) are bright- and
dark-field images of what is presumed to be straininduced martensite. One more example is shown in
Figure 15, indicating that the phase transformation also
occurs in the deformed-type bands in the Ti-6Al-4V
alloy. Figure 15(a) is a bright-field image taken from a
primary-a grain of the alloy, and Figure 15(b) is its
combined electron diffraction pattern. Figures 15(c) and
(d) are the bright- and dark-field images that were
obtained by the strong diffraction (a) and the weak
superlattice reflection {1�100}a2, respectively. According
to the analyses of the electron diffraction and dark-field
image, the a2 phases (Ti3Al) are proposed to be
transformed from the a matrix, and both the a2 phases
and a matrix are completely coherent. This kind of
transformation is proposed to be, to the authorsÕ
VOLUME 39A, APRIL 2008—821
�Fig. 15—TEM montage, showing (a) bright-field of the high-strain-rate deformation structure in Ti-6Al-4V alloy, and its (b) [0001] zone axis diffraction pattern and dark-field images obtained by using strong diffraction spots {2�200}a marked by a and weak superlattice reflection {1�100}a2
marked by a.
knowledge, the first finding in this alloy subjected to
explosive collapsed loading.
The a fi a2 (Ti3Al) transformation has been reported
in the titanium-alloys.[152–155] Mendiratta et al.[152] have
reported the a2 (Ti3Al) precipitation in Ti-6Al-2Sn-4Zr2Mo during creep, and found that the a2 (Ti3Al)
particles are extremely small and, therefore, are likely
to be sheared by the dislocations in the a matrix.[153] Li
et al.[154] investigated formation of the Ti3X (where
X = Al, V, and Zr) phases in titanium alloy, and found
that when the content of X in the alloy reaches a critical
solution degree, the long-region ordered phase (Ti3X)
with superlattice structure starts to occur in a-Ti.[123]
The shape and distribution of the a2 phases they
obtained are similar to the observations in the present
investigation. However, the transformation from a to a2
in the Ti-6Al-4V alloy induced by dynamical deformation under a high strain rate has not been published, and
further studies for mechanism of the phenomenon are
still needed.
The occurrence of martensitic transformation in
concurrence with shear-band formation has been demonstrated[151] in a Fe-Ni-C monocrystal. The spacing of
shear bands was affected by the presence or absence of
martensite. Meyers et al.[151] demonstrated that there
are interaction effects between martensite transformation and shear-band propagation.
E. Effect of the Microstructures on Shear-Band
Formation
It is generally accepted that a material will be sensitive
to localized shearing if it is characterized by a low strain
hardening, a low specific heat, and a high thermal
softening. Rogers pointed out[21,22] that the deformed
bands are likely to form in iron, in low-carbon steels,
and in higher-carbon steels, when the structure is coarse.
Also, as the rate of deformation decreases, there is a
greater tendency for the shear bands to be of the
deformed type, and a transformed portion to extend
from the region of most intense shear to a point at which
the local temperature has not exceeded the transformation temperature. Rogers and Shastry proposed[119] that
822—VOLUME 39A, APRIL 2008
the transformed band may be partly along the adiabatic
band and partly along the deformed band for the
remainder, and that the type of band forming is highly
dependent on the specific deformation conditions.
Backman and Finnegan[110] studied the tendency of
several different metallurgical structures in AISI 4130
steel to the formation of the different types of the bands
during ballistic impact and found that, when the steel
was heat treated to produce either pearlite or Widmanstätten ferrite, only deformed bands were observed;
when the steel was heat treated to produce a tempered
martensitic or lower bainitic structure, the white-etching
transformed bands were formed. It can be seen that the
effects of the material structures on localized shearing
have not been well understood. Costin et al.[156] have
found that the localized shear band developed in all
high-strain-rate tests with cold-rolled steel, and that
none forms in hot-rolled steel when deformation is
limited to about 30 pct strain; these two steels have
similar chemistries and showed very similar strain-rate
sensitivities and thermal softening rates. However,
Shawki and Clifton[157] predicted that the shear bands
would form in hot-rolled steel, deforming dynamically if
a nominal strain of 80 to 100 pct were imposed; they
have considered that the reason no localized shear
formed in the hot-rolled steel may be attributed to the
low strain used. This proposal was justified by the
results of Hartley et al.[158] However, they found that
the shear bands in hot-rolled steel (about 150 lm wide)
are narrower than that in cold-rolled steel (about 250
lm wide). Xu et al.[44,159–161] studied the tendency of the
low-carbon steels with different structures to shear
localization and found that the critical strain required
for the occurrence of shear localization is strongly
dependent on the strength at a given strain rate. This can
be seen clearly from Figure 16, which shows that the
critical strain values for the quenched, quenched and
tempered, and normalized steels are 0.30, 0.36, and 0.83,
respectively, implying that the steel with quenched
martensite is most susceptible to shear localization.
The higher the strength of the steels, the easier it is
for the shear band to occur. The quenched steel with
high strength and low work-hardening capability does
METALLURGICAL AND MATERIALS TRANSACTIONS A
�Fig. 16—Localized shear bands in the low-carbon steels: (a) quenched condition, (b) quenched and tempered, and (c) normalized.
Fig. 17—SEM montage, showing deformation pattern in Al-17 pct SiCp composite with an average particle size of (a) 3, (b) 13, and (c) 17 lm,
produced during high-strain-rate loading. Note that material with smaller particles (3 lm) develops a well-defined localized shear band (a), and
shear localization in the materials with larger particles (13 and 17 lm) does not develop well.
develop pronounced shear bands with a width of 70 to
100 lm (Figure 16(a)). However, the width of the bands
in normalized steel with a higher capability of work
hardening is much larger than those of the other two
steels, approximately 350 to 400 lm (Figure 16(c)). The
width in the quenched and tempered steel is in between
them (Figure 16(b)). It should be pointed that the
boundary between the bands and the steel matrix for
these steels is not well defined.
One more example is shown in Figure 17, displaying
the effect of the microstructure on the tendency for
METALLURGICAL AND MATERIALS TRANSACTIONS A
localized shear deformation in the aluminum matrix
composites reinforced with different size SiC particles.[162] It is found that the composite reinforced with
smaller particles (3 lm) develops well-defined shear
bands, as shown in Figure 17(a), and those with larger
SiCp, 13 and 17 lm in size, tend to deform inhomogeneously, so localized shear was not well developed, as
shown in Figures 17(b) and (c). This implies that the
particles may play a significant role in the formation and
development of shear localization, and the smaller the
size of the particles in the composites, the easier the
VOLUME 39A, APRIL 2008—823
�shear-band formation; this coincides with the results
obtained by Lee et al.[163,164] and Ling and Luo
et al.[165,166] The tendency of the composite reinforced
with small particles to form shear localization is greater
than that of other two materials with large particles,
when the volume fraction of the particles in the
composite remains the same. This size-dependent deformation localization behavior of particle-reinforced
metal matrix composites is confirmed by recent research
results.[167,168]
zones retained lattice fringes (Figure 19(a)), which
were distributed over the whole amorphous area
(Figure 19(b)). These observations were further confirmed by HREM conducted on 304 stainless steel and
shown in Figure 20, where one can note that some areas
are not transformed into the amorphous phase and
retain the lattice fringe feature (Figure 18). The absence
of imaging from the crystalline lattice, in contrast with
the crystalline region, is strong evidence for the lack of
crystalline symmetry. This is a surprising finding and is,
F. Amorphous Phase within the Bands
It is remarkable that an amorphous region in the
shear bands was recognized in the TWC specimens of
both 304 stainless steel and Fe-Ni-Cr monocrystal that
were subjected to explosive collapse loading.[63,146] The
observation in monocrystalline Fe-Cr pct Ni under the
same experimental conditions as the observation in AISI
304 stainless steel described by Meyers et al.[151] is
shown in Figure 18. It can be seen that the interface
between the amorphous and the crystalline regions is
clear, that the amorphous region is absent from the
crystalline lattice, and that the crystalline region is
composed of the nanograins. Figure 19 shows HREM
images taken from these two different regions in
Figure 18. It is clear that some small, nanometer-sized
Fig. 19—HREM images, showing (a) nanosized grains and (b) amorphous phase in the shear band produced during explosive collapsed
loading.
Fig. 18—TEM (bright-field) image taken from a region in shear band showing the amorphous phase and nanocrystalline regions, and corresponding diffraction patterns from the (a) amorphous phase, (b) nanocrystalline region, and (c) interface of nanocrystalline and amorphous
phase in Fe-Cr-Ni crystal subjected to TWC collapse.
824—VOLUME 39A, APRIL 2008
METALLURGICAL AND MATERIALS TRANSACTIONS A
�to the authorsÕ knowledge, the first observation of a
crystalline-to-amorphous transition in a localized shear
band. This kind of transformation of a crystalline-toamorphous state has been observed in many binary
alloy systems by mechanical alloying[169–171] and by ball
milling.[172–175] In the former case, the results show that
a negative heat of mixing and last diffusion of one of the
elements favor the formation of an amorphous alloy
phase[176] and, in the latter case, ball milling may induce
not only the accumulation of lattice and point defects
but also chemical disordering in the lattice. If the rate of
dynamic recovery is lower than the rate of defect
production, the accumulation of these topological and
chemical disorders may lead to a collapse of the
crystalline structure.[169] Meyers et al.[63] have proposed
a reasonable explanation for this solid-state amorphization and considered that the transition of crystallineto-amorphous phase in the case of the shear localization
is completely possible.[63]
It should be pointed out that there is a possibility that
the amorphous phase could be induced by ion milling
during thin-foil preparation for TEM examination.
Several points should be noted. First, as shown in
Figure 19, only an isolated amorphous region is observed
around the hole; if it is induced by ion milling, then the
amorphous regions should be distributed along the edge
of the hole. Second, there is clear interface between the
amorphous and nanograin regions, and their arrangement alternates from one to another, as shown in
Figure 18. If it is caused by ion milling, there is no
possibility for the amorphous regions to show this type of
alternative arrangement. Third, some nanograins, 10 nm
in diameter, are distributed over the amorphous region
(Figure 20), and some zones still retain low-dimensional
lattice fringes (Figures 20(a) and (b)), implying that the
transition of the crystal lattice to amorphous matter is
not complete. The distribution of amorphous regions
Fig. 20—HREM image taken from the amorphous region in the
shear bands in 304 stainless steel produced during explosive
collapsed testing. Note that some zones still keep two-dimensional
lattice fringes.
METALLURGICAL AND MATERIALS TRANSACTIONS A
should be homogeneous, if it is introduced by ion milling.
Therefore, it is reasonable to consider that the amorphous matter observed within the shear bands in the present study should be the product of transformation from
crystalline-to-amorphous domains during localization.
G. Recrystallization
Recrystallization arising from high-strain-rate loading
has been well documented by some investigators in steels
(Glass and Moss in 1961,[177] Mataya and Carr in
1982,[178] Meyers and Xu,[63] Li et al.,[179] Lins
et al.[180]), in titanium (Meyers and Pak in 1986,[35] Xu
and Meyers in 2003,[138] Chichili et al.[38]), in copper
(Andrade et al. in 1994,[181] Hines and Vecchio in
1995,[182] Murr et al. in 1995,[183] and Hines et al. in
1998,[184]), in tantalum (Pappu et al. in 1995,[185] Murr
et al. in 1994,[186] Nesterenko et al. in 1997,[187] Meyers
and Chen in 1995,[43,73] and Nemat Nasser et al.[75]), in
aluminum-lithium alloys (Xu et al.[77] and Meyers et al.
in 2000[187,188]), in Al/SiCp composites (Xu et al.[162]),
and in Ni-Cu alloys (Li et al. in 2000[189]). It is generally
accepted that the deformation and associated temperature rise during high-strain-rate loading are, therefore,
sufficient to produce new recrystallized grains in the
shear bands, although it is not clear at present that this
recrystallized microstructure develops simultaneously
with deformation (dynamic recrystallization (DRX)) or
subsequent to deformation (static recrystallization). The
microstructural characteristics of DRX are the fine
equiaxed grains with low dislocation density and welldefined grain boundaries. Glass et al.[177] made the
earliest observation of recrystallization in shear bands in
an explosively loaded steel cylinder; they surmised that
the fine undeformed grains were the result of recrystallization. Based on dislocation dynamics and subgrainboundary change in orientation enhanced by plastic
deformation, Li et al.[179,189] and Meyers et al.[190] independently proposed models for describing this DRX,
which occurs during high-strain-rate deformation.
Cho et al.[191] considered that the fine equiaxed grains
observed in the center region of a shear band in HY-100
steel was caused by dynamic recovery rather than by
DRX. It is possible that, in their case, the strain inside
the shear band was not sufficient to complete the
recrystallization process.
Recent investigations show that this recrystallization
also occurred in 304 stainless steel[63] and Ti-6Al-4V
alloy[138] subjected to explosive collapse loading.
Figure 21(a) shows a bright-field image consisting of
nanograins with an average size of 100 nm in diameter,
within a band of 304 stainless steel. For comparison,
both large grains approximately 50 to 100 lm in
diameter located external to the band region and the
high density of dislocations are illustrated in
Figure 21(b). There are several prominent features of
microstructural change between intraband regions and
extraband regions (Figures 21(a) and (b)). The size of
the refined grains within the band (Figure 21(a)) is much
smaller, by 10 orders of magnitude, than the grains with
profuse dislocations outside the band (Figure 21(b)).
The second feature is the absence of deformation twins
VOLUME 39A, APRIL 2008—825
�Fig. 21—Nanograins (50 to 100 nm in diameter) (a) inside deformed
bands and large grains (50 to 100 lm ) with high density of dislocations outside bands.
Fig. 22—(a) Bright- and (b) dark-field TEM showing ultrafine-grainsized structure within shear band in Al-Li alloy.
within the bands while the density of dislocation is high
outside the band. A similar phenomenon was also
observed in the Al-Li alloy subjected to shear localization. Figure 22(a) shows a bright-field TEM of distortion-free and equiaxed grains taken from a shear band in
this alloy, whereas Figure 22(b) shows the dark-field
image. These new grains (~200 nm) in the bands are
much smaller in size, by factors of 10 to 100, than the
grains outside the bands. All these features observed
within the shear bands in 304 stainless steel and Al-Li
alloy are indicative of recrystallization that occurs in the
shear bands during localized shear deformation.
Figure 23 shows four different metals in which the
shear localization region exhibits the same features:
equiaxed grains with diameters on the order of 100 to
4000 nm. They represent the fcc (copper and 304
stainless steel), bcc (interstitial-free (IF) steel), and hcp
(titanium) structures. The microstructures for these
different crystal structures (hcp, fcc, and bcc) are
remarkably similar: approximately equiaxed micrograins with diameters between 0.1 and 0.3 lm.
The structure shown in Figure 23(d) represents
an electron backscattered diffraction (EBSD) of a
forced shear band in IF steel. Lins et al.[180] propose a subgrain-progressive, subgrain-misorientation
826—VOLUME 39A, APRIL 2008
recrystallization similar to the rotational recrystallization
proposed earlier by Meyers et al.[190] The results presented herein are in full agreement with the early
observations through TEM by Grebe et al.[29] in Ti-6Al4V and by Meyers and Pak[35] and Meyers et al.[36] on
commercial-purity titanium. Results by Chichili et al.[38]
also show the formation of an equiaxed ultrafine-grained
structure inside the shear band in Ti. Indeed, the response
of Zr is very similar to Ti, including the shear-band width.
Figure 24 depicts a well-defined shear band in
Zircaloy.[68] The shear-band interface cuts the picture
diagonally (Figure 24(a)). A very refined microstructure
is apparent. This microstructure is seen in greater detail
in Figures 24(b) and (c). In spite of the large deformation
applied, the final grain size within the band is approximately 200 nm. The selected area diffraction pattern
(SADP) corresponding to the ultrafine-grained structure
developed within the band, illustrated in Figure 24(d),
consists of well-defined rings, indicating the presence of
highly misoriented grains. It should be noted that the
diffraction pattern was taken using an aperture size large
enough to encompass the entire band width.
Derby[192] proposed two kinds of mechanisms (rotational and migrational types) for the DRX produced
under a high strain rate. Because the time required for
formation of the shear band is lower by several orders of
magnitude than the time required to create grains of the
0.1-lm size by the migration of the boundaries,[189,193]
conventional migrational recrystallization could not be
considered to be the mechanism of DRX. However, a
number of investigations show that a variety of dislocation sources, including the Frank–Read source, will be
activated and, therefore, dislocations are multiplied
significantly under dynamic loading. Campbell et al.[194]
have pointed out that a typical Frank–Read source will
begin to be multiplied in 5 · 10-9 ls and, at that time,
the estimated plastic strain in a typical metal will be only
0.003. These dislocations will form substructures such as
cells and tangles, leading to heterogeneous distribution
in microstrain in the shear bands, while the temperature
increases simultaneously. These could provide favored
conditions for the nucleation of new grains. Because
deformation and recrystallization in the bands proceed
simultaneously during localization, the new grains and
deformation features within the recrystallized grains
could sometimes be observed. However, if the temperature in the bands decreases very quickly due to thermal
diffusion, the residual deformation structures can be
kept and, therefore, the new recrystallized grains could
hardly be observed in this case, depending on the
materials tested. The dislocation multiplication and
formation of the cells in the bands are like a first step
in DRX, and then the difference in orientation of the
sub-boundaries increases, because a great deal of dislocation is absorbed into the subgrain boundaries under
high-rate deformation and, finally, sub-boundary rotation may take place during localization, leading to
nucleation of the new grains in the shear bands. The
calculation demonstrates that DRX will be a spontaneous production process from the point of transition
from high to low energy.[187,195]
METALLURGICAL AND MATERIALS TRANSACTIONS A
�Fig. 23—Ultrafine-grained structure in bands in (a) copper, (b) titanium, (c) stainless steel (courtesy of E. Cerreta), and (d) interstitial-free steel
(courtesy of K.S. Vecchio).
The sequence of events depicted in Figure 25 is
expected to occur. It was first postulated by Andrade
et al.[181] and Meyers et al.,[190] and has since then been
described in increasing detail. In essence, one starts with a
random dislocation distribution (Figure 25(a)), which is
not a low-energy configuration. This random distribution
gives way to elongated cells. This stage is shown in
Figure 25(b). As the deformation continues and the
misorientation increases, these cells become elongated
subgrains (Figure 25(c)). These elongated structures are
seen in many metals subjected to high strains, as reported
by Gil Sevillano et al.,[197] among others. Hughes and
Hansen[198] reported rotations of 30 to 45 deg at medium
and large strains (cold-rolling reductions from 70 to
90 pct). Hughes et al.[199] made detailed TEM observations on heavily deformed metals Ta and found evolution
METALLURGICAL AND MATERIALS TRANSACTIONS A
from configuration (b) to (c) in Figure 25. These elongated subgrains are, in their turn, plastically deformed,
leading to further breakup (Figure 25(d)). Eventually, the
elongated subgrains break up into approximately equiaxed micrograins (Figure 25(e)).This sequence of events,
which is well known for severe plastic deformation (SPD),
has received different names:
(a) rotational DRX (e.g., Derby[192]), which needs concurrent plastic deformation; it is well documented
for geological materials (this was the interpretation
given by Meyers et al.[36] for titanium, Andrade
et al.[181] for copper, and Nesterenko et al.[187] for
tantalum);
(b) formation of geometrically necessary boundaries;[200]
VOLUME 39A, APRIL 2008—827
�Fig. 24—Zircaloy hat-shaped specimen: (a) interface between shear band and adjacent regions, (b) and (c) interior of the shear band, (d) SADP
corresponding to the ultrafine-grained microstructure (courtesy of B. Kad and A. Mishra, University of California at San Diego).
(c) continuous recrystallization;[201] and
(d) progressive subgrain misorientation recrystallization.[180]
Once this equiaxed ultrafine-grained structure is
achieved, it has to undergo additional plastic deformation under the imposed conditions. Due to the difficulties encountered in measuring the temperature rise
inside the band during dynamic loading, the temperature within the band has to be estimated; here, we will
give a simple method for the calculation of the temperature rise in the band that was performed on a 2024Al/
SiCp composite.[162] The temperature that makes the
onset of thermal recovery or recrystallization in metals is
generally expressed by
T ¼ ð0:4 � 0:5 Tm Þ
½1�
where Tm, the melting point of metals, is 933 K for the Al
alloy. Therefore, if recystallization occurs in the Al alloy,
the temperature in the band should be in the range of 373
to 466 K. We assumed that most of the plastic deformation work is converted into heat (90 pct). Thus, the
828—VOLUME 39A, APRIL 2008
temperature rise in the band can be estimated using the
stress-strain response from the same material in the
cylindrical compression test (Ling and Luo[166]), and
expressed by
T ¼ To þ 0:9Wp =q � Cv
½2�
where To is the room temperature; Cv, the heat capacity,
is 903 J/Kg k for Al; the density of the material is
2.7 · 103 kg/m3; and Wp, the specific work of deformation, can be expressed by the following equation:
Z
Wp ¼ r � de
½3�
Assuming linear hardening up to a strain of 0.56 for the
2124Al/SiCp composite, we obtained Wp = 560 · 106
J/m3, according to the data in the literature (Ling and
Luo[166]). Thus, the temperature rise in the band is
T ¼ To þ 0:9 Wp =Cv ¼ 293 K þ 206 K ¼ 499 K
½4�
which is higher than the recrystallization temperature in
Al (373 to 466 K). This calculation for the temperature
METALLURGICAL AND MATERIALS TRANSACTIONS A
�Fig. 25—Schematic illustration of microstructural evolution during
severe dynamic plastic deformation: (a) homogeneous distribution of
dislocations, (b) elongated cell formation, (c) dislocation accumulation in subgrain boundaries, (d) breakup of elongated subgrains, and
(e) reorientation of subgrain boundaries and formation.
rise in the band is coincident with that of the Al-Li alloy
(Xu et al.[77]). Similarly, the temperature outside the
band is estimated to be 402 K, which is lower than that
of recrystallization. This simple calculation is in good
agreement with the experimental observation of the
present study, and it is reasonable to propose that the
observed equiaxed grains result from the occurrence of
recrystallization in this material.
H. Grain Rotation Mechanisms and Similarities with
Equichannel Angular Processing
A possible mechanism is presented in this section. It
was proposed for SPD, an emerging area of research for
the production of ultrafine-grained metals. It is
described in detail by Mishra et al.[222] and Kad et al.[68]
As the grain size is reduced to the range of 50 to 200 nm
METALLURGICAL AND MATERIALS TRANSACTIONS A
by the localized deformation in the shear band, the
deformation mechanisms operating at conventional
grain sizes have to be re-examined. This is an area of
intense current research, and the concept of grainboundary sources and sinks is gaining importance.[93,113]
We assume that grain boundaries act as primary sources
of dislocations. There is an associated shear of the
idealized cubic ultrafine grain. When the dislocations are
annihilated in the opposite boundary, the cube is
transformed into a parallelepiped.
The deformation temperature is such that grainboundary rotation is possible within the deformation
process. This rotation of the grain boundaries, coupled
with shear on a new slip plane, ensures the retention of a
steady-state equiaxed structure. The process of grainboundary rotation during deformation was first analyzed
by Meyers et al.[42] and extended to severe plastic
deformation (SPD) by Mishra et al.[222] It is reproduced
here in a succinct fashion. In order for this mechanism to
be viable, it has to be shown that grain-boundary
rotation can be accomplished in this short deformation
time. The relaxation of the rotated grains into a more
equiaxed microcrystalline structure can occur by minor
rotations of the grain boundaries. This is shown in
Figures 26(a) and (b), where it is shown that a rotation of
30 deg of the boundaries transforms elongated, segmented subgrains into an equiaxed structure. If each
longitudinal grain-boundary segment AB rotates to A¢B¢
by an angle h, the original equiaxed structure will be
created. This is illustrated in Figures 26(a) and (b). This
can be accomplished by the flux of atoms along the grain
boundary, which can occur at rates that are orders of
magnitude higher than in the bulk. The activation energy
for grain-boundary diffusion is approximately one half
of that for the lattice diffusion and, at T/Tm = 0.5, the
ratio between grain-boundary diffusion, DGB, and lattice
diffusion, DL, is between 107 and 108.[203]
The rotation of the boundaries is driven by the
minimization of the interfacial energy (e.g., Murr[96]).The
force exerted by the grain boundaries is equal to
(=180 deg)
�
�
h0
F ¼ c 1 � 2 cos
L
½5�
2
where c is the grain-boundary energy, L is the length of
the grain-boundary segments shown in Figure 26, and
h0 is the initial value of the angle between the boundaries.
The final expression for the angle of rotation h as a
function of time, t, is
pffiffiffi
tan h � 23 cos h
4
tan h2 � 2 � 3 2
pffiffiffi þ
þ pffiffiffi ln
ð1 � 2 sin hÞ
3 3 tan h2 � 2 þ 3 3
pffiffiffi
4
2 þ 3 4dDc
pffiffiffi ¼
t
½6�
� pffiffiffi ln
3 3 2 � 3 L1 kT
A detailed derivation is provided by Meyers et al.[208]
The term D is the grain-boundary diffusion coefficient
and d is the thickness of the grain boundary. In
Figure 27, the grain side L1 = 0.2 lm. This is a conservative value, since a hexagonal grain with diameter of
VOLUME 39A, APRIL 2008—829
�Fig. 26—(a) Original configuration of subgrains after breakup and (b) rotation of boundaries leading to equiaxed structure.
0.2 lm would have a side of 0.1 lm. The most important
parameter in Eq. [6] is the grain-boundary diffusion
coefficient. The grain-boundary width is variously taken
as 0.5 to 1 nm. The interfacial energy was obtained from
Murr.[209] It is taken as 0.725 mJ/m2. The rate of rotation
decreases with increasing h and asymptotically
approaches 30 deg as t fi ¥. The calculations predict
significant rotations of the boundary within the deformation time (~50 to 100 ls) at temperatures between 0.45
and 0.5 Tm, for micrograin sizes of 0.1 to 0.3 lm. Thus,
the reorientation of grain boundaries can take place
during plastic deformation. This does not exclude the
possibility of the reorientation or accommodation of the
grain boundaries during cooling.
The rotation as a function of time is shown for
T = 0.4, 0.45, and 0.5 Tm in Figure 27(a), which is
directed at the shear band. It can be seen that the grain
boundaries can rotate at times on the order of 20 ms.
This is on the order of the deformation time. Thus, an
equiaxed structure can be achieved in copper. For
equichannel angular processing (ECAP), the situation is
quite different: the temperature rises per pass are much
more modest (~50 to 70 K) (Figure 27(b)). Thus, the
times are much longer, but still in the realm of the
extrusion process: ~0.1 second. It is interesting to note
that both processes have, in spite of dramatic differences
in strain rate and temperature,
fairly similar Zener
�
parameters (ln Z ¼ ln e þ Q=RT ¼ 35)
I. Super-High-Strain-Rate Deformation within the Bands
It is well known that, once localized shear deformation has commenced, a steep strain and strain rate as
well as temperature rise will appear in the shear bands.
Li[196] made an interesting observation and has calculated the deformation behavior of the white band in
0.5Tm(677K)
0.45 Tm(610K)
0.5
0.275 Tm(375 K)
0.5
0.256 Tm(350K)
0.4
angle(radians)
angle(radians)
0.4 Tm(542K)
0.3
0.2
0.1
0
0.4
0.3
0.238 Tm(325K)
0.2
0.1
0
1
2
3
time (sec)
(a)
4
5
-5
x 10
0
0
0.05
0.1
0.15
time (sec)
0.2
0.25
0.3
(b)
Fig. 27—Rotation angle as a function of time at different temperatures: (a) characteristic values in shear-band formation and (b) characteristic
values for ECAP.
830—VOLUME 39A, APRIL 2008
METALLURGICAL AND MATERIALS TRANSACTIONS A
�Fig. 28—Shear band in a-Ti developed during dynamic compression.
Note: the grains on both sides of the band were sheared by shearing
deformation, and made relative displacements.
a-Ti, as shown in Figure 28, where one can see that both
sides of the band were displaced; for example, the
displacements from a to a¢, b to b¢, c to c¢, and d to d¢
occur during localization. From these, it is found that
the width of the shear band is 12 lm, and the average
shear strain, which is the displacement divided by the
width of the bands, was measured to be 5.2. According
to the equation of the half-width of the shear band
proposed by Dodd and Bai:[202]
sffiffiffiffiffiffiffiffiffi
kh�
½7�
d¼
s� c_ �
and the temperature rise within the bands was obtained
by assuming that 90 pct of deformation work is converted into heat:
h� ¼
0:9s� c�
q�c
½8�
The time required for shear-band formation can be
obtained by the following equation from Eq. [7] with
Eq. [8]:
qc 2
d
t ¼ c� =_c� ¼
½9�
0:9k
where s� ; c_ � , are the shear stress and strain rate, h* is
the temperature rise in the band, k is the coefficient of
the heat conduction, q is the material density, and c
is the heat capacity. The parameters used in Eq. [3] are
as follows: q = 4.5 gÆcm-3, c = 0.473 J g-1 K-1, k =
14.63 w m-1 K-1 for a-Ti, and t = 0.1616 d2, where the
unit of the t is microsecond, and the unit of the d is
micrometer.
Grady[220] has another equation, of the form
!1=4
9q3 C2 k3
½10�
d¼
�
sa2 c
where a is the thermal softening rate, assuming linear
behavior (s = s0 (1-aT)); the other parameters were
METALLURGICAL AND MATERIALS TRANSACTIONS A
previously defined. Grady later proposed another
equation, in which the term 9 is replaced by 16.
From Eq. [9], it is found that the time required for
formation of the band is 5.8 ls and, therefore, the strain
rate that the shear band underwent is 9 · 105 s-1, which
is higher by two orders of magnitude than the average
strain rate (2 · 103 s-1) required for formation of the
shear band, implying that formation of the shear band
may accompany an abrupt increase in strain rate. In
other words, the materials within the band underwent a
super-high-strain-rate deformation. This is confirmed by
the investigation of the Al-Li alloy.[77] Giovanola[103]
measured directly the shear strain rate in the shear band
as a function of time in VAR 4340 steel by using a highspeed photography technique, and found that shear
localization occurs in two sequential stages: during the
first localization, the strain rate (104 s-1) jumps by more
than an order of magnitude, then approaches
1.4 · 106 s-1 during the second localization. Such high
strains and strain rates produced during localization in
the bands have also been reported previously.[169]
A number of investigations show that a polycrystalline material with high-strain-rate sensitivity will appear
to deform by a mode of superplastic flow.[169,204] First,
the structures in the shear bands are very fine. Second,
the temperature in the bands may reach and even exceed
0.4 Tm (Tm is the melting temperature). These provide
the conditions for superplastic deformation of the
materials in the bands. Ashby and Verrall[205] have
proposed a constitutive equation to describe the superplastic flow of a material under high strain rate. They
suggested that, when polycrystalline matter is deformed
at a temperature above 0.4 Tm, one possible mode of
superplastic flow is a ‘‘diffusion-accommodated flow.’’
Dodd and Bai[202] have pointed out that, in the process
of machining, although the average strain rate may be
quite low, the strain rate in these narrow bands of shear
may be markedly higher. Murr et al.[206] have also
suggested that the shearing deformation actually
achieved inside an adiabatic shear band is extremely
large, with shear strains as large as 10, and that the
mechanism by which this large strain is achieved
involves DRX and superplastic flow by the sliding of
submicron, equiaxed recrystallized grains. Indeed, it has
been proposed that the extensive plastic deformation
undergone by shaped charges is connected to the
nanocrystalline grain structure generated by the deformation of the liner.[221]
J. Dislocation Structure within the Bands
Because the shear bands are so thin (micrometers or
fractions thereof in width), it is usually difficult to
prepare the specimens allowing the direct observation of
the microstructure by TEM. Therefore, the information
concerning these microstructure modifications obtained
by TEM is scarce,[210] and the information reported is
also conflicting.[211] The effects of shock on microstructure are well known and have been documented by
Murr,[207] among others. Lee et al.[212] have investigated
the microstructure within the shear band of HY-100
steel subjected to torsional loading using TEM, and
VOLUME 39A, APRIL 2008—831
�found that the center of the bands contains a mixture of
the highly elongated narrow subgrains and fine equiaxed
cells with a high dislocation density, and that the
misorientations of 80 pct of the random cells have the
angles of less than approximately 5 deg. They proposed
that the primary metallurgical process occurring in the
bands is dynamic recovery, resulting in both highly
elongated subgrains and more equiaxed cellular structures. Meyers and Andrade et al.[213] have found that, as
the band in the deformed specimen is approached, the
equiaxed cells are replaced by elongated cells, and that
these elongated cells inside the band break down and are
replaced by small grains with a relatively low dislocation
density. Therefore, they have attributed this kind of
microstructure observed in TEM to DRX. Figure 29 is a
typical example of a TEM structure; the details are
taken from a region within the band in the low-carbon
steel with the structure of the ferrite-cementite. Several
characteristics are noteworthy. First, the a-ferrite in the
band formed a tangled structure and the dislocation
cells. The elongation and arrangement of the cells tend
to be aligned along the shear direction, and the cell walls
are full of dense dislocations, as shown in Figure 29(a).
Second, the interfaces between the ferrite and cementite,
as the sources, could form dislocations, as shown in
Figure 29(b); the diffraction contrast analysis indicates
that the majority of dislocations are single dislocations
with Burgers vector 1/2[111] lying on a plane (1�
10) and
1/2[½1�
1�
1� lying on a plane (110). These dislocations may
interact with each other to form a stable dislocation
network (Figure 29(c)) expressed by: 1/2[111] + 1/2
½1�
1�
1� fi [100]. It might be expected that the formation
of the tangles, cells, and networks of the dislocations
Fig. 29—A set of the TEM montage, showing the dislocation structure in the low-carbon steel subjected to dynamic torsional loading:
elongated dislocation cells along the shear band and high dislocation
density at the (a) and (b) cell walls, (c) hexagonal dislocation network, and (d) avalanche of the cells.
832—VOLUME 39A, APRIL 2008
could be responsible for the work hardening of the
material in the shear bands during dynamic deformation. Third, the avalanche of the dislocation cells in the
bands is observed in a specimen that is deformed to the
point of failure, as shown in Figure 29(d). This may be
proposed to be associated with the sharp drop of the
load in the s-c response curve. Fourth, the strain
distribution is heterogeneous from place to place along
the shear band. This can be seen clearly in Figure 30,
from the comparison of the SADPs from the different
regions in the bands in a quenched steel. A relatively
simple pattern is obtained from the region A (marked by
circle A), implying that the crystallographic nature of
this area in the shear band can be explained by slip
deformation. On the other hand, in region C (marked by
circle C), it shows a spotty ring pattern, indicating that
the operation of multislip systems, arising from different
subgrains with different suborientations in the area. All
these show that strain distribution in the shear bands is
heterogeneous, because of the inhomogeneous structures at microscale. The TEM examinations within the
bands reveal the shear bands are highly localized regions
that may cross through many grains. This implies that
the shear bands are due to crystallographic slip on a
governing slip system within one grain and penetrate
into adjacent grains by cooperative slip events that may
involve a number of slip systems. This kind of cooperative slip may be assisted by the stress concentrations at
the grain boundaries. One of the interesting problems of
the localized shear band is how the shear deformation
develops from the microscopic bands in a grain into
macroscopic bands on a spatial distribution, when it
crosses the grain boundaries. Figure 31 shows a microscopic localized shear band crossing several grains with
different orientations in a low-carbon steel. The trace of
the band in grain C has a h111i direction, which
coincides with the direction of the intersection of the
thin-foil plane (1�41) with the slip plane (11�1) in grain B,
suggesting that the shear deformation passes through
the grain boundary by multi- or cross-slip systems.
Electron contrast analysis shows that the grain C
(marked by circle C), however, has the same trace as
the grain B (marked by circle B), implying that the
localized shear band propagates across the grain boundaries from one grain to the adjacent grain by single-slip
systems.
Figure 32 shows a montage with the shear-band
front in titanium. It can be seen that the tip varies in
thickness from grain to grain, and that there is some
Fig. 30—Microstructure within the shear band generated during
dynamic torsional loading in low-carbon steel.
METALLURGICAL AND MATERIALS TRANSACTIONS A
�Fig. 31—Montage of TEM micrographs, showing microscopic shear band crossing several grains by different slip modes at grain boundaries in a
low-carbon steel.
Fig. 32—Shear-band front in titanium; pictures on sides are higher magnifications.
‘‘meandering’’ before the shear band is clearly defined.
Larger magnification pictures are seen on the sides of
the main band to reveal the details of the propagating
front. The shear-band thickness as well as the intensity
METALLURGICAL AND MATERIALS TRANSACTIONS A
of localization vary from grain to grain. This is definitely
initiated by crystallographic slip on a few grains and
subsequently defines itself,[81] as these regions of deformation connect.
VOLUME 39A, APRIL 2008—833
�K. Damage and Fracture along the Shear Bands
The interrupted tests mentioned in Section II show
that the sudden drop appearing in the s-c curve, leading
to fracture, is caused by the initiation and coalescence of
the microcracks along the bands, rather than by the
formation of the shear bands. The localized shear
deformation promotes further nucleation, growth, and
coalescence of the microcracks and, therefore, accelerates the fracture of material along the bands. The degree
of structural damage in the shear bands leading to final
failure along the bands can be assessed as shown in
Figure 33. The number of cracks per square millimeter,
which is an indication of the degree of the structural
damage, was determined as a function of the distance
from the boundary between the shear bands and matrix
to the center of the band of the dual-phase steel
subjected to dynamic torsional loading. It can seen that
the nearer the center of the band, the bigger the
structural damage extent. The final break is obvious
along the shear band, as shown in Figures 34 and 35,
which indicate the fracture along the bands of Al-Li
alloy (Figure 34) and Al/SiCp composite (Figure 35),
respectively. These observations are in good agreement
with the results obtained by Hartley et al.[40] Concerning
the fracture of the materials subjected to dynamic
loading under a high strain rate, detailed discussions
were given by Rogers,[21] Meyers,[27] and Brandon;[214]
they classified the fracture induced during high-strainrate loading as either ductile or brittle in nature. Rogers
reported[21] that if the fracture is ductile, it almost
certainly occurred during adiabatic deformation, when
the band was hot and weak. On the other hand, brittle
fracture, which is particularly common in transformed
bands in steels, occurs subsequent to the termination
of deformation and the quenching of the hot band
by the adiabatic matrix material to form the hard,
brittle, transformed structure. However, a number of
observations of the fracture surface by SEM reveal that,
whether the fracture occurs along the deformed type
bands in quenched martensite steels[44] or the whiteshear bands in Ti-55 alloys[215] and Al-Li alloys,[77] their
fracture topographies appeared to be of ductility characterized by the shear dimples on the fracture surface, as
demonstrated in Figure 36. Guduru et al.[141] similarly
obtained the classic inclined dimple pattern in a fractured shear band in maraging steel, confirming that the
fracture is ductile and occurs inside of the band while it
is at a high temperature.
Fig. 34—Fracturing along the shear bands in Al-Li alloy subjected
to dynamic impact compression.
Fig. 35—Fracturing along the shear bands in Al/SiCp composite
alloy subjected to dynamic impact compression.
Fig. 33—The relationship between the number of the cracks per
square millimeter and the distance from the boundary of the band to
the matrix in the shear band, in low-carbon steel.
834—VOLUME 39A, APRIL 2008
Fig. 36—Fracture surface morphologies observed in the deformed
bands in Ti-6Al-4V alloy: (a) quenched-martensite steel, (b) in the
white-etching bands in Al-Li alloy and (c) titanium alloy, and (d)
subjected to dynamic loading under high strain rate.
METALLURGICAL AND MATERIALS TRANSACTIONS A
�This sequence is shown in Figure 37(b). As they grow,
they eventually coalesce, forming a crack.
Zhou et al.[218] measured the velocity of propagation of
shear bands in a Ti6Al4V alloy impacted at a velocity of
50 m/s. Their propagation velocities were 50 to 75 m/s.
Xue et al.[217] used the TWC method, which had an
initial wall velocity of 200 m/s and obtained a propagation velocity of 556 m/s, inferred from their experimental results. This great difference can be explained
through Mercier and MolinariÕs[219] analysis: the
imposed velocity C determines the shear-band velocity
V through the equation
� �
rf
kt
V¼
g
½11�
qC h h
where rf is the material flow stress and g is a function of
k/h, the normalized process zone length, and t/h,
the normalized shear-band thickness. Figure 38 shows
the effect of flow stress on the velocity of propagation
of the shear band. Two experimental points are given:
one for Ti and one for Ti6Al4V, with a flow stress
approximately triple the one for pure Ti. There is a
linear relationship between flow stress and V, for the
same external conditions and g. The experimental results
by Xue et al.[217] compare well with the Mercier–
Molinari predictions.
L. Spacing and Self-Organization of Shear Bands
Collective organization processes take place during
the formation of shear bands. Most of the current
theories on prediction of spacing of shear bands are
based on the analysis of a single shear band along its
propagating direction. The theories by Grady and
Kipp,[86] Wright and Ockendon,[88] and Molinari[89]
are presented in the companion paper in these proceedings by Walley.[224] The three equations are given in
Table III. We describe briefly below the evolution of
multiple adiabatic shear bands in commercially pure
titanium and Ti-6Al-4V alloy through the radial collapse technique of a thick-walled cylinder under highstrain-rate deformation (experimental configuration
Veloc ity of Shear Ban d (m /s )
It is known that the fracture surface morphology of
the quenched steel should be cleavage or quasi-cleavage.[216] However, there are no cleaved faces or other
brittle features to be observed on the fracture surface in
this steel, particularly in the case of the quenched steels.
The materials in the bands subjected to a large accumulated strain under a high strain rate, resulting in a
temperature rise, seem to suffer an annealing or temper
treatment, leading to structural softening. Therefore, the
fracture morphology in the quenched steel deformed at
a high strain rate and large strain appears to be similar
to those in the annealed or tempered steels; thus, it is
reasonable to propose that, in addition to the stress state
condition, the temperature rise within the band plays an
important role in the failure of materials along the shear
bands, as mentioned by Rogers.[21] The temperature rise
in the shear band is so high that it can cause recrystallization or even melting, leading to softening of the
material in comparison with that in the adjacent matrix.
Timothy and Hutchings assumed[34] that the void
formation in adiabatic shear bands in titanium alloys
was intimately associated with the thermal softening and
local melting of the metal in the shear bands. So, this is
the reason that, in all cases, the fracture surface
topography observed is entirely of a ductile nature,
irrespective of whether it is occurring in the deformed or
white-etching shear bands in quenched and tempered
steels.
Figure 37 shows voids that nucleated and grew inside
the shear bands in Ti-6Al-4V. If, subsequent to void
nucleation, there is some tension, these voids grow until
their edges reach the boundary of the shear band. Then
they do not grow into the surrounding material, because
of its higher yield strength. The voids become gradually
ellipsoidal, as they elongate along the shear bands.
600
500
400
300
200
Predicted Curve
Experimental
Results
100
0
0
200
400
600
800
1000 1200 1400 1600
Flow Stress (MPa)
Fig. 37—(a) Ductile fracture inside shear band in Ti and (b) schematic representation of sequence of events leading to ductile failure.
METALLURGICAL AND MATERIALS TRANSACTIONS A
Fig. 38—Shear-band velocity as a function of flow stress for Ti
alloys; comparison of Mercier–Molinari theory[219] with results by
Xue et al.[39]
VOLUME 39A, APRIL 2008—835
�Table III. Comparison of Theoretical Predictions for Shear Band Spacing Without Strain Hardening
Prediction
Grady–Kipp Model
Spacing
2p
h
kC
c_ 30 a2 s0
i1=4
�
Wright–Ockendon Model
h
i1=4
2p c_ 3kC
�m3=4
2
a s0
91=4
p
0
shown in Figure 1(c). Shear-band initiation, propagation,
as well as spatial distribution were examined under
increasing global strains. As an illustration, Figure 39(a)
shows the pattern of helicoidal shear bands in a Ti-6Al-4V
specimen, whereas Figure 39(b) shows the size and
spatial distribution of these bands at a global effective
strain of 0.264. The shear bands nucleate at the internal
boundary of the specimens and construct a periodical
distribution at an early stage. The shear bands undergo
Molinari Model
h
i1=4 h 3
i1=4
m ð1�aT 0 Þ2
�
2p c_ 3kC
2
ð
1þm
Þ
s0 a
0
bifurcation as they progress in their spiral trajectory and
as their spacing increases. The shear bands are favored
initiation sites for failure, which occurs by void nucleation, growth, and coalescence inside the thermally
softened regions. The evolution of the morphology of
the voids is determined by the restrictions imposed by
the bands. Figure 40 shows that the shear-band spacing
is quite dependent on the material, being much lower in
304 stainless steel than in the Ti-6Al-4 V. The differences
of mechanical response between the two alloys are
responsible for significant differences in the evolution of
the shear band patterns. The same differences are
observed between titanium and Ti-6Al-4V. Figure 41
shows how the shear-band spacing and its evolution
determines the fragmentation of a cylindrical specimen.
The number of shear bands initiated in Ti (spacing
(a) Shear band pattern, N=68
Length of Shear Bands (mm) I i
5.0
4.0
3.0
2.0
1.0
0.0
0
5
10
15
20
25
Position (mm)
30
X
35
40
i
(b) Spatial distribution
Fig. 39—Shear-band pattern of Ti-6Al-4V alloy at well developed
stage eeff = 0.264.
836—VOLUME 39A, APRIL 2008
Fig. 40—Comparison of spacings for stainless steel (a) and Ti-6Al-4V
alloy (b) at initial stage.
METALLURGICAL AND MATERIALS TRANSACTIONS A
�for nucleation, a mean nucleation strain, and a Weibull modulus. There can also be shielding at the
nucleation stage, depending on the relative values of
the rate of nucleation and rate of growth.
(b) Rate of growth, or velocity of propagation. This is
an important factor in their self organization. Shear
bands compete among themselves and gradually
change their patterns. A ‘‘Darwinian’’ natural selection takes place, and a large number of small bands
evolve gradually into a smaller number of large
bands, due to the shielding of stresses produced during growth. Such evolution of shear band pattern
occurs under a homogeneously distributed pressure
acting on the external boundary of the cylindrical
specimen. This is a typical self-organization. This is
schematically rendered in Figures 42 and 43.
Fig. 41—Evolution of shear band pattern in Ti-6Al-4V alloy.
of 0.18 mm) is considerably larger than in Ti-6%
Al-4%V (spacing of 0.53 mm). The experimentally
obtained shear-band spacings are compared with theoretical predictions by Grady and Kipp,[86] Wright and
Ockendon,[88] and Molinari[89] in Table IV. The shearband interactions are more complex than previously
thought and their spacing cannot be predicted by the
one-dimensional perturbation theories of Wright and
Ockendon[88] and Molinari.[89] The Grady–Kipp theory
cannot accommodate the increased spacing as the shearband size increases, since it is also one-dimensional. This
was done by Xu et al.[61,62] Thus, the treatment needs to
incorporate elements that are outlined below:
This theory was developed by Xue et al.[61,62] and
applied to Ti, Ti6Al4V, and 304 SS. It clearly needs
additional work.
It is indeed interesting that shear-band spacing plays a
role in deformation of metallic glasses. Indeed, Conner
et al.[225] measured the spacing in quasistatic bending of
a Zr based BMG and found it to be ~0.1 mm initially.
Eventually a few shear bands grow and dominate the
process as in the case of dynamic deformation.
IV.
(a) Rate of nucleation of shear bands. The probability
of nucleation, p(v0, s0), in a reference volume v0,
or surface s0 was successfully described by a Weibull
distribution in which the stress was replaced by
strain as the independent variable. Parameters
defining the distribution are a critical strain
CONCLUSIONS
From the results presented in the previous sections,
the following useful conclusions can be made:
1. The initiation of the shear localized band occurs
with a crystallographic slip in a favored individual
grain which then propagates into the adjacent
Table IV. Predictions and Experimental Results for Stainless Steel and Titanium
Spacing (mm)
Exp. Data Initial Level
Exp. Data Developed
LWO (mm)
LGK (mm)
LMO (mm)
SS 304L
CP Titanium
0.12
0.69
3.2
2.57
0.17
0.52
2.62
3.3
0.16
0.36
S1 = 0
S2 > S1
S3 >> S2
t0
t1
v0
v1
v2
t2
t3
embryos
deactivated embryos
activated embryos
Fig. 42—Two-dimensional representation of concurrent nucleation and shielding. S is a shielding parameter; as S increases, the release of stress
produced by growing shear band deactivates embryos. For S=0, all embryos are activated and shear-band spacing is small. For large value of
shielding S3, (right hand side) only a fraction of embryos are activated.
METALLURGICAL AND MATERIALS TRANSACTIONS A
VOLUME 39A, APRIL 2008—837
�L4
Lengt h, l i
t4
5.
t3
L3
t2
L2
6.
t1
Spatial Distribution
Spacing For Propagating Shear Bands
(a)
L4
L3
L2
7.
Length of Propagating Shear Bands, l
(b)
Fig. 43—(a) Schematic diagram of the evolution of shear band spacing at different levels. t1-Random initiation; t2-self organization into
‘‘periodic’’ pattern among nuclei; t3-some shear bands grow faster
suppressing others; t4-self organization of developed shear bands. (b)
Spacing of propagating SBs as a function of length.
grains by cooperative slip or cross-slip, leading to
spread of shear localization over the total crosssection of the deformed specimen, eventually propagating to a macroscopic shear band.
2. There is a critical shear strain required for shearband formation at a specific strain rate. In other
words, in addition to a critical strain, a critical
strain rate is also required for the formation of the
shear band. This is supported by the experimental
results Ti and Al-Li alloys.
3. Deformed and ÔtransformedÕ shear bands are proposed to form at different deformation stages during localization. The deformed bands form first.
ÔTransformedÕ bands have a white etching coloration in optical microscopy, most probably due to
the small scale of the grain structure generated. It is
proposed that ÔtransformedÕ bands indeed the result
of recrystallization in the structure.
4. Phase transformations have been observed in the
shear bands in Ti-6Al-4V alloy and 304 stainless
steel as well as Fe-Ni-Cr monocrystals during
838—VOLUME 39A, APRIL 2008
8.
explosive collapsed testing, and the phase transformation products have a certain crystallographic
orientation relationship with their parent matrix.
The sharp drop in the load-carrying capability on
the shear stress-strain response for the deformed
specimen seems to be closely associated with a certain critical coalescence of the microcracks or voids
in the bands, rather than the occurrence of the
shear bands per se.
The shear deformation localization process involves
sequential conventional crystallographic and noncrystallographic deformation events within the
band, including slip and twinning in individual
grains, cooperative slip and cross-slip at grain
boundaries, strain and strain rate-hardening (dislocation reactions, cell formation, substructure generation). Added to these are special mechanisms:
softening arising from the rise of temperature in the
band, breakup of the deformation structure through
rotational dynamic recrystallization, structural damage resulting from the initiation, growth and coalescence of the cracks or voids, and finally, the
fracture along the shear bands. Figure 44 shows, in
a schematic fashion, the phenomena taking place as
a shear band forms. At the front, we have intermittent slip/twinning dependent on the grain orientation. These intermittent slip regions gradually join
up and form a deformation band which traverses
grain boundaries. As the displacement increases
(farther from front) the deformation band reorganizes itself into an ultrafine grained/recrystallized
structure.
The current observations in copper, tantalum,
brass, stainless steel, Al-Li alloy, Ti and Ti-alloys,
IF steel, and Zircaloy show that recrystallization
often occurs in the shear bands, beyond a critical
strain. The widespread evidence of the equiaxed
and distortion-free grains (obtained through TEM
observations) can be reasonably explained by a
rotational dynamic recrystallization mechanism that
may or not be followed by static grain growth,
depending on the post deformation cooling.
The microstructures observed in adiabatic shear
bands (sub micrometer equiaxed grains) are similar
the one in metals processed by severe plastic
Fig. 44—Schematic representation of shear-band front in Ti showing
three regions: intermittent slip at grain scale, deformed region, and
recrystallized/ultrafine-grained region.
METALLURGICAL AND MATERIALS TRANSACTIONS A
�deformation (SPD) methods. Therefore, it is
proposed that the grain refinement mechanism may
be the same.
9. The shear bands self organize with a spacing that is
a function of the mechanical and thermal response
of the material as well as external imposed conditions (stress state, strain rate, pressure, etc). This
spacing has been compared with predictions by
Grady and Kipp,[86] Wright and Ockendon,[88] and
Molinari.[89] The two-dimensional nature of the
process is such that the characteristic spacing changed with shear-band length. This was treated by
Xue et al.[61,62]
In summary, we present results of individual and
collaborative investigations on the microstructural
aspects of shear localization in materials under high
strain rates and also review and discuss some important
phenomena such as phase transformations, dynamic
recrystallization leading the structure from polycrystalline to nanocrystalline, possible amorphous, super-high
strain rate deformation within the band, and the
evolution process of shear localization.
V.
RECOMMENDED AREAS FOR FURTHER
INVESTIGATION
The study of shear bands, entering its seventh decade,
will still yield original and novel results, since a number
of the scientific questions have not been satisfactorily
answered to this day. We indicate below some of the
areas that would be worthwhile of scientific inquiry. The
overview by Rosakis and Ravichandran[228] on this
complements the recommendations below.
1. Advanced sample preparation and characterization
tools will significantly accelerate our understanding
of shear bands. As we mentioned earlier, there is
difficulty in preparing the samples for TEM and Xray examination, and therefore the information
from TEM and X-ray examination presented here is
still limited. For a better understanding of the shear
banding, the measurement and systematic observations of the microstructures need to be pursued further. The focused ion beam (FIB) technique can
play an important role in this endeavor.
2. Shear localization under quasistatic and dynamic
loading conditions in bulk metallic glasses. Is the
shear band propagation a dynamic event even if
loading is static? The release of the elastic energy
stored in system is, in this case, the driving energy.
There are two views on the softening mechanism
leading to localization: thermal softening, observed
by Lewandowski and Greer[3] and free volume
coalescence softening, proposed by Spaepen.[232]
Dai et al.[233] and Liu et al.[234] performed experiments and calculations that indicate that both
mechanisms are operative in the Zr41.2Ti13.8
Cu12.5Be22.5 bulk metallic glasses.
3. The Nix freezup hypothesis: Nix[230] observed
that the shear bands in metallic glasses loaded
METALLURGICAL AND MATERIALS TRANSACTIONS A
quasistatically propagate a certain distance and
then stop. Figure 45 shows a sequence of events.
A shear band initiates at the surface of specimen
(Figure 45(b)), and propagates at a velocity V1.
The thermally softened region has a length a1. As
the band propagates down (Figure 45(c)), the
region away from the band cools down and can
ÔfreezeÕ back. This reduces the driving energy for
the band and reduces the length of the softened
region to a2. Thus, one would expect an associated
reduction in propagation velocity to V2. This
velocity is reduced to zero in Figure 45(d), when
the softened region length reaches a critical size a3.
4. Real-time experimental examination of the twodimensional deformation in propagating shear
bands: This has two components:
(a) Propagation velocity as a function of applied
stress. The experiments developed by Zhou,
Ravichandran and Rosakis[218] reveal an extremely important characteristic of shear bands:
their propagation velocity. More systematic
experimentation is needed to understand how
the velocity is related to the constitutive
response in metals and alloys. Is it possible to
develop a generalized theory? Is the MercierMolinari[219] theory applicable over a broad
spectrum?
(b) The temperature rise plays a key role in the formation of the shear bands, but has not been
determined precisely at present.
5. Shear band propagation in multiaxial loading. The
experiments described herein use three techniques
Fig. 45—Schematic sequence showing how a shear band initiates,
propagates, and arrests in a bulk metallic glass subjected to quasistatic compression.
VOLUME 39A, APRIL 2008—839
�6.
7.
8.
9.
10.
11.
12.
providing three stress states. Nevertheless, there
was no attempt to systematically vary the stress
state. This area needs systematic investigation.
Experimental results by Meyer[231] indicate that
small variations in stress state have a significant
effect on the initiation strain for localization. The
effect of hydrostatic stresses needs to be established, since shear bands grow during high pressure
dynamic events.
Thermal softening at high rates. The microstructural changes that are well documented undoubtedly affect the thermal softening. However, the
exact nature of this softening is virtually unknown.
As shown by Eq. [10] (linearized assumption), the
thickness and spacing of bands (Table III) are
directly dependent on this softening. The constitutive approach by Molinari and Ravichandran[227]
might be a good effort in that direction.
Amorphization within shear bands. The preliminary report by Meyers et al.[63] needs to be confirmed.
A better understanding of the rate sensitivity of
work hardening is needed for improved constitutive description. The Los Alamos MTS model
pioneered by Kocks and coworkers[226] incorporates this effect through a dislocation evolution
term, but the physical basis needs experimental
verification.
The ultrafine grain size within the shear bands:
what are the contributions of rotational recrystallization, post-deformation recrystallization and
grain growth processes on the recovered microstructure?
Although this review has focused primarily on single localized shear band, in many cases, multibands, and even large and complex network of
bands occur. The self-organization of bands is a
new topic of study requiring both experimental
and theoretical investigations. Further experimental investigation is needed in order to provide the
modeling of such complicated behavior.
Many alloys (steels, titanium and aluminum
alloys) that undergo dynamic strain aging are
also prone to shear localization.[229] What is the
effect of the changes in thermal softening and
strain-rate sensitivity on the development of shear
bands?
Both shear-band bifurcation and the development
of a quantitative treatment of a shear band toughness (initially proposed by Grady[220]) are desirable
and necessary areas of research.
Finally, although there is rather good relation
between theoretical analyses and experimental results,
the experimental data that can be directly compared
with these analyses to verify and guide model development of shear localization are still scarce. Materials
researchers need to provide clear descriptions of the
nano/micro/mesostructural evolution, thus enabling
Mechanicians performing theoretical analyses to arrive
at more complete constitutive descriptions. Mechanics
840—VOLUME 39A, APRIL 2008
and Materials researchers should come together more
often to accelerate the understanding of the phenomena.
ACKNOWLEDGMENTS
This research supported by the National Natural
Science Foundation of China Grant No. 50071064,
19891180-2 and 19392300; by The Chinese Academy
of Sciences under Special Grant 87-52: by the US
Army Research Office MURI programs at UCSD in
the 1988-1998 period; by the US National Science
Foundation Division of Engineering (Institute for
Mechanics and Materials). Collaborations and discussions with former students and colleagues, Drs. Z.C.
Li, T.W. Wright, W.L. Zhong, J.Q. Yu, Y.J. Chen,
Q. Xue, J.C. La Salvia, X.L. Huang, G.T. Gray,
D. Kong, H. Li, Q. Xue, E. Cerreta, B. Kad, M. Ehlers,
U.R. Andrade, J.H. Beatty, T. Perez-Prado, L.
Wittman, Profs. V.F. Nesterenko, L.W. Meyer, K.S.
Vecchio, Q. Li, T. Shen, Z. Ling, J.H. Zhang, G.
Subhash, and Z.G. Wang are greatly appreciated. Professor G. Ravichandran generously contributed to the
last section on suggested areas for future research and
shared his wisdom with the authors. Especially,
Dr. W.L. Zhong, Dr. J.Q. Yu, Dr. Z.C. Li, Dr. E.
Cerreta, Dr. B. Kad, and Profs. Q. Li and K.S.
Vecchio have joined this joint program and provided a
number of micrographs and experimental data for this
paper. Their contributions to this project are gratefully
acknowledged. The photographs were taken by TEM
and HREM in the State Key Laboratory of Fatigue
and Fracture for Materials, Atomic Image Laboratory
of the Chinese Academy of Sciences, Oak Ridge
National Laboratory, and UCSD Electron Microscopy
Center.
REFERENCES
1. C. Zener and J.H. Hollomon: J. Appl. Phys., 1944, vol. 15, p. 22.
2. H. Tresca: Proc. Inst. Mech. Eng., 1878, vol. 30, pp. 301–45.
3. J.J. Lewandowski and A.L. Greer: Nat. Mater., 2006, vol. 5,
pp. 15–18.
4. D. Jia, K.T. Ramesh, and E. Ma: Acta Mater., 2003, vol. 51,
pp. 3495–3509.
5. Q. Wei, L. Kecskes, T. Liao, K.T. Hartwig, K.T. Ramesh, and
E. Ma: Acta Mater., 2004, vol. 52, pp. 1859–69.
6. R.F. Recht: J. Appl. Mech., 1964, vol. 31, p. 189.
7. R.S. Culver: in Metallurgical Effects at High Strain Rates,
R.W. Rohde, B.M. Butcher, J.R. Holland, and C.H. Karnes,
eds., Plenum Press, New York, NY, 1973, p. 519.
8. R.J. Clifton: Material Response to Ultra-High Loading Rates,
Report NMAB-356, National Advisory Board Committee,
Washington, DC, 1980, ch. 8.
9. Y.L. Bai: in Shock-Waves and High-Strain-Rate Phenomena,
L.E. Murr and M.A. Meyers, eds., Plenum Press, New York,
NY, 1981, p. 277.
10. T.J. Burns and T.G. Trucano: Mech. Mater., 1982, vol. 1, p. 313.
11. J. Pan: Int. J. Solid Struct., 1983, vol. 19, p. 153.
12. S.L. Semiatin, M.R. Staker, and J.J. Jonas: Acta Metall., 1984,
vol. 32, p. 1347.
13. F.H. Wu and L.B. Freund: J. Mech. Phys. Solids, 1984, vol. 32,
p. 119.
14. T.W. Wright and R.C. Batra: J. Phys., 1985, vol. C5 (45), p. 323.
METALLURGICAL AND MATERIALS TRANSACTIONS A
�15. C. Fressengeas and A. Molinari: J. Mech. Phys. Solids, 1987,
vol. 35, p. 185.
16. J.R. Johnson: J. Eng. Mater. Technol., 1981, vol. 103, p. 201.
17. D.A. Drew and J.E. Flaherty: in Phase Transformation and
Material Instabilities in Solids, M.E. Gurtin, ed., Academic
Press, Orlando, FL, 1984, p. 37.
18. J. Lemonds and A. Needleman: Mech. Mater., 1986, vol. 5, p. 339.
19. V. Tvergaard: J. Mech. Phys. Solids, 1987, vol. 35, p. 43.
20. P.M. Anderson, N.A. Fleck, and K.L. Johnson: J. Mech. Phys.
Solids, 1990, vol. 38, p. 681.
21. H.C. Rogers: Annu. Rev. Mater. Sci., 1979, vol. 9, p. 283.
22. H.C. Rogers: in Material Behavior under High Stress and Ultra
High Loading Rates, J. Mescall and V. Weiss, eds., Plenum Press,
New York, NY, 1983, p. 101.
23. M Stelly and R. Dormeval: in Metallurgical Applications of
Shock Waves and High-Strain-Rate Phenomena, L.E. Murr, K.P.
Staudhammer and M.A. Meyers, eds., Marcel Dekker, New
York, NY, 1986, p. 60.
24. S.P. Timothy: Acta Mater., 1987, vol. 35, p. 301.
25. L.E. Murr: in Materials at High Strain Rates, T.Z. Blazynski,
ed., Elsevier Applied Science Publishers, Essex, England, 1987,
pp. 1–45.
26. R. Dormeval: in Materials at High Strain Rates, T.Z. Blazynski,
ed., Elsevier Applied Science Publishers, Essex, England, 1987,
p. 47.
27. M.A. Meyers: in Mechanics and Materials—Fundamentals and
Linkages, M.A. Meyers, R.W. Armstrong, and H.O.K. Kirchner,
eds., John Wiley, New York, 1999, p. 14.
28. M.A. Meyers: Encyclopedia of Materials: Science and Technology,
Oxford, UK, 2001, pp. 7093–103.
29. H.A. Grebe, H.R. Park, and M.A. Meyers: Metall. Trans. A,
1985, vol. 16A, p. 761.
30. M. Stelly, J. Legrand, and R. Dormeval: in Shock Waves and
High-Strain-Rate Phenomena, L.E. Murr and M.A. Meyers, eds.,
Plenum Press, New York, NY, 1981, p. 113.
31. A. Marchand and J. Duffy: J. Mech. Phys. Solids, 1988, vol. 36,
p. 251.
32. D.A. Shockey, D.R. Curran, and P.S. De Carli: J. Appl. Phys.,
1975, vol. 46, p. 3766.
33. Y. Me-Bar and D. Shechtman: Mater. Sci. Eng., 1983, vol. 58,
p. 181.
34. S.P. Timothy and I.M. Hutchings: Mater. Sci. Technol., 1985,
vol. 1, p. 526.
35. M.A. Meyers and H.-R. Pak: Acta Metall., 1986, vol. 34, p. 2493.
36. M.A. Meyers, G. Subhash, B.K. Kad, and L. Prasad: Mech.
Mater., 1994, vol. 17, p. 175.
37. M.G. da Silva and K.T. Ramesh: Mater. Sci. Eng., 1997, vol.
232, p. 11.
38. D.R. Chichili, K.T. Ramesh, and K.J. Hempker: Acta Mater.,
1998, vol. 46, p. 1025.
39. Q. Xue, M.A. Meyers, and N.F. Nesterenko: Acta Mater., 2002,
vol. 50, p. 575.
40. K.A. Hartley, J. Duffy, and R.H. Hawley: J. Mech. Phys. Solids,
1987, vol. 35, p. 283.
41. Y.L. Bai, Q. Xue, and Y.B. Xu: Mech. Mater., 1994, vol. 17,
p. 155.
42. Y.L. Bai, Q. Xue, Y.B. Xu, and L.T. Shen: in Metallurgical and
Materials Application of Shock Waves and High-Strain-Rate
Phenomena, L.E. Murr, K.P. Staudhammer, and M.A. Meyers,
eds., Elsevier Science, Amsterdam, 1995, p. 385.
43. Y.J. Chen, M.A. Meyers, and V.F. Nesterengo: Mater. Sci. Eng.,
1999, vol. A268, p. 70.
44. Y.B. Xu, Y.L. Bai, and L.T. Shen: Acta Metall., 1996, vol. 44,
p. 1917.
45. S.A. Manion and T.A.C. Stock: Int. J. Fract. Mech., 1970, vol. 6,
p. 106.
46. R.C. Glenn and W.C. Leslie: Metall. Trans., 1971, vol. 2,
p. 2945.
47. P.A. Thornton and F.A. Heiser: Metall. Trans., 1971, vol. 2,
p. 1496.
48. A.L. Wingrove: Metall. Trans., 1973, vol. 4, p. 1829.
49. S.A. Manion and A.L. Wingrove: J. Aust. Inst. Met., 1972,
vol. 17, p. 158.
50. R.L. Woodward and R.L. Aghan: Met. Forum., 1978, vol. 1,
p. 180.
METALLURGICAL AND MATERIALS TRANSACTIONS A
51. J.L. Derep: Acta Metall., 1987, vol. 35, p. 1245.
52. M. Stelly, J. Legrand, and R. Dormeval: in Shock-Wave and
High-Strain-Rate Phenomena in Metals, M.A. Meyers and L.E.
Murr, eds., Plenum Press, New York, NY, 1981, p. 113.
53. R.W. Wright and R.C. Batra: Proc. DYMAT 85, Int. Conf. on
Mechanical and Physical Behavior of Materials under Dynamic
Loading, Paris, Sept. 1985, Les Editions de Physique, Les Ulis,
C5–323.
54. J.H. Giovanola: Mech. Mater., 1988, vol. 7, p. 73.
55. K. Cho, Y.C. Chi, and J. Duffy: Metall. Trans. A, 1990, vol. 21A,
p. 1161.
56. S.C. Liao and J. Duffy: J. Mech. Phys. Solids, 1998, vol. 11,
p. 2201.
57. J.H. Beatty, L.W. Meyer, M.A. Meyers, and S. Nemat-Nasser:
Shock-Wave and High-Strain-Rate Phenomena in Materials,
Marcel Dekker, New York, NY, 1992, pp. 645–56.
58. Y. Meunier R. Roux, and J. Moureaud: Shock Wave and HighStrain-Rate Phenomena in Materials, M. Dekker, New York,
NY, 1992, pp. 637–44.
59. M.A. Meyers and C.L. Wittman: Metall. Trans. A, 1990,
vol. 21A, p. 3153.
60. C.L. Wittman, M.A. Meyers, and H.-R. Pak: Metall. Trans. A,
1990, vol. 21A, p. 707.
61. Q. Xue, M.A. Meyers, and N.F. Nesterenko: Acta Mater., 2002,
vol. 50, p. 575.
62. Q. Xue, M.A. Meyers, and N.F. Nesterenko: Mater. Sci. Eng.,
2004, vol. A384, p. 35.
63. M.A. Meyers, Y.B. Xu, Q. Xue, M.T. Perez-Prado, and T.R.
McNelley: Acta Mater., 2003, vol. 51, p. 1307.
64. R.C. Batra and G.M. Zhang: J. Comput. Phys., 2004, vol. 201,
p. 172.
65. D.G. Lee, Y.G. Kim, D.H. Nam, S.M. Hur, and S. Lee: Mater.
Sci. Eng., 2005, vol. A391, p. 221.
66. Q. Xue and G.T. Gray: Metall. Mater. Trans. A, 2006, vol. 37A,
p. 2447.
67. E. Cerreta, Q. Xue, and G.T. Gray: Acta Mater., 2007, vol. 55,
pp. 691–704.
68. B.K. Kad, J.-M. Gebert, M.T. Perez-Prado, M.E. Kassner, and
M.A. Meyers: Acta Mater., 2006, vol. 54, pp. 4111–27.
69. Y.L. Bai, J. Bai, H.L. Li, F.J. Ke, and M.F. Xia: Int. J. Impact
Eng, 2000, vol. 24, pp. 685–701.
70. R.W. Chen and K.S. Vecchio: J. Phys. IV, 1994, vol. C8,
pp. 459–64.
71. L. Magness: Mech. Mater., 1994, vol. 17, pp. 147–54.
72. G. Subhash, B.J. Pletka, and G. Ravichandran: Metall. Mater.
Trans. A, 1997, vol. 28A, p. 1470.
73. M.A. Meyers, Y.J. Chen, and F.D.S. Marquis: Metall. Trans.,
1995, vol. 26A, p. 2493.
74. A. Hines and K.S. Vecchio: Acta Mater., 1997, vol. 45 (2),
pp. 635–49.
75. S. Nemat-Nasser and J.B. Isaacs: Acta Mater., 1997, vol. 45,
pp. 907–19.
76. L.W. Meyer and S. Manwaring: Metallurgical Application of
Shock-Wave and High-Strain-Rate Phenomena, Marcel Dekker,
New York, NY, 1986, p. 657.
77. Y.B. Xu, W.L. Zhong, Y.J. Chen, L.T. Shen, Q. Liu, Y.L.
Bai, and M.A. Meyers: Mater. Sci. Eng., 2001, vol. A299,
p. 287.
78. C.A. Bronkhorst, E.K. Cerreta, Q. Xue, P.J. Maudlin, T.A.
Mason, and G.T. Gray III: Int. J. Plast., 2006, vol. 22, pp. 1304–
35.
79. Q. Xue, G.T. Gray III, B.L. Henrie, S.A. Maloy, and S.R. Chen:
Metall. Mater. Trans. A, 2005, vol. 36A, pp. 1471–86.
80. V.F. Nesterenko and M.P. Bondar: DYMAT J., 1994, vol. 1,
p. 243.
81. V.F. Nesterenko, M.A. Meyers, and T.W. Wright: Acta Mater.,
1998, vol. 46, p. 327.
82. Q. Xue, V.F. Nesterenko, and M.A. Meyers: Int. J. Impact Eng.,
2003, vol. 28, pp. 257–80.
83. Q. Xue, L.T. Shen, and Y.L. Bai: Rev. Sci. Instrum., 1995,
vol. 66, p. 5298.
84. Y.B. Xu and M.A. Meyers: J. Mater. Sci. Technol., 2006, vol. 22,
p. 737.
85. A. Molinari and R.J. Clifton: C.R. Acad. Sci., 1983, vol. 296,
p. 1.
VOLUME 39A, APRIL 2008—841
�86. D.E. Grady and M.E. Kipp: J. Mech. Phys. Solids, 1987, vol. 35,
p. 95.
87. S. Kuriyama and M.A. Meyers: Metall. Trans. A, 1986, vol. 17A,
p. 443.
88. T.W. Wright and H. Ockendon: Int. J. Plast., 1996, vol. 12,
p. 927.
89. A. Molinari: J. Mech. Phys. Solids, 1997, vol. 45, p. 1551.
90. R.J. Clifton, J. Duffy, K.A. Hartley, and T.G. Shawki: Scripta
Metall., 1984, vol. 18, p. 443.
91. Y.L. Bai, C. Cheng, and S.B. Yu: Acta Mech. Sinica., 1986,
vol. 2, p. 1.
92. T.W. Wright and R.C. Batra: Adiabatic Shear Bands in Simple
and Dipolar Plastic Materials, Proc. IUTAM Symp. on Macroand Micro-Mechanics of High Velocity Deformation and Fracture, K. Kawata J. Shioiri, eds., Springer, Berlin, 1987, p. 189.
93. T.G. Shawki and R.J. Clifton: Mech. Mater., 1989, vol. 8, p. 13.
94. D. Xing, Y.L. Bai, C.M. Chen, and X.L. Huang: J. Mech. Phys.
Solids, 1991, vol. 39, p. 1017.
95. S.C. Liao and J. Duffy: J. Mech. Phys. Solids, 1998, vol. 46,
p. 2201.
96. M.E. Backman, S.A. Finnegan, J.C. Shulz, and J.K. Pringle: in
Metallurgical Applications of Shock-Wave and High-Strain-Rate
Phenomena, L.E. Murr, K.P. Staudhammer and M.A. Meyers,
eds., Marcel Dekker, New York, NY, 1986, p. 675.
97. Y.L. Bai: in Mech. Proc. Materials at High Rates of Strain,
J. Harding, ed., JOP Publishing, Bristol, 1989, p. 99.
98. B. Dodd and Y.L. Bai: Ductile Fracture and Ductility with
Application to Metalworking, Academic Press, London, 1987.
99. L. Anand, O. Dillon, T.A. Place, and B.F. Von Turkovich: Int.
J. Plast., 1990, vol. 6 (2).
100. L.S. Costin, E.E. Crisman, R.H. Hartley, and J. Duffy: Proc. 2nd
Conf. on Mechanical Properties at High Rates of Starin,
J. Harding, ed., Institute of Physics, London, 1979, p. 90.
101. K.A. Hartley, J. Duffy, and R.H. Hawley: J. Mech. Phys. Solids,
1987, vol. 35, p. 283.
102. A. Marchand and J. Duffy: J. Mech. Phys. Solids, 1988, vol. 36,
p. 59.
103. J.H. Giovanola: Mech. Mater., 1988, vol. 7, p. 59.
104. R. Dormeval: in Materials at High Strain Rates, T.Z. Blazynski,
ed., Elsevier Applied Science, New York, NY, 1987, p. 71.
105. Y.L. Bai, C.M. Cheng, and Y.S. Ding: Res. Mech., 1987, vol. 22,
p. 313.
106. G..B. Olson, J.F. Mescall, and M. Azrin: in Shock-Wave and
High-Strain-Rate Phenomena, L.E. Murr and M.A. Meyers, eds.,
Plenum Press, New York, NY, 1981, p. 221.
107. M.R. Staker: Acta Metall., 1981, vol. 29, p. 633.
108. S.L. Semiatin and G.D. Lahoti: in Material Behavior under High
Stress and Ultra-High Loading Rates, J. Mescall and V. Weiss,
eds., Plenum Press, New York, NY, 1983, p. 119.
109. F.H. Wu and L.B. Freund: J. Mech. Phys. Solids, 1987, vol. 32,
p. 185.
110. M.E. Backman and S.A. Finnegan: in Metallurgical Effects
at High Strain Rates, R.W. Rohde, B.M. Butcher, J.R.
Holland, and C.H. Karnes, eds., Plenum Press, New York,
NY, 1973, p. 531.
111. A.J. Bedford, A.L. Wingrove, and K.R.L. Thompson: J. Aust.
Inst. Met., 1974, vol. 19, p. 61.
112. S.P. Timothy and J.M. Hutchings: Proc. 3rd Int. Conf. on
Mechanical Properties at High Rates of Strain, J. Harding, ed.,
Institute of Physics, Bristol, 1984, p. 397.
113. A. Molinari: in Nonlinear Phenomena in Material Sciences
Solid State Phenomena, G. Martin and L.P. Kubin, eds.,
Trans Tech Publications, Aedermannsdorf, Switzerland, 1988,
vol. 3–4, pp. 447–68.
114. T.W. Wright: The Physics and Mathematics of Shear Bands,
Cambridge University Press, UK, 2002.
115. A.K. Zurek: Metall. Mater. Trans. A, 1994, vol. 25A, p. 2483.
116. Y.L. Bai: J. Mech. Phys. Solids, 1982, vol. 30, p. 195.
117. Y.B. Xu, L. Liu, J.Q. Yu, L.T. Shen, and Y.L. Bai: Mater. Sci.
Technol., 2000, vol. 16, p. 609.
118. Q. Li, Y.B. Xu, and M.N. Bassim: J. Mater. Process. Technol.,
2004, vol. 155, p. 1889.
119. H.C. Rogers and C.V. Shastry: in Shock-Wave and High-StrainRate Phenomena in Metals, M.A. Meyers and L.E. Murr, eds.,
Plenum Press, New York, NY, 1981, p. 285.
842—VOLUME 39A, APRIL 2008
120. E.M. Trent: JISI, 1941, vol. 143, p. 401.
121. W.E. Carrington and M.L.V. Gayler: Proc. R. Soc. London,
1948, vol. A194, p. 323.
122. J.H. Andrews, H. Lee, and L. Bourne: JISI, 1950, vol. 165,
p. 374.
123. N.C. Welsh: J. Appl. Phys., 1957, vol. 28, p. 960.
124. H.O. McIntire and G.K. Manning: Met. Prog., 1958, Nov, p. 94.
125. E. Rabinowicz: Friction and Wear of Materials, Wiley, New
York, NY, 1965, p. 86.
126. D. Scott, B. Loy, and G.H. Mills: Inst. Mech. Eng. Proc., 1966–
67, vol. 181, p. 30.
127. K. Nakajima and Y. Mizutani: Wear, 1969, vol. 13, p. 283.
128. J.V. Craig and T.A.C. Stock: J. Aust. Inst. Met., 1970, vol. 15,
p. 1.
129. T.A.C. Stock and A.L. Wingrove: J. Mech. Eng. Sci., 1971,
vol. 13, p. 110.
130. A.L. Wingrove: J. Aust. Inst. Met., 1971, vol. 16, p. 67.
131. S.J. Manganello and K.H. Abbott: J. Mater., 1972, vol. 7, p. 231.
132. T.S. Eyre and A. Baxter: Metall. Mater., 1972, vol. 6, p. 435.
133. A.L. Wingrove and G. Wulf: J. Aust. Inst. Met., 1973, vol. 18,
p. 167.
134. S.P. Timothy and I.M. Hutchings: Acta Metall., 1985, vol. 33,
p. 667.
135. R.E. Winter: Philos. Mag., 1975, vol. 31, p. 765.
136. M. Zhou, A.J. Rosakis, and G. Ravichandran: J. Mech. Phys.
Solids, 1996, vol. 44, p. 981.
137. M. Zhou, G. Ravichandran, and A.J. Rosakis: J. Mech. Phys.
Solids, 1996, vol. 44, p. 1007.
138. Y.B. Xu and M.A. Meyers: J. Mater. Sci. Technol., 2003, vol. 19,
p. 385.
139. J.L. Derep: Acta Metall., 1987, vol. 35, p. 1245.
140. E.E. Crisman, J. Duffy, and Y.C. Chi: Proc. ASME Symp. on
Exp. Techn. in Micromechanics, W.N. Sharpe, Jr., ed., AIME,
New York, NY, 1989, p. 163.
141. P.R. Guduru, A.J. Rosakis, and G. Ravichandran: Mech.
Mater., 2001, vol. 33, p. 371.
142. J. Duffy and Y.C. Chi: Mater. Sci. Eng., 1992, vol. A157, p. 195.
143. C.O. Mgbokwere, S.R. Nutt, and J. Duffy: Mech. Mater., 1994,
vol. 17, p. 97.
144. S.P. Timothy: Acta Mater., 1987, vol. 35, p. 301.
145. C.Z. Duan: Doctoral Thesis, Dalian University of Technology,
Dalian, China, 2004.
146. Y.B. Xu, J.H. Zhang, and M.A. Meyers: Dynamic Recrystallization in the Shear Bands of Fe-Cr-Ni Monocrystal: Electron
Backscatter Diffraction Characterization, unpublished research.
147. K.P. Staudhammer, C.E. Frantz, S.S. Hecker, and L.E. Murr:
Shock-Wave and High-Strain-Rate Phenomena in Metals and
Alloys, Addison Dekker, New York, NY, 1981, p. 91.
148. L.E. Murr and M.F. Ross: Philos. Mag., 1968, vol. 18, p. 281.
149. H.J. Kestenbach and M.A. Meyers: Metall. Trans. A, 1976, vol.
7A, p. 1943.
150. G.B. Olson and M. Cohen: Metall. Trans. A, 1976, vol. 7A,
p. 1897.
151. M.A. Meyers, B.Y. Cao, V.F. Nesterenko, D. Benson, and Y.B.
Xu: Metall. Mater. Trans. A, 2004, vol. 35A, p. 2575.
152. M.G. Mendiratta, A.K. Chakrabarti, and J.A. Roberson:
Metall. Trans., 1974, vol. 5, p. 1949.
153. G. Lutjering and S. Weissmann: Acta Mater., 1970, vol. 18, p. 785.
154. D. Li and X. Wan: Acta Metall. Sinica, 1984, vol. 20, p. 375.
155. C.E. Shamblen: Metall. Trans., 1972, vol. 2, p. 277.
156. L.S. Costin, E.E. Crisman, R.H. Hawley, and J. Duffy: 2nd Conf.
on the Mechanical Properties of Materials at High Rates of
Strain, J. Harding, ed., The Institute of Physics; J. Eng. Mater.
Technol., 1979, vol. 101, p. 258.
157. T. Shawki, R.J. Clifton, and G. Majda: Brown University
Report ARO DAAG29-81-K-012/3, Brown University, Providence, RI, 1983.
158. K.A. Hartley, J. Duffy, and R.H. Hawley: J. Mech. Phys. Solids,
1987, vol. 35, p. 283.
159. Y.B. Xu, X. Wang, Z.G. Wang, L.M. Luo, and Y.L. Bai: Scripta
Mater., 1990, vol. 24, p. 571.
160. Y.B. Xu, Y.L. Bai L.T. Shen, and Q. Xue: in Metallurgical and
Materials Application of Shock-Waves and High-Strain-Rate
Phenomena, L.E. Murr, K.P. Staudhammer, and M.A. Meyers,
eds., Elsevier Science, Amsterdam, 1995, p. 389.
METALLURGICAL AND MATERIALS TRANSACTIONS A
�161. Y.B. Xu, Z.G. Wang, X.L. Huang, D. Xing, and Y.L. Bai:
Mater. Sci. Eng., 1989, vol. A114, p. 81.
162. Y.B. Xu, Z. Ling, X. Wu, and Y.L. Bai: J. Mater. Sci. Technol.,
2002, vol. 18, p. 504.
163. S. Lee, K.M. Cho, K.C. Kim, and W.B. Choi: Metall. Trans. A,
1993, vol. 24A, p. 895.
164. K. Cho, S. Lee, Y.W. Chang, and J. Duffy: Metall.Trans. A,
1991, vol. 22A, p. 367.
165. Z. Ling: J. Compos. Mater., 2000, vol. 34, p. 101.
166. Z. Ling, L. Luo, and B. Dodd: J. Phys. III, vol. 4, 1994, p. 453.
167. M. Zhou: Int. J. Plast., 1998, vol. 14, p. 733.
168. L.H. Dai, Z. Ling, and Y.L. Bai: Scripta Mater., 1999, vol. 41,
p. 2452.
169. C.C. Koch, O.B. Cavin, C.G. McKamey, and J.O. Scarbrough:
Appl. Phys. Lett., 1983, vol. 43, p. 1017.
170. R.B. Schultz and C.C. Koch: Appl. Phys. Lett., 1986, vol. 49,
p. 146.
171. E. Hellstern and L. Schultz: Mater. Sci. Eng., 1988, vol. 97, p. 39.
172. A.W. Weeber and H. Bakker: Physica B, 1998, vol. 153, p. 93.
173. A.Y. Yermakov, Y.Y. Yurchikov, and V.A. Barinov: Phys. Met.
Metall., 1981, vol. 52, p. 50.
174. C. Politis and W.L. Johnson: J. Appl. Phys., 1986, vol. 60,
p. 1147.
175. E. Gaffet and M. Harmelin: J. Less Common Met., 1990,
vol. 157, p. 201.
176. L. Schultz: J. Less Common Met., 1988, vol. 145, p. 233.
177. C.M. Glass, G.M. Moss, and S.K. Golaski: in Response of
Metals to High Velocity Deformation, P. Shewmon and V.F.
Zackay, eds., AIME, New York, NY, 1961, p. 115.
178. C. Mataya, M.J. Carr, and G. Krauss: Metall. Trans. A, 1982,
vol. 13A, p. 1263.
179. Q. Li, Y.B. Xu, Z.H. Lai, Y.L. Bai, and L.T. Shen: J. Mater. Sci.
Technol., 1999, vol. 15, p. 435.
180. J.F.C. Lins, H.R.Z. Sandim, H.-J. Kestenbach, D. Raabe, and
K.S. Vecchio: Mater. Sci. Eng. A, 2007, vol. 457, pp. 205–11.
181. U. Andrade, M.A. Meyers, K.S. Vecchio, and A.H. Chokshi:
Acta Metall., 1994, vol. 42, p. 3183.
182. J.A. Hines and K.S. Vecchio: in Metallurgical and Materials
Applications of Shock-Wave and High-Strain-Rate Phenomena,
L.E. Murr, K. Staudhammer, and M.A. Meyers, eds., Elsevier
Science, Amsterdam, 1995, p. 421.
183. L.E. Murr, C.-S. Niou, S. Pappu, J.M. Rivas, and S.A.
Quinones: Phys. Status Solidi (a), 1995, vol. 149, p. 253.
184. J.A. Hines, K.S. Vecchio, and S. Ahzi: Metall. Mater. Trans. A,
1998, vol. A29, p. 191.
185. S. Pappu, C.S. Niou, C. Kennedy, L.E. Murr, L. DuPlessis, and
M.A. Meyers: in Metallurgical and Materials Applications of
Shock-Wave and High-Strain-Rate Phenomena,. L.E. Murr, K.
Staudhammer, and M.A. Meyers, eds., Elsevier Science, Amsterdam, 1995, p. 495.
186. L.E. Murr, C.S. Niou, and C. Feng: Scripta Metall., 1994,
vol. 34, p. 297.
187. V.F. Nesterenko, M.A. Meyers, J.C. LaSalvia, M.P. Bondar,
Y.J. Chen, and Y.L. Lukyanov: Mater. Sci. Eng., 1997, vol.
A229, p. 23.
188. M.A. Meyers, V.F. Nesterenko, J.C. LaSalvia, Y.B. Xu, and Q.
Xue: J. Phys. IV, 2000, vol. 19, p. 9.
189. Q. Li, Y.B. Xu, Z.H. Lai, L.T. Shen, and Y.L. Bai: Mater. Sci.
Eng., 2000, vol. A276, p. 250.
190. M.A. Meyers, J.C. LaSalvia, V.F. Nesterenko, Y.J. Chen, and
B.K. Kad: in Recrystallization and Related Phenomena, Rex Ô96,
T.R. McNelley, ed., Monterey, CA, 1997, pp. 27–29.
191. K. Cho, S. Lee, S.R. Nutt, and J. Duffy: Acta Mater., 1993,
vol. 41, p. 923.
192. B. Derby: Acta Metall. Mater., 1991, vol. 39, p. 955.
193. J. Hynes, K.S. Vecchio, and S. Ahzi: Metall. Mater. Trans. A,
1998, vol. 29A, p. 191.
194. J.D. Campbell, J.A. Simmons, and J.E. Dorn: J. Appl. Mech.,
1961, vol. 28, p. 447.
195. H.J. Frost and M.F. Ashby: Deformation Mechanism Maps,
Pergamon, Oxford, United Kingdom, 1982, p. 26.
METALLURGICAL AND MATERIALS TRANSACTIONS A
196. Q. Li: Post-D Research Report, Institute of Metal Research,
Chinese Academy of Sciences, Shenyang, China, 1999, pp. 47–48.
197. J.G.. Sevillano, P. van Houtte, and E. Aernoudt: Prog. Mater
Sci., 1981, vol. 25, pp. 69–199.
198. D.A. Hughes and N. Hansen: Acta Mater., 1997, vol. 45, p. 3871.
199. D.A. Hughes, R.A. Lebensohn, H.R. Wenk, and A. Kumar:
Proc. R. Soc. London, Ser. A, 2000, vol. 456, p. 921.
200. F.J. Humphreys and M. Hatherly: Recrystallization and Related
Annealing Phenomena, Pergamon, Oxford, United Kingdom,
1995.
201. M.E. Kassner and M.T. Peres Prado: Fundamentals of Creep in
Metals and Alloys, Elsevier, New York, 2004.
202. B. Dodd and Y.L. Bai: Mater. Sci. Eng., 1989, vol. 5, p. 557.
203. P.G. Shewmon: Diffusion in Solids, 2nd ed., TMS-AIME,
Warrendale, PA, 1989, p. 3.
204. A.W. Weeber and H. Bakker: Physica B, 1998, vol. 153, p. 95.
205. M.F. Ashby and R.A. Verrall: Acta Metall., 1973, vol. 21, p. 149.
206. L.E. Murr, E.A. Trillo, S. Pappu, and C. Kennedy: J. Mater.
Sci., 2002, vol. 37, p. 3337.
207. L.E. Murr: in Materials at High Strain Rates, T.E. Blazynski,
ed., Elsevier Applied Science, New York, NY, 1987, p. 1.
208. M.A. Meyers, V.F. Nesterenko, J.C. LaSalvia, and Q. Xue:
Mater. Sci. Eng., 2001, vol. A317, p. 204.
209. L.E. Murr: Interfacial Phenomena in Metals and Alloys, AddisonWesley, New York, NY, 1975.
210. R. Dormeval: in Shock-Wave and High Strain Rates in Metals,
M.A. Meyers and L.E. Murr, eds., Plenum Press, New York,
NY, 1981, p. 49.
211. A.J. Bedford, A.L. Wingrove, and K.R.L. Rhompson: J. Aust.
Inst. Met., 1974, vol. 19, p. 61.
212. S. Lee, K.-M. Cho, C.S. Lee, and W.Y. Choo: Metall. Mater.
Trans. A, 1993, vol. 24A, p. 2217.
213. M.A. Meyers, U.R. Andrade, and A.H. Chokshi: Metall. Mater.
Trans. A, 1995, vol. 26A, p. 2881.
214. D.G. Brandon: in Materials at High Strain Rates, T.E. Blazynski, ed., Elsevier Applied Science, New York, NY, 1987, p. 187.
215. J.Q. Yu: MasterÕs Thesis, Institute of Metal Research, Chinese
Academy of Sciences, Shenyang, China, 1999.
216. Z.F. Zhang and Y.B. Xu: Acta Mater. Sinica, 1986, vol. 21,
p. 384.
217. Q. Xue and G.T. Gray: Metall. Mater. Trans. A, 2006, vol. 37A,
p. 2447.
218. M. Zhou, A.J. Rosakis, and G. Ravichandran: J. Mech. Phys.
Solids, 1996, vol. 44, p. 981.
219. S. Mercier and A. Molinari: J. Mech. Phys. Solids, 1998, vol. 46,
p. 1463.
220. E. Grady: Mech. Mater., 1994, vol. 17, p. 289.
221. A.H. Chokshi and M.A. Meyers: Scripta Metall., 1990, vol. 24,
pp. 605–10.
222. A. Mishra, B.K. Kad, F. Gregori, and M.A. Meyers: Acta
Mater., 2007, vol. 55, p. 13.
223. H.S. Kim, D.H. Joo, M.H. Kim, S.K. Hwang, S.I. Kwun, and
S.W. Chae: Mater. Sci. Technol., 2003, vol. 19, p. 403.
224. S. Walley: Metall. Mater. Trans. A, 2007, vol. 38, pp. 2629–54.
225. R.D. Conner, Y. Li, W.D. Nix, and W.L. Johnson: Acta Mater.,
2004, vol. 52, pp. 2429–34.
226. U.F. Kocks and H. Mecking: Prog. Mater. Sci., 2003, vol. 48,
pp. 171–273.
227. A. Molinari and G. Ravichandran: Mech. Matls., 2005, vol. 37,
pp. 737–52.
228. A. Rosakis and G. Ravichandran: Int. J. Sol. Struct., 2000,
vol. 37, pp. 331–3348.
229. A. Molinari, E.A. Olevsky and M.A. Meyers: unpublished results,
2007.
230. W.D. Nix: personal communication, 2006.
231. L.W. Meyer: personal communication, 2007.
232. F. Spaepen: Acta Metal., 1977, vol. 25, p. 407.
233. L.F. Liu, L.H. Dai, Y.L. Bai, and B.C. Wei: J. Non-Cryst. Solids,
2005, vol. 351, pp. 3259–70.
234. L.H. Dai, M. Yan, L.F. Liu, and Y.L. Bai: Appl. Phys. Lett.,
2005, vol. 87, pp. 141916-1–4.
VOLUME 39A, APRIL 2008—843
�
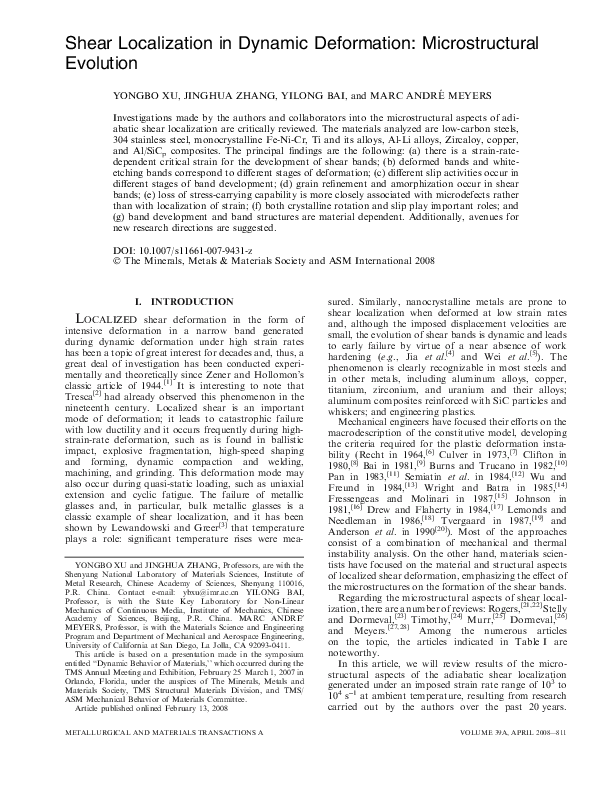
 Marc Meyers