American Journal of Clinical Medicine Research, 2014, Vol. 2, No. 1, 36-42
Available online at http://pubs.sciepub.com/ajcmr/2/1/9
© Science and Education Publishing
DOI:10.12691/ajcmr-2-1-9
Study of Effect of High-Flux Versus Low-Flux Dialysis
Membranes on Parathyroid Hormone
Ahmed Rabie El Arbagy1, Mahmoud Abd El Aziz Koura1, Abd El Samad Sobhy Abou El Nasr2, Hany Said
Elbarbary1,*
1
Departments of Internal Medicine, Faculty of Medicine, Menoufia University, Menoufia, Egypt
2
Internal Medicine Department, Benha teaching hospital, Qalyobia, Egypt
*Corresponding author: hanyelbarbary2004@yahoo.com
Received January 23, 2014; Revised February 07, 2014; Accepted February 16, 2014
Abstract Objective: Investigate the influence of permeability of low-flux versus high-flux dialysis membranes
on intact PTH during hemodialysis. Background: Hyperparathyroidism is a common finding in patients with renal
insufficiency and parathyroid hormone (PTH) is considered a uremic toxin responsible for many of the abnormalities
of the uremic state and bone disease. Materials and Methods: Forty adult patients on regular hemodialysis were
enrolled in a prospective study. Low-flux polysulfone membranes were used for at least 6 months and then the
patients were switched to use high-flux polysulfone membranes for 1 month. Serum electrolytes and intact PTH
before and after dialysis were compared before and after changes in dialysis membrane. Results: At the end of the 1month use of high-flux filters, predialysis intact PTH level (415.96 ± 226.72 ng/dL) showed a significant decline (P
< 0.05) compared to the predialysis intact PTH (312.28 ± 191.98 ng/dL) with low-flux membranes. Intact PTH level
correlated negatively with serum calcium and positively with serum phosphorus levels only in the predialysis
samples with the use of low-flux but not high-flux filters. Conclusion: High-flux dialysis membranes are more
efficient in removal of intact PTH, one of the middle-sized uremic toxins, than low-flux membranes.
Keywords: Parathyroid hormone, ESRD, hemodialysis membrane
Cite This Article: Ahmed Rabie El Arbagy, Mahmoud Abd El Aziz Koura, Abd El Samad Sobhy Abou El
Nasr, and Hany Said Elbarbary, “Study of Effect of High-Flux Versus Low-Flux Dialysis Membranes on
Parathyroid Hormone.” American Journal of Clinical Medicine Research, vol. 2, no. 1 (2014): 36-42. doi:
10.12691/ajcmr-2-1-9.
1. Introduction
While a number of therapies and technologies have
been reported to increase health-related quality of life in
patients with chronic kidney failure, patients report that
they remain substantially burdened by limited physical
functioning and by dialysis-related symptoms [1].
Health-related quality of life has been associated with
nutritional outcomes, hospitalizations, and survival in
patients with End-stage renal disease (ESRD).Quality of
life in ESRD patients on dialysis is also dependent on the
quality of dialysis [2].
Three general types of dialysis membranes are available
at present: unmodified cellulose (low flux; namely
“bioincompatible” membranes), modified/regenerated
cellulose (low flux or high flux; namely, “relatively
biocompatible”), and synthetic (low flux or high flux;
namely “relatively biocompatible”) [3].
The choice of a dialysis membrane should take into
account the following: biocompatibility of the material
towards leucocytes and complement activation; blood
volume priming requirement, which is membrane area
related; and permeability, determined in the simplest way
by two characteristics of hydraulic permeability and
molecular permeability determined at least by molecular
weight of the molecule considered [4].
Uremic toxins are classified into 3 groups: small (< 500
Da) water soluble molecules such as urea, sodium, and
phosphate, which are rapidly produced in intracellular
compartment and are efficiently removed by most filters;
middle-sized (500 to 40 000 Da) water soluble molecules
such as β2-microglobulin, parathyroid hormone (PTH),
some cytokines (interleukin-6 and tumor necrotizing
factor) that require optimized filter design and convection
for removal; and small (< 500 Da) but protein bound
molecules which are poorly removed with traditional
dialysis [5].
In fact low-flux membranes do not remove middlesized molecule toxin but highly permeable membranes are
efficient in removal of both small non-protein bound and
middle-sized uremic toxins [4].
Hyperparathyroidism is a common finding in patients
with renal insufficiency. Calcitriol deficiency and
phosphate retention together with hypocalcemia are the
main factors involved in the pathogenesis of secondary
hyperparathyroidism [6].
During hemodialysis, there is a decrease in serum PTH
levels caused by the influx of calcium from the dialysate
to blood. At the same time, during the first one to two
hours of hemodialysis, there is a decrease in serum
American Journal of Clinical Medicine Research
phosphate that potentially could directly affect PTH
secretion [7].
Parathyroid hormone in haemodialysis patients is
affected by ionized calcium and dialysis membrane and
also by the use of calcium-containing phosphate binders
and vitamin D analogues which both have been shown to
suppress PTH release and improve the related bone
disease [8]. The aim of our study was to investigate the
influence of permeability of low-flux versus high-flux
dialysis membranes on intact PTH during hemodialysis.
2. Patients and Methods
This study was conducted on 40 adult patients who
present with end stage renal disease and under regular
hemodialysis in Hemodialysis Unit, Benha Teaching
Hospital, Qalyobia, Egypt during the period from January
2013 to August 2013. They were 20 males and 20 females.
All patients with minimum dialysis duration of 6 months
were included. Patients who had parathyroidectomy with
or without replacement therapy were excluded.
All patients were on conventional hemodialysis, 4-hour
session, 3 times per week using hemodialysis machine
(Fresenius Medical Care 4008B) with low flux
polysulfone filters (Fresinius F6). The standard dialysis
bath consisted of sodium, 103 mEq/L; potassium, 2
mEq/L; calcium, 1.75 mEq/L; and bicarbonate, 35 mEq/L.
All patients were switched to high flux polysulfone filters
(F6) for one month duration without changing any of the
other dialysis prescription parameters (except for
ultrafiltration to reach their optimal dry weight). Dry body
weight was defined as the postdialysis body weight below
which the patients developed symptomatic hypotension or
muscle cramps in the absence of edema).
Patients were clinically evaluated; serum electrolytes
and intact PTH before and after dialysis were compared
before and after changing the dialysis membrane.
Moreover, the doses of vitamin D analogues or phosphate
binders were kept constant through the study. Then
samples were taken before and after session.
2.1. Sampling
Samples were collected from AV fistula into tubes at
room temperature and centrifuged within 1 hour. The
serum was stored at -70°C prior to analysis.
2.2. Methods
•
•
•
•
Blood Urea.
Serum Creatinine: (modified rate Jaffe method).
Complete blood count.
Total Serum Calcium was measured according to
Arsenazo Method (Farrell, 1984).
37
• Serum inorganic phosphorus was measured by
phosphomolybdate complex method (Fraser et al,
1987).
• Serum sodium and potassium were measured.
• Human parathyroid hormone (hPTH):
The DIA source hPTH-EASIA (DIA source hPTHEASIA Kit, Rue du Bosquet, Belgium), is a solid phase
Enzyme Amplified Sensitivity Immunoassay performed
on microtiter plates. Calibrators and samples react with
the capture polyclonal antibodies (PAb, goat anti 1-34
PTH fragment) coated on microtiter well. After incubation,
the excess of antigen is removed by washing.
• Then monoclonal antibodies (MAb, mouse anti 44-68
PTH fragment) labeled with horseradish peroxidase
(HRP) are added. After an incubation period
allowing the formation of a sandwich, the microtiter
plate is washed to remove unbound enzyme labelled
antibody. Bound enzyme-labelled antibody is
measured through a chromogenic reaction.
• The chromogenic solution (TMB) is added and
incubated. The reaction is stopped with the addition
of Stop Solution and the microtiter plate is then read
at the appropriate wavelength. The amount of
substrate turnover is determined colourimetrically by
measuring the absorbance, which is proportional to
the PTH concentration.
• A calibration curve is plotted and PTH concentration
in samples is determined by interpolation from the
calibration curve.
• Serum Albumin was assayed according to
Bromocresol Green Method (Burtis and Ashwood,
1986).
2.2.1. Statistical Methodology
The data collected were tabulated & analyzed by SPSS
(statistical package for the social science software)
statistical package version 20 on IBM compatible
computer.
Qualitative data were expressed in number (No),
percentage (%) and Quantitative data were expressed as
mean & standard deviation (X ± SD) and analyzed by
applying student t test for comparison of two groups of
normally distributed data and two groups of not normally
distributed data Mann-Whitney Test.
For comparison between the normally distributed
quantitative data at interval for the same group paired
samples t test was applied while for not normally
distributed data by applying Wilcoxon Signed Test.
Pearson correlation was used for normally distributed
quantitative variables, while Spearman correlation was
used for not normally distributed quantitative variables or
when one of the variables is qualitative.
Table 1. Sociodemographic characteristics of the studied patients
Value (n = 40)
Sociodemographic characteristics:
Age (years):
Range
46.50 - 66.00
Mean ± SD
51.69 ± 3.73
NO.
%
Male
20
50.0
female
20
50.0
Gender:
38
American Journal of Clinical Medicine Research
and potassium at the end of the 1-month after the use of
high-flux filters (Table 4). The predialysis values reflected
the real patient status rather than immediate postdialysis
values reflecting the permeability coefficient of the
dialyzer membrane.
3. Results
Sociodemographic characteristics of the studied
patients are shown in Table 1 and Table 2. There were
highly significant decreases in predialysis BUN, sodium,
Table 2. Distributions of patients according to cause of ESRD
CAUSE
Frequency
%
DM
15
37.5
Hypertension
12
30
Glomerulonephritis
6
15
Obstructive uropathy
4
10
Polycystic kidney
3
7.5
ESRD indicates end-stage renal disease and DM indicates diabetes mellitus
Table 3. Comparison between predialysis and postdialysis mean arterial blood pressure for patients with low flux and high flux dialysis
membranes
Mean arterial blood pressure
Predialysis (mean ± SD)
Postdialysis (mean ± SD)
Paired samples T test
P value
Low flux (n = 40)
111.63 ± 8.00
109.01 ± 7.01
1.89
0.06 NS
High flux (n = 40)
107.8 ± 8.14
103.30 ± 4.37
3.08
0.002 S
Table 4. Comparison between predialysis PTH, serum electrolytes, creatinine, Albumin, BUN and Haemoglobin for patients with low flux and
high flux dialysis membranes
Dialysis membrane
PTH, serum electrolytes, creatinine, Albumin, BUN and Hg
Test of significance
P value
Low flux (n = 40)
High flux (n = 40)
PTH (pg/ml):
Range
122.00 - 1223.00
92.00 - 1026.00
Mean ± SD
415.96 ± 226.72
312.28 ± 191.98
U = 3.15
0.002
S
Range
7.50 - 11.30
7.50 - 11.00
0.79
Mean ± SD
8.49 ± 0.86
8.54 ± 0.85
Serum calcium (mg/dl):
t = 0.26
NS
Serum Phosphorus (mg/dl):
Range
5.10 - 7.30
5.10 - 6.80
Mean ± SD
6.10 ± 0.44
5.90 ± 0.39
Range
56.10 - 84.00
50.00 - 76.20
Mean ± SD
70.05 ± 7.04
63.00 ± 6.59
Range
8.00 - 11.20
8.00 - 10.70
Mean ± SD
9.60 ± 0.69
9.27 ± 0.68
Range
3.50 - 4.30
3.50 - 4.30
Mean ± SD
3.90 ± 0.19
3.85 ± 0.19
137.00 - 147.00
135.00 - 145.20
143.04 ± 2.26
140.04 ± 2.57
0.03
t = 2.12
S
BUN (mg/dl):
< 0.001
4.62
HS
Serum creatinine (g/dl):
0.04
2.08
S
Serum albumin (g/dl):
0.30
1.03
NS
Sodium (mmol/L)
Range
Mean ± SD
< 0.001
5.53
HS
Potassium (mmol/L):
Range
5.50 - 6.50
5.40 - 6.20
Mean ± SD
6.00 ± 0.26
5.80 ± 0.24
7.60 - 12.30
8.50 - 12.70
9.50 ± 1.08
10.29 ± 1.04
0.001
3.50
HS
Haemoglobin(g/dl):
Range
Mean ± SD
(t): Student t test
(U): Mann-Whitney Test
PTH: Parathyroid Hormone
BUN: Blood Urea Nitrogen
0.001
t = 3.31
HS
American Journal of Clinical Medicine Research
39
Table 5. Comparison between predialysis and postdialysis PTH, serum electrolytes, creatinine, Albumin and BUN for patients with low flux
and high flux dialysis membranes
PTH, serum electrolytes, creatinine, Albumin and BUN
Predialysis
Postdialysis
Paired samples t test
P value
Low flux (n = 40) High flux (n = 40)
(mean ± SD)
(mean ± SD)
PTH (pg/ml):
Low flux (n=40)
415.96 ± 226.72
405.75 ± 224.73
0.20
0.84 NS
High flux(n=40)
312.28 ± 191.98
216.60 ± 159.92
5.49
< 0.001 HS
Low flux
8.49 ± 0.86
8.54 ± 0.84
2.07
0.04 S
High flux
8.54 ± 0.85
8.58 ± 0.87
2.21
0.03 S
Low flux
6.10 ± 0.44
5.90 ± 0.42
2.08
0.04 S
High flux
5.90 ± 0.39
3.80 ± 0.36
138.23
< 0.001 HS
Low flux
70.05 ± 7.04
66.98 ± 2.26
2.63
0.01 S
High flux
63.00 ± 6.59
21.28 ± 2.30
60.04
< 0.001 HS
Low flux
9.60 ± 0.69
9.06 ± 1.54
2.02
0.04 S
High flux
9.27 ± 0.68
3.69 ± 0.28
72.76
< 0.001 HS
Low flux
3.89 ± 0.19
3.87 ± 0.18
0.48
0.63 NS
High flux
3.85 ± 0.19
3.80 ± 0.15
1.31
0.19 NS
Serum calcium (mg/dl):
Serum Phosphorus (mg/dl):
BUN (mg/dl):
Serum creatinine (g/dl):
Serum albumin (g/dl):
Sodium (mmol/L)
Low flux
143.04 ± 2.26
141.95 ± 2.11
2.23
0.02 S
High flux
140.04 ± 2.57
137.02 ± 1.79
11.61
< 0.001 HS
Low flux
6.00 ± 0.26
5.88 ± 0.17
2.44
0.01 S
High flux
5.80 ± 0.24
4.09 ± 0.16
74.12
< 0.001 HS
Potassium (mmol/L):
Although creatinine was efficiently removed by both
filter types, still there was a significant decline of
predialysis serum creatinine at the end of the 1 month after
the use high-flux filter (P = 0.04). On the other hand, there
was no significant change in predialysis values of serum
albumin or serum calcium after using high-flux filters
(Table 4). The mean post dialysis levels of serum calcium
were significantly higher than the predialysis levels for
both low-flux and high-flux filters (post dialysis levels,
8.54 ± 0.84 mg/dL and 8.58 ± 0.87 mg/ dL, respectively).
The mean post dialysis level of serum phosphorus showed
a significant decline than the predialysis levels in low-flux
filters and a highly significant decline than predialysis
level in high flux ones (post dialysis levels, 5.90 ± 0.42
mg/dL and 3.80 ± 0.36 mg/dL, respectively) (Table 5).
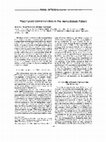
At the end of the 1-month use of high-flux filters,
predialysis intact PTH level showed a significant decline
(P = 0.002) compared to the predialysis level using lowflux filters at the start of the study (312.28 ± 191.98 pg/ml
versus 415.96 ± 226.72 pg/ml, respectively;) (Figure1).
Post dialysis levels of intact PTH showed a highly
significant decline than predialysis level after use of highflux filter but not after the use of the low-flux one (Figure
2 and Figure 3).
prediaysis PTH (pg/ml)
415.96
500
312.28
400
300
200
100
0
low flux
high flux
Figure 1. Comparison between predialysis PTH for patients with low flux and high flux dialysis membranes
40
American Journal of Clinical Medicine Research
PTH in low flux
420
415.96
415
405.75
410
405
400
Predialysis
Postdialysis
Figure 2. Comparison between predialysis and postdialysis PTH for patients with low flux dialysis membranes
PTH in high flux
400
312.28
216.6
300
200
100
0
Predialysis
Postdialysis
Figure 3. Comparison between predialysis and postdialysis PTH for patients with High flux dialysis membranes
It was found that predialysis intact PTH level correlated
negatively with levels of predialysis serum calcium and
positively with predialysis phosphorus levels while using
low-flux filter, but not after switching to high-flux
filter(Table 6, Table 7).
Table 6. Correlation coefficient (r) between Serum intact parathyroid hormone and predialysis serum electrolytes, BUN, serum creatinine and
albumin levels on low-flux dialysis membrane
low-flux dialysis membrane
Predialysis iPTH versus predialysis serum electrolytes, BUN, serum creatinine and albumin
r
P value
-0.40
0.01 S
Serum calcium (mg/dl)
0.55
< 0.001 HS
Serum Phosphorus (mg/dl)
-0.07
0.64 NS
Sodium (mmol/L)
0.22
0.15 NS
Potassium (mmol/L)
-0.01
0.93 NS
BUN (mg/dl)
-0.36
0.02 S
Serum creatinine (g/dl)
-0.20
0.21 NS
Serum albumin (g/dl)
Table 7. Correlation coefficient (r) between Serum intact parathyroid hormone and predialysis serum electrolytes, BUN, serum creatinine and
albumin levels on high-flux dialysis membrane
high-flux dialysis membrane
Predialysis iPTH versus predialysis serum electrolytes, BUN, serum creatinine and albumin
r
P value
- 0.01
0.37 NS
Serum calcium (mg/dl)
0.55
0.11 NS
Serum Phosphorus (mg/dl)
0.03
0.81 NS
Sodium (mmol/L)
0.19
0.23 NS
Potassium (mmol/L)
0.06
0.71 NS
BUN (mg/dl)
- 0.42
0.007 S
Serum creatinine (g/dl)
- 0.11
0.48 NS
Serum albumin (g/dl)
American Journal of Clinical Medicine Research
4. Discussion
Parathyroid hormone is a middle sized molecule with
molecular weight 9500 Da [10]. Hyperparathyroidism is a
common finding in patients with renal insufficiency.
Calcitriol deficiency and phosphate retention together with
hypocalcaemia are main factors involved in pathogenesis
of secondary hyperparathyroidism [6].
In our study we found postdialysis highly significant
decline of intact PTH after the use of high flux membranes,
but not after the use of low flux ones. Also at the end of
the 1-month use of high-flux filters, predialysis intact PTH
level showed a significant decline compared to the
predialysis level using low-flux filters at the start of the
study.
In a study by Makar et al (2010), on 44 pediatric
hemodialysis patients switched from low flux dialysis to
high flux dialysis for 3 months, postdialysis levels of
intact PTH were significantly lower than predialysis levels
after use of high flux filter but not after the use of the low
flux one [13].
At end of 3 months of use of high flux filters in study of
Makar et al (2010), predialysis intact PTH level showed a
highly significant decline compared to the predialysis
intact PTH with low flux membranes at the start of the
study [13].
In a study by Balducci et al (2004), different PTH
behavior during hemodialysis with different types of
dialysis membranes in 12 adult dialysis patients with
secondary hyperparathyroidism. Each HD modality lasted
2 weeks for study period of 6 weeks. The first treatment
consisted of standard bicarbonate dialysis with low flux
polysulfone, followed by acetate-free biofiltration with
high-flux-polysulfone or with polyacrylonitrile-AN69.
Intact parathyroid hormone was assayed on the blood and
dialysate samples to calculate iPTH adsorption. The
results showed that polyacrylonitrile-AN69 and high-flux
polysulfone induce a significantly larger drop in PTH
serum levels as compared with low-flux-polysulfone,
particularly in the first half of the dialysis session [12].
There was no significant change of serum albumin after
the use of high-flux filters. According to Vanholder and
colleagues, middle-sized molecules were defined as any
solute with molecular weights between 500 Da and 40 000
Da [14]. Albumin, with a molecular weight of 65 000 Da,
is considered a relatively large molecule to be filtered by
both membrane types. Another possible explanation is
hepatic overproduction or decrease anorexic agents with
amelioration of appetite.
Krieter and Canaud found that highly permeable
membranes may increase albumin loss and lead to harmful
consequences; however, they could not estimate
accurately the extent of albumin loss through highly
permeable dialysis membranes [15].
Lindsay and Spanner noted that switching from lowflux to high-flux dialysis membranes did not increase the
protein catabolic rate as previously found through using
some high-flux membranes as the AN69 dialyzer [16]
instead; a significant increase in predialysis serum
albumin levels was observed [17].
It was further postulated that this may be the result of
improved dietary intake and potential explanation
41
involving the removal of plasma substances that inhibit
appetite, such as the putative factor in uremic plasma,
leptin (16kD), and other peptides [18].
However, in the study of Makar et al, there was no
significant change of serum albumin after use of high flux
filters [13]. Also, in a study by Ayli et al, there was no
statistical significant difference between low and high flux
groups as regard albumin level [19].
In the present study, there was a highly significant
decline of serum sodium, potassium, creatinine, and BUN
levels after the use of high flux filters. Although they were
significantly removed by low flux filters for being water
soluble and with small molecular weight (eg, urea is 60
Da), still they were more efficiently eliminated by the use
of increasingly permeable high-flux dialysis membranes
with excellent blood purification. High-flux filters with
large pore sizes are efficient in removal of toxins with
medium weight, but on the other hand, other smaller
substances may be markedly decreased [15].
In our study mean arterial blood pressure declined
significantly after the use of high-flux membranes,but not
after the use of low-flux ones and this may be related to
significant ultrafiltration occurred with high flux dialyzers.
In a study by Li Y et al, on thirty patients undergoing
dialysis for at least 2 years with a low-flux dialyzer were
switched to the FX60 dialyzer for 3 years, the mean
arterial blood pressure decreased significantly after the
switch to high flux dialysis membranes [20].
In prospective crossover study was performed by
Takenaka et al, in 10 adult HD patients with low-flux and
high-flux dialyzers the mean blood pressure remained
unchanged in either state [22].
In our study there was no statistical significant
difference between use of low flux dialysis and high flux
dialysis as regard serum calcium but there was a highly
significant reduction in phosphorus level.
In a study by Ayli et al, there was no statistical
significant difference between the high flux dialyzer group
and low flux group as regard Ca but there was significant
reduction in P level [19].
In study of Makar et al, there was no statistical
significant difference between use of low flux dialysis and
high flux dialysis as regard Ca but there was statistical
significant decrease in serum P and ALP after use of high
flux dialysis compared to low flux dialysis [13].
In our study there was a highly significant increase in
the mean of hemoglobin levels from 9.50 ± 1.08 to 10.29
± 1.04 after one month of use of high flux dialysis (Pvalue: 0.001). However, in a study by Locatelli et al, on
84 adult HD patients, they found that the hemoglobin
levels increased non significantly from 9.5 ± 0.8 to 9.8 ±
1.3 g/dl in the population as a whole, with no significant
difference between the low and high flux groups (P =
0.485) [23]. Also a study by Schneider et al, after 52
weeks, the low-flux and the high-flux groups did not
differ with respect to hemoglobin (P = 0.62) [24].
The increase in Hb level in our study may be attributed
to potential benefits of high flux membranes in reduction
of erythropoietin resistance [25]. This might be related to
reduction in the level of PTH among these patients as
hyperparathyroidism is usually listed as one of possible
reasons for impaired response to recombinant human
erythropoietin (rHuEPO) in patients with renal disease
[26].
42
American Journal of Clinical Medicine Research
On the other hand PTH could interfere with endogenous
erythropoietin production [27]. PTH also enhances entry
of calcium into RBC, stimulates their Ca ATPase and
increases osmotic fragility of RBC and decreases their life
span [28].
We found that intact PTH correlated negatively with
serum calcium and positively with phosphorus only in
predialysis samples with the use of low flux and not high
flux filters. While there is an established relationship
between calcium, phosphorus, and intact PTH, this was
not found when using high flux membranes, denoting that
PTH, being a middle-sized molecule, was not only
influenced by the level of calcium and phosphorus, but
also rather removed directly through the larger pores of
high flux membranes.
[9]
[10]
[11]
[12]
[13]
[14]
[15]
5. Conclusion
[16]
High-flux dialysis membranes are more efficient than
low-flux membranes in removal of PTH, which is one of
the middle-sized uremic toxins, and they might help in
minimizing the consequences of bone disease associated
with hyperparathyroidism in patients with ESRD.
[17]
[18]
[19]
Recommendation
[20]
It is recommended to use high–flux dialysis membranes
for H.D patients with secondary hyperparathyroidism.
[21]
References
[22]
[1]
[23]
[2]
[3]
[4]
[5]
[6]
[7]
[8]
Valder rabano F, Jofre R, Lopez-Gomez JM. Quality of life in
end-stage renal disease patients. Am J Kidney Dis. 2001; 38: 44364.
Unruh M, Benz R, Greene T, et al. Effects of hemodialysis dose
and membrane flux on health-related quality of life in the HEMO
Study. Kidney Int. 2004; 66: 355-66.
Boure T, Vanholder R. Which dialyser membrane to choose?
Nephrol Dial Transplant. 2004; 19: 293-6.
Vanholder RC, Glorieux GL, De Smet RV. Back to the future:
middle molecules, high flux membranes, and optimal dialysis.
Hemodial Int. 2003; 7: 52-7.
Vanholder R, Baurmeister U, Brunet P, Cohen G, Glorieux G,
Jankowski J. A bench to bedside view of uremic toxins. J Am Soc
Nephrol. 2008; 19: 863-70.
De Francisco AL, Cobo MA, Setien MA, et al. Effect of serum
phosphate on parathyroid hormone secretion during hemodialysis.
Kidney Int. 1998; 54: 2140-5.
De Francisco AL, Amado JA, Prieto M, et al. Dialysis membranes
and PTH changes during hemodialysis in patients with secondary
hyperparathyroidism. Nephron.1994; 66: 442-6.
Morton AR, Hercz G, Coburn JW. Control of hyperphosphatemia
in chronic renal failure. Semin Dial.1990; 3: 219-23.
[24]
[25]
[26]
[27]
[28]
Farrell CE. (1984): Electrolytes. In clinical chemistry theory.
Analysis and correlation. The C.V. Mosby Company. Kaplan L.A.,
Pesce. A.J (Ed), 55, P 1054.
Fraser, Jones G, Kook SH, et al. (1987): Calcium and phosphate
metabolism. In: NWTietz, (ed), Fundanintal of clinical chemistry.
WB Saunders Company, Philadelphia, 3rd Edition, P 705-728.
Burtis CA and Ashwood ER. (1986): Tietz Text book of clinical
chemistry, W.B. Saunders, 589.
Balducci A, Coen G, Manni M, et al. In vivo assessment of intact
parathyroid hormone adsorption by different dialysis membranes
during hemodialysis, Artif Organs.2004; 28 (12): 1067-75.
Makar SH, Sawiries HK, Farid TM, et al. (2010): Effect of high
flux versus low flux dialysis membranes on parathyroid hormone.
IJKD 4: 327-32.
Vanholder R, De Smet R, Glorieux G, et al. Review on uremic
toxins: classification, concentration, and interindividual variability.
Kidney Int. 2003; 63: 1934-43.
Krieter DH, Canaud B. High permeability of dialysis membranes:
what is the limit of albumin loss? Nephrol Dial Transplant. 2003;
18: 651-4.
Lindsay RM, Spanner E. A hypothesis: the protein catabolic rate is
dependent upon the type and amount of treatment in dialyzed
uremic patients. Am J Kidney Dis. 1989; 13: 382-9.
Marcus RG, Cohl E, Uribarri J. Middle molecule clearance does
not influence protein intake in hemodialysis patients. Am J Kidney
Dis. 1998; 31: 491-4.
Bergstrom J. Mechanisms of uremic suppression of appetite. J Ren
Nutr. 1999; 9: 129-32.
Ayli M, Ayli D, Azak E, et al (2005): the effects of high-Flux
Hemodialysis on dialysis-Associated Amyloidosis, Renal Failure;
27 (1): 31-34.
Li Y, Wang Y, Lv J, et al. (2013): Clinical outcomes for
maintenance hemodialysis patients using a high-flux (FX60)
dialyzer. Ren Fail. 2013 Oct; 35 (9): 1240-5.
Velasquez MT, Albertini B, Lew SQ, et al. (1998): Equal levels of
blood pressure control in ESRD patients receiving high-efficiency
hemodialysis and conventional hemodialysis, American Journal of
Kidney Diseases; 31 (4): 618-623.
Takenaka T, Kobayashi K and Suzuki H. (2001): Warning of
high-flux hemodialysis, Ren Fail; 23 (6): 819-25.
Locatelli F, Andrull S, Pecchini F, et al. (2000): Effect of high
flux dialysis on the anaemia of haemodialysis patients, Nephrol,
Dial, Transplant, 15, 1399-1409.
Schneider A, Drechsler C, Krane V, et al. (2012): The effect of
high-flux hemodialysis on hemoglobin concentrations in patients
with CKD: Results of the MINOXIS Study, Clinical Journal of the
American Society of Nephrology, Avilable at:
http://www.mdlinx.com/ nephrology/news, last update on
Januwary17, 2012. Accessed on Febrowary 12, 2012.
Locatelli F, Vecchio LD, Andrulli S, et al. (2001): Dialysis: its
role in optimizing recombinant erythropoietin treatment. Nephrol
Dial Transplant 16 (Supp 7): 29-35.
Drueke TB and Eckardt K. Role of secondary
hyperparathyroidism in erythropoietin resistance of chronic renal
failure patients. Nephrol Dial Transplant.2002; 17 (Supp 5): 28-31.
Urena P, Eckardt KU, Sarfati E, et al. Serum erythropoietin and
erythropoiesis in primary and secondary hyperparathyroidism:
effect of parathyroidectomy. Nephron.1991; 59; 384-393.
Foulks CJ, Mills GM and Wright LF. Parathyroid hormoe and
anaemia-an erythrocyte osmotic fragility study in primary and
secondary hyperparathyroidism. Postgrad Med J.1989; 65: 136139.
Keep reading this paper — and 50 million others — with a free Academia account
Used by leading Academics

Sergio Rego
Fundação Oswaldo Cruz

Maxwell J Smith
University of Western Ontario

Timo Minssen
University of Copenhagen

Prof. Dr. İLHAN İLKILIÇ (MD PhD)
Istanbul University