Fisheries Research 107 (2011) 169–176
Contents lists available at ScienceDirect
Fisheries Research
journal homepage: www.elsevier.com/locate/fishres
A study of the population structure of the Pacific sardine Sardinops sagax (Jenyns,
1842) in Mexico based on morphometric and genetic analyses
Francisco Javier García-Rodríguez a,∗ , Silvia Alejandra García-Gasca b , José De La Cruz-Agüero a ,
Víctor Manuel Cota-Gómez a
a
Centro Interdisciplinario de Ciencias Marinas, Instituto Politécnico Nacional, Departamento de Biología Marina y Pesquerías, Colección Ictiológica, Av. Instituto Politécnico Nacional
s/n, Col. Playa Palo de Santa Rita 23096, Apdo, Postal 592, La Paz, Baja California Sur, Mexico
b
Centro de Investigación en Alimentación y Desarrollo, A.C. Av. Sábalo – Cerritos s/n, Estero del Yugo, Apdo, Postal P 711, Mazatlán, Sinaloa, Mexico
a r t i c l e
i n f o
Article history:
Received 25 April 2010
Received in revised form 4 November 2010
Accepted 4 November 2010
Keywords:
Pacific sardines
Sardinops
Mitochondrial DNA
Control region
Genetic differentiation
Morphometric analysis
Mexico
a b s t r a c t
Several studies on the Pacific sardine Sardinops sagax have focused on the identification of stock composition and boundaries, using morphometric and genetic analysis. In this study, geometric morphometric
body landmarks and control region mtDNA sequences were used to examine the population structure
of sardines along the Pacific coast of the Baja California Peninsula. Samples from commercial landings
in Ensenada (ENS), Baja California, and Bahia Magdalena (BM), Baja California Sur, were obtained during
2006–2007. The population hypotheses tested were based on the distribution of sea surface temperature
(SST) along the coast, which was previously used to define stocks. A total of 275 sardines from ENS and
119 from BM were used in morphometric analysis. Fifty-three sequences from ENS and 106 from BM were
used for genetic comparisons. Morphometric results showed differences among the three groups based
on SST, suggesting the existence of different morphotypes. Percentage of molecular variance explained
by the differences among three groups was significantly different from zero. However, the distribution of
haplotypes in the groups did not show a clear phylogeographic pattern. Additionally, mismatch distributions supported relatively similar historical demographic events in the three groups. Although evidence
of phenotypic groups along the Pacific coast of the Peninsula was found, current molecular data did not
clearly support the existence of a phylogeographically structured population.
© 2010 Elsevier B.V. All rights reserved.
1. Introduction
Biological and ecological knowledge about natural resources is
relevant for devising management strategies, especially in species
with important conservation or commercial status. The Pacific
sardine Sardinops sagax (Jenyns, 1842) is distributed from the
southeastern coast of Alaska to the northwestern coast of Mexico,
including the Gulf of California (Kramer and Smith, 1971). It is one of
the most important schooling pelagic species along the west coast
of North America and is captured in Mexico, near Ensenada, Bahia
Magdalena, and Guaymas (Lluch-Belda et al., 1986). The Pacific
sardine is a commercially valuable species. Capture records show
fluctuations over time, with a near collapse during the mid 20th
century (D.F.O., 2004).
Several studies on the Pacific sardine have focused on the identification of stocks. This is relevant because specific biological and
ecological information of each stock is used to implement harvest
strategies aimed at achieving sustainable exploitation. Stock struc-
∗ Corresponding author. Tel.: +52 612 12 25344; fax: +52 612 12 25322.
E-mail address: fjgarciar@ipn.mx (F.J. García-Rodríguez).
0165-7836/$ – see front matter © 2010 Elsevier B.V. All rights reserved.
doi:10.1016/j.fishres.2010.11.002
ture studies on the Pacific sardine in Mexican and California have
been based on various kinds of information, including tagging information (Clark, 1945) vertebral counts (Clark, 1947; Wisner, 1960),
spawning areas (Marr, 1960), blood groups (Sprague and Vrooman,
1962; Vrooman, 1964), size-at-age (Wolf and Daugherty, 1964),
morphometric data (De La Cruz-Agüero and García-Rodríguez,
2004), genetic analysis (Hedgecock et al., 1989; Lecomte et al.,
2004; Gutiérrez-Flores, 2007) and cohort analysis (Félix-Uraga
et al., 1996).
Relevant information about the movements of fish and abundances of the Pacific sardine populations was obtained from the
intensive tagging program carried out between 1936 and 1944
(Clark, 1945). This study found that fish tagged north of Bahia Sebastian Viscaino, Mexico, were caught at northern sites, supporting
the existence of only one stock with a distribution from British
Columbia to northern and central Baja California. No evidence was
found of movement toward the north of individuals tagged in Bahia
Magdalena (Clark, 1945). Studies carried out on the seasonal and
geographic distributions of larvae show that the principal spawning
areas are centered in three areas (Marr, 1960): off Central California
in April (Lynn, 2003); near Bahia Magdalena, Baja California Sur, in
summer; and in the Gulf of California in fall and winter (Aceves-
�F.J. García-Rodríguez et al. / Fisheries Research 107 (2011) 169–176
170
USA
Northern 1
zone
Table 1
Sampling sites. Data sets are grouped according to sampling site and sea surface
temperature (SST). Upper data were used for morphometric analysis. Lower data
were used for genetic analysis. Cold Ensenada (CEN), Temperate Bahia Magdalena
(TBM) and Warm Bahia Magdalena (WBM).
Sites
MEXICO
Morphometric data
Northern zone
Southern zone
Gulf of
California
Pacific
Ocean
Genetic data
Northern zone
Southern
2
zone
Southern zone
1. Ensenada (ENS)
2. Bahia Magdalena (BM)
118°
116°
114°
112°
110°
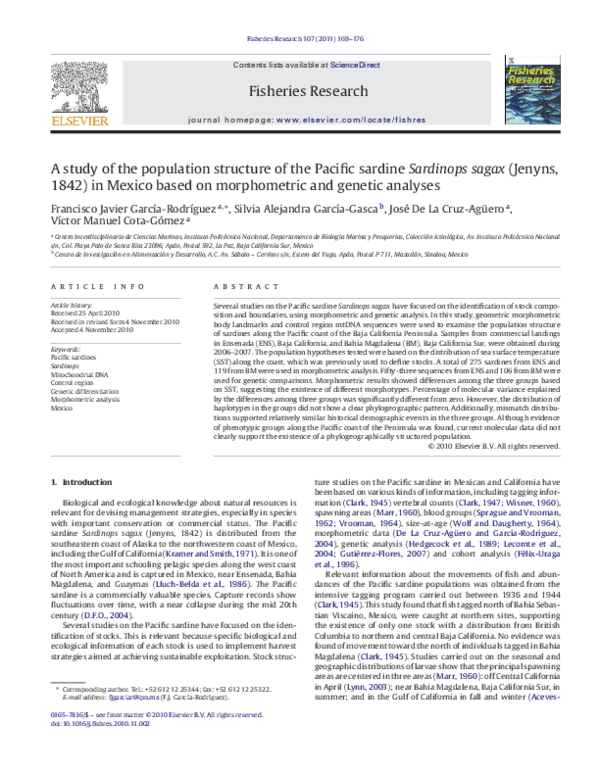
Fig. 1. Sampling sites: 1 – Ensenada (ENS) and 2 – Bahia Magdalena (BM).
Medina et al., 2004). This supports the existence of three stocks
(Smith, 2005).
In Mexico, De La Cruz-Agüero and García-Rodríguez (2004) used
multivariate morphometric analysis on sardines collected from
two sites on the western coast of the Baja California Peninsula
and found significant differences among the samples. Based on
temperature-at-catch and otolith morphometry, Félix-Uraga et al.
(2004, 2005) found evidence of three stocks of Pacific sardines ranging from Bahia Magdalena, Mexico, to San Pedro, California, USA.
These authors found evidence of three stocks: one stock was associated with cold waters (13–17 ◦ C, distributed mainly in California),
another was related to temperate waters (17–22 ◦ C, largely inhabiting the west coast of the Baja California Peninsula) and a third stock
was associated with warm waters (>22 ◦ C, concentrated mainly in
the Gulf of California). In contrast, various molecular markers indicate a lack of population differentiation (Hedgecock et al., 1989;
Lecomte et al., 2004; Gutiérrez-Flores, 2007).
The identification of stock structure is relevant to stock assessments and harvest management (Emmett et al., 2005). In this study
we compared sardines from two sites located along the west coast
of the Baja California Peninsula using two approaches: geometric morphometric and mitochondrial DNA (mtDNA) sequencing.
Two hypotheses were tested: (1) there are no significant differences between sampling zones, and (2) there are no differences
associated with sea surface temperature (SST).
Date
SST
Groups
n
Total
Jan 2007
Feb 2007
Mar 2007
Apr 2007
Jan 2007
Feb 2007
Mar 2007
Apr 2007
May 2007
15.3
15.0
15.1
15.0
22.1
20.2
19.5
18.7
18.0
CEN
CEN
CEN
CEN
WBM
TBM
TBM
TBM
TBM
104
31
82
58
30
12
33
28
16
–
Jan 2007
Feb 2007
Mar 2007
Apr 2007
Jun 2006
Aug 2006
Oct 2006
Nov 2006
Dec 2006
Jan 2007
Feb 2007
Mar 2007
Apr 2007
15.3
15.0
15.1
15.0
18.9
26.5
28.0
26.8
24.3
22.1
20.2
19.5
18.7
–
CEN
CEN
CEN
CEN
TBM
WBM
WBM
WBM
WBM
WBM
TBM
TBM
TBM
6
24
15
4
4
27
19
11
15
26
2
2
2
2
275
119
394
53
106
159
for areas near ENS and BM (Fig. 2). As suggested for stock discrimination by Félix-Uraga et al. (2004, 2005), the organization
of morphometric and genetic data sets was based on the limits of
SST: CEN (sardines from Ensenada associated with cold water),
TBM (sardines from Bahia Magdalena associated with temperate
water) and WBM (sardines from Bahia Magdalena associated with
warm water) (Table 1, Fig. 3). Although the sampling was designed
to obtain a representative number of individuals from each zone
and SST stock, logistical problems made obtaining the samples
occasionally difficult.
2.2. Morphometric analysis
The left side of each individual sardine was photographed by
the same person using a digital camera. A ruler was placed next
to each specimen to obtain scaling information. Since the landmarks alone were insufficient to achieve a good representation of
2. Material and methods
2.1. Sampling
The Pacific sardines used in the present study were collected between June 2006 and May 2007 from commercial
landings in Ensenada (ENS), Baja California (northern zone),
and Bahia Magdalena (BM), Baja California Sur (southern
zone), Mexico (Fig. 1, Table 1). Monthly SST data were
obtained from the NOAA OceanWatch-Central Pacific website
(http://oceanwatch.pifsc.noaa.gov:8080/thredds/dodsC/pfgac/)
Fig. 2. Variation in the sea surface temperature (SST) in Ensenada (line with diamond) and Bahia Magdalena (line with square) from June 2006 to May 2007.
Horizontal lines represent the stock limits according to SST previously suggested
(Félix-Uraga et al., 2005).
�F.J. García-Rodríguez et al. / Fisheries Research 107 (2011) 169–176
171
Fig. 3. Sampling zones along of the year and groups defined by zone and sea surface temperature (SST) in Ensenada and Bahia Magdalena from June 2006 to May 2007.
Dotted lines represent the stock limits previously suggested (Félix-Uraga et al., 2005).
the shape, two templates of the digital image were constructed
to provide guidelines of equal angular spacing to identify points
along the body curves using the program MakeFan (H.D. Sheets,
http://www2.canisius.edu/∼sheets/morphsoft.html). First, a template was constructed based on the landmarks at the end of the
branchiostegals rays, on the snout, and at the origin of the dorsal fin. A second template was based on landmarks located at
the origin of the anal fin, the end of the dorsal fin, and the
origin of the upper lobe of the caudal fin. Additional points (semilandmarks) were digitized at the intersection of the curve and the
lines of the templates. Thus, we constructed the digitized configurations using 18 points, 16 along the contour and two on
the side of the fish (Fig. 4) using the program TpsDig Ver 1.4
(Rohlf, 2004). A superimposition method based on generalized Procrustes analysis (GPA) was used to remove differences attributed
to the position, orientation, and scale between configurations.
Semi-landmarks were submitted to the alignment algorithm to
reduce effects of the arbitrary selection of a limited number of
points to represent the curves, using the program SemiLand6 (H.D.
Sheets, http://www2.canisius.edu/∼sheets/morphsoft.html). Once
the semi-landmarks were aligned, they were treated as points in
landmark data sets.
Partial warp scores (the contribution that each partial
warp makes to the total deformation) were obtained from
the Thin Plate Spline interpolation function using IMP programs. They were subjected to a Principal Component Analysis (PCA) and Canonical Variates Analysis (CVA) using PCAGen6n and CVAGen6m software, respectively (IIMP, H.D. Sheets,
http://www2.canisius.edu/∼sheets/morphsoft.html). We used the
Chi square procedure in the PCAGen6n program to test whether
2
1
5
4
3
6
7
8
9
18
10
11
17
16
14
13
12
15
Fig. 4. Schematic representation of the Pacific sardine showing points used for morphometric geometric analysis. Points 2, 3, 4, 5, 8, 9 and 10 were found using two
reference systems. The first was based on points 1, 6 and 16, and the second was
based on points 7, 11 and 14.
the principal components (PC) had significantly different variances (Anderson, 1958). PC significant scores were used to compare
groups using ANOVA. A matrix of the assignments was constructed
to complement previous analysis by assigning each specimen to
one of the known groups (based on the Mahalanobis distance from
the specimen to the mean value of the nearest group).
Since the CVA suggested significant differences among groups,
partial Procrustes distance means (PPDMs) were calculated to
perform paired comparisons. The significance of the test was
based on bootstrapping to determine whether the observed
F-value could have been produced by chance, taking into
account the distribution of bootstrapped F-values. This analysis was carried out using the TwoGroup6 software (IMP, H.D.
Sheets, http://www2.canisius.edu/∼sheets/morphsoft.html). Distances obtained were used to construct an unrooted tree based
on Neighbor-Joining (NJ) using Phylip Ver 3.6 (Felsenstein, 2005).
Finally, the thin-plate spline interpolating functions were used to
visualize shape changes.
2.3. Genetic analysis
Caudal fin samples were collected in 1.5 mL microtubes containing absolute ethanol and stored at −20 ◦ C until laboratory analysis.
Total DNA was isolated by taking ∼0.5 g of caudal fin and using
the “salting out” method (Miller et al., 1988). Isolated DNA was resuspended in 100 L deTE (Tris–EDTA pH 8.0). A fragment of the
control region (D-loop) of mtDNA was amplified using the primers
reported by Bowen and Grant (1997). PCR amplification was carried out in 12.5 L reactions containing 1× PCR buffer with 1.5 mM
MgCl2 (Clontech), 131.25 M of each dNTP, 0.4 M of each primer,
0.5 U Advantage Taq DNA polymerase (Clontech), and 1 L of DNA.
The PCR setup consisted of an initial denaturation step at 94 ◦ C
for 2 min, followed by 35 cycles at 94 ◦ C for 1 min, 55 ◦ C for 1 min,
and 68 ◦ C for 2 min. Amplification products were purified using the
Qiagen MiniElute kit following the instructions suggested by the
manufacturer, and sequenced using an automated DNA sequencer
(LICOR IR2 ).
Sequences were aligned and edited using the BioEdit software (Hall, 1999), which uses the ClustalW algorithm. Haplotype
and nucleotide diversity were calculated for each data set using
Arlequin 3.0 (Excoffier et al., 2005). Population genetic structure was analyzed using the Analysis of Molecular Variance
(AMOVA), which estimates the proportion of genetic variation
�F.J. García-Rodríguez et al. / Fisheries Research 107 (2011) 169–176
172
within and among populations. Information on the differences
between haplotypes for the AMOVA was obtained from a matrix
of Euclidean squared distances, and its significance was tested
using non-parametric permutation procedures as implemented in
Arlequin 3.0. Molecular pairwise ˚ST (analogous to FST ) was estimated to evaluate genetic differentiation between pairs of data
sets. ˚ST was also carried out using the Arlequin 3.0. A minimum spanning network was constructed with Network 4.2.0.1
(www.fluxusengineering.com/sharenet.htm), based on haplotype
frequencies to search for phylogeographic structure. Historical
demographies for each data set were estimated with mismatch
distributions (Rogers and Harpending, 1992) using the Arlequin
3.0. A unimodal distribution suggests rapid growth from a small
population size, while a multimodal distribution reflects long-term
population stability. The expansion model was tested using the sum
of square deviations (SSD) between the observed and the expected
mismatch. The P value was based on the number of SSD, calculated
under simulation larger or equal to the observed SSD as implemented in Arlequin 3.0.
Fig. 5. Distribution of scored frequencies obtained from the CVA in three groups.
Black circles represent sardines from the CEN group; gray circles represent sardines
from the TBM group; and white circles represent sardines from the WBM group.
Table 2
Percent population assignment based on Mahalanobis distance. Original groups are
found along rows. Cold Ensenada (CEN), Temperate Bahia Magdalena (TBM) and
Warm Bahia Magdalena (WBM).
3. Results
3.1. Morphometric analysis
We analyzed 394 sardines from the west coast of the Baja California Peninsula. A total of 275 sardines were obtained for CEN,
89 for TBM, and 30 for WBM. ANOVA of PCA scores of the three
groups based on SST showed morphometric differences. Scores of
PC1 were statistically different among groups (F = 7.641, P = 0.001).
A Tukey test indicated that WBM was statistically different from
CEN (P = 0.0003) and TBM (P = 0.006). CEN and TBM were not significantly different (P = 0.675). Scores of PC2 also were statistically
different among groups (F = 58.53, P < 0.05). The Tukey test for
the PC2 indicated that the CEN group was significantly different from the other two groups (P < 0.05). TBM and WBM scores
were not significantly different (P = 0.859). The variance explained
by the CV1 was 72% and 18% was for CV2. The two canonical
variables indicated significant differences between groups (Wilk’s
Lambda = 0.321, P < 0.05 for CV1; Wilk’s Lambda = 0.691, P < 0.05 for
CV2) (Fig. 5). Assignment based on the Mahalanobis distances indicated a high percentage of discrimination among the three groups.
The WBM morphotype showed a minor discrimination (Table 2).
Analysis based on the F-test indicated significant differences
between each paired Procrustes distances mean (PPDM) (F = 13.67,
P = 0.0011, PPDM = 0.0111, for CEN–TBM; F = 14.64, P = 0.0011,
PPDM = 0.0178, for CEN–WBM; F = 6.94, P = 0.0011, PPDM = 0.0142,
for TBM–WBM). The divergence morphometric information based
CEN
TBM
WBM
CEN
TBM
WBM
n
88.4
3.3
13.5
4.0
86.7
6.7
7.6
10.0
79.8
275
30
89
on PPDM suggested that the WBM morphotype was relatively more
different from the other two groups (Fig. 6). The morphological
changes based on partial deformation showed that sardines from
the northern zone (CEN) tended to have a less depressed shape that
those found toward the southern zone (WBM, Fig. 6).
3.2. Genetic analysis
A 500 pb fragment from the control region of mtDNA was
obtained. Twenty-four variables sites defined 146 haplotypes
among 159 specimens. This high genetic variability translated into
large values of haplotype diversity (h = 0.999). No haplotype was
shared between the two zones and the number of frequent haplotypes (those occurring in more than one individual) occurred more
in the northern zone (8) than in the southern zone (2) (Table 3).
To test congruence of our results with those suggesting three
stocks in Mexico (Félix-Uraga et al., 2004, 2005), samples were
grouped in the same manner as in the morphometric analysis,
according to both sampling sites and SST (Table 1). Six individ-
Table 3
Nucleotide substitutions for Parsimoniosus sites in Northern and Southern sampling sites based in a fragment of the control region of mtDNA. Position numbers correspond
to the site in the 500 bp sequence. Dashes represent similarities to the consensus (cons).
HAPLOTYPE
#cons
#H65
#H101
#H116
#H133
#H134
#H135
#H140
#H141
#H142
#H143
Position
111111222222223333344
366000126022366772236745
758689059529825386945752
CCTTCTGTAAGGGGGATAAGCGAG
----T-----A-------------TC-T---GG------C-GAT-------CA------------A---------A-GG--A-----GAT----CC--A--GAA------G-TA---C--CA---A-A---CGGAT------T---GGA--A----GAT---T---CAC-GA--A-G------G-------C-G------C--A-A---C-TCA-G---A-----G-TAG-
Zones
NORTH
SOUTH
4
2
3
2
2
2
2
2
2
2
�F.J. García-Rodríguez et al. / Fisheries Research 107 (2011) 169–176
173
Fig. 6. Tree of morphometric divergence and configuration means of each morphotype. Morphotype WBM was morphometrically the most different. Sardines from the
northern zone (CEN) showed a less depressed body shape than those from the southern zone (WBM). Vectors represent the direction and magnitude of deformations taking
as reference the overall mean configuration (black dots).
uals were excluded from the analysis because the sampling date
was unknown. Therefore, this genetic analysis was based on 153
sequences (47 from CEN, 33 from TBM, and 73 from WBM). All of
the excluded specimens had unique haplotypes. Nucleotide diversity was relatively larger in the CEN group and smaller in the WBM
group (Table 4).
AMOVA revealed significant genetic differences among
the three groups (˚ST = 0.02903, P < 0.001). Pairwise FST
was also significantly different between groups (P < 0.001;
˚ST (CEN–TBM) = 0.03907, ˚ST (CEN–WBM) = 0.02632, and
˚ST (TBM–WBM) = 0.02615). However, a phylogeographic pattern
from total haplotypes was not apparent, as the associations
between clades and particular groups were unclear (data not
shown).
Mismatch distributions for the three groups were unimodal
and the sudden expansion model fitted all mismatch distributions (SSD = 0.005, P = 0.058 for CEN; SSD = 0.004, P = 0.281 for TBM;
SSD = 0.003, P = 0.068 for WBM) (Fig. 7). Taking into account that
the nucleotide diversity of the control region could be 3.6 times
higher than the Cytb (Table 5), and that the divergence rate of the
Cyb can be regarded as 2% per million years (Lecomte et al., 2004),
a rough estimate of the divergence rate of the control region in
the Pacific sardine could be approximately 7.2% per million years.
Thus, considering a generational time of 4.4 years for sardines
Table 5
Genetic diversity of DNA sequences used in genetic studies of the Pacific sardine.
Mitochondrial gene
H
Reference
Cytochrome b
NAD6
NAD5
Control Region
0.89
0.94
0.96
0.99
0.0050
0.0097
0.0101
0.0182
Lecomte et al. (2004)
Gutiérrez-Flores (2007)
Gutiérrez-Flores (2007)
Present study
(Murphy, 1967; Butler et al., 1993) and the tau values (�, mutational timescale) estimated in the present study, 9.71, 9.29 and
8.64 for CEN, TBM and WBM respectively, the beginning of sudden expansion could have happened between ∼282,000 (95% CI
between 243,000 and 311,000), and ∼317,000 (95% CI between
260,000 and 362,000), years ago.
4. Discussion
Geometric and genetic analyses have been used as alternative
and robust tools for the discrimination of biological groups (De La
Cruz-Agüero and García-Rodríguez, 2004; Bowen and Grant, 1997).
A combination of both methods could provide a better understanding about the processes affecting that discrimination. In this study,
Pacific sardines from the Baja California Peninsula were compared
Table 4
Samples size (n), number of haplotypes (nh), haplotype diversity (h) and nucleotide diversity (�) and standard deviation (SD) for each SST-group. Cold Ensenada (CEN),
Temperate Bahia Magdalena (TBM) and Warm Bahia Magdalena (WBM).
Stocks
n
nh
Mean number of pairwise differences
H ± SD
� ± SD
CEN
TBM
WBM
47
33
73
38
30
73
9.35 ± 4.37
9.01 ± 4.26
8.51 ± 3.98
0.991 ± 0.0064
0.992 ± 0.0104
1.000 ± 0.0023
0.018709 ± 0.009710
0.018015 ± 0.009465
0.017029 ± 0.008828
�F.J. García-Rodríguez et al. / Fisheries Research 107 (2011) 169–176
174
200
180
160
140
120
100
80
60
40
20
0
CEN
Frequency
120
100
TBM
80
60
40
20
0
450
400
WBM
350
300
250
200
150
100
50
0
1 2
3
4
5
6
7
8
9 10 11 12 13 14 15 16 17 18 19
Number of pairwise differences
Fig. 7. Mismatch distribution from the control region for the three morphotypes.
Bars represent observed distribution and lines represent expected distribution
according to the sudden expansion model.
using geometric morphometric analysis and mtDNA sequence analysis to identify morphological and/or genetic groups.
Morphometric differences were found between individuals
from two sites (ENS–BM). Such morphotypes may be associated
with biologically distinct groups in the Mexican Pacific. This idea
has been discussed by several authors, who based their conclusions on data from several methodological tools (Clark, 1945,
1947; Marr, 1960; Wisner, 1960; Sprague and Vrooman, 1962;
Vrooman, 1964; Wolf and Daugherty, 1964; De La Cruz-Agüero
and García-Rodríguez, 2004; Félix-Uraga et al., 2004, 2005). Morphometric analysis using corporal distances revealed significant
differences between sardines from the Baja California Peninsula
(De La Cruz-Agüero and García-Rodríguez, 2004). The authors
suggested that these morphometric differences resulted from phenotypic plasticity in the Pacific sardine, considering the absence of
allozyme-frequency differences (Hedgecock et al., 1989).
Our data also indicated morphometric differences between
three groups separated by location and sea surface temperature.
Genetic analyses based on AMOVA support this result, suggesting
a genetically structured population resulting from a limited gene
flow. These findings may be explained by the heterogeneous dispersion of larvae and adults. Several studies suggest that Punta
Eugenia (28◦ N) in the Baja California Peninsula is a transition
zone that sets population boundaries for several species, including the Pacific sardine (Clark, 1947; Hubbs, 1960; Vrooman, 1964;
Valentine, 1966). This zoogeographical limit has been associated
with oceanographic processes such as the Davidson Current (a poleward flowing counter current to California current system) and
semi-permanent eddies that limit the distribution of some organisms (Hewitt, 1981).
Our results could indicate the existence of several genetic populations and suggest that previous studies based on molecular data
(Hedgecock et al., 1989; Lecomte et al., 2004; Gutiérrez-Flores,
2007) failed to discern a genetic population structure by using
mtDNA regions having less variability than the Control Region. The
high mutation rate of the control region provides more opportunity for drift to vary allele frequencies, so a more powerful analysis
can be seen here than with prior mtDNA studies too. The use of
microsatellite markers also failed to identify populations based on
SST groups (Gutiérrez-Flores, 2007). However, mtDNA has a lower
effective population size than nuclear markers, so it is expected to
be more sensitive to barriers to gene flow than the nuclear markers used previously. Lack of phylogeographical structure could be
explained because the populations are not total isolated from one
another, so that lineage sorting is not occurring.
Alternatively the differences could be related to causes other
than the existence of a structured population. According to Waples
(1998) the rejection of the null hypothesis (no population differentiation) in species with high gene flow can be associated with
the selection of the alpha level (Type I error), biologically insignificant differences, or the violation of assumptions about sampling
instead of biologically important differences. Pacific sardine populations, like those of many marine species, are challenging to define
because of their large sizes and because high levels of dispersal
produce only weak phylogeographic pattern, if at all.
Based on the above, an alternative explanation for our results
may be related to mechanisms producing “Chaotic patchiness”
(Hedgecock, 1994). This situation is related to the occurrence
of a slight but significant local or microgeographic population
structure despite a large potential for gene flow between subpopulations. It may be explained either by differential survival of fish
with particular genotypes after recruitment, or by variation in the
genetic composition of recruits. Selection along an environmental
gradient may lead to post-recruitment differences among subpopulations. Alternatively, a large variance in reproductive success
could lead to pre-recruit genetic heterogeneity. Although many
cases of chaotic genetic patchiness are described in invertebrates
animals (Larson and Julian, 1999), instances of chaotic genetic heterogeneity chaotic have been suggested from fishes, specifically
from northern anchovy Enqraulis mordax since a lack geographical pattern within of the central stock of northern anchovy was
evidenced (Hedgecock et al., 1994). Similar processes could occur
in Pacific sardine considering that both species show a relatively
similar population dynamics, associated with large expansions and
contractions of range with changes in abundance in response to
climate change (Lluch-Belda et al., 1989).
In addition, small sample sizes and the high level of genetic
diversity in the control region of mtDNA may have provided only
small amounts of statistical power. The high haplotype diversity
indicates that a much more intense sampling strategy is needed to
test for genetic differences on a small spatial scale. The high diversity found in the present study also makes it difficult to undertake
a monthly analysis due to the limited sample size. An additional
effort at increasing the amount of data in order to do a temporal
and a more geographically detailed study, and applying a sampling design based on the existing knowledge of the resource, could
strengthen the analysis of the population structure.
Analyses using other molecular markers with different mutation rates have been performed and found no evidence of genetic
population structure (Hedgecock et al., 1989; Lecomte et al., 2004;
Gutiérrez-Flores, 2007). Those results are relevant since they have
been based on molecular markers with different degrees of polymorphism (Koehn et al., 1980; Karl and Avise, 1992; Pogson et al.,
1995), as can be seen from their different mutation rates (Table 5).
�F.J. García-Rodríguez et al. / Fisheries Research 107 (2011) 169–176
The weak phylogeographic structure detected in this study may be
due to the high migratory ability of adult sardines (Clark, 1945)
and to the highly dynamic meso-scale currents in the California Current System (Maluf, 1983; Kessler, 2006), which disperses
eggs and larvae. The Pacific sardine is a multiple-batch spawner
(Torres-Villegas, 1997), thus the potential for random genetic differentiation from genetic drift may be reduced by overlapping
generations. Retention eddies, on the other hand, may localize
larvae long enough to produce both detectable morphological differences among areas and chaotic genetic structure.
The demographic history, inferred from mismatch distribution,
also suggests similar evolutionary events among the three morphotypes, although weak demographic expansion gradients were
noticed from North to South (Fig. 7). A right-shifted unimodal
mismatch distribution found toward the northern zone suggests
that the northern group represents an older demographic expansion than southern groups (see Rogers and Harpending, 1992).
Similar northern-to-southern gradients were found by Lecomte
et al. (2004).
Our results suggest that at least three morphotypes occur on
the western coast of the Baja California Peninsula, which may correspond to the three stocks proposed by Félix-Uraga et al. (2004,
2005). Moreover, the morphometric data suggest that the most
similar morphotypes were CEN and TBM. The morphotype presumably originating from the Gulf of California (WBM) showed the
greatest morphological differentiation. In agreement with previous
analyses, morphological differences may be more related to phenotypic plasticity than to the genetic variation (De La Cruz-Agüero
and García-Rodríguez, 2004). Higher discrimination of morphotype WBM, should therefore, be associated with environmental
factors in the Gulf of California. Common events caused by the California Current and other oceanographic processes may promote
the greater morphological similarity between CEN and TBM. The
results obtained from the partial warps analysis suggest an apparent morphological north-to-south pattern; individuals were more
compressed in the Gulf of California than in the Pacific.
Future analyses should be focused in the identification of
morphologic criteria to distinguish individuals of different morphotypes. Since phylogeographic structure is not clear, it is presently
not possible to support the idea of a limited gene flow of the
Pacific sardine along its distribution area. Future genetic comparisons considering samples from three different zones (northern
zone, southern zone, and Gulf of California) grouped on the limits
of SST, and larger sample sizes for comparing temporal variation
intra SST stock should clarify our results.
Acknowledgements
This study was funded by grants from the Secretaría de Investigación y Posgrado – Instituto Politécnico Nacional (SIP-20071113,
SIP-20080573 and SIP-20090333) and with the support of J.R.
Torres-Villegas. FJGR and JDA thank the grants by EDI-IPN, COFAAIPN, and SNI-CONACYT. We thank the “Colección Ictiológica”,
CICIMAR-IPN. We thank Stewart Grant for commenting on an earlier draft of the paper and three anonymous reviewers for their
valuable suggestions and criticism.
References
Aceves-Medina, G., Jimez-Rosenberg, S.P.A., Hinojosa-Medina, A., Funes-Rodriguez,
R., Saldierna-Martinez, R.J., Smith, P.E., 2004. Fish larvae assemblages in the Gulf
of California. J. Fish Biol. 65, 832–847.
Anderson, T.W., 1958. An Introduction to Multivariate Analysis. Wiley.
Bowen, B.W., Grant, W.S., 1997. Phylogeography of the sardines (Sardinops
spp.): assessing biogeographic models and population histories in temperate
upwelling zones. Evolution 51, 1601–1610.
Butler, J.L., Smith, P.E., Lo, N.C.H., 1993. The effect of natural variability of lifehistory parameters on anchovy and sardine population growth. CalCOFI Rep.
34, 104–111.
175
Clark, F.N., 1945. Results of tagging experiments in California Waters on Sardine
(Sardinops caerulea). Fish. Bull. 61, 93pp.
Clark, F.N., 1947. Analysis of populations of the Pacific sardine on the basis of vertebral counts. Fish. Bull. 65, 26pp.
D.F.O., 2004. Pacific Sardine. DFO Can. Sci. Advis. Sec. Stock Status Report 2004/037.
De La Cruz-Agüero, J., García-Rodríguez, F.J., 2004. Morphometric stock structure
of the Pacific sardine Sardinops sagax (Jenyns, 1842) off Baja California, Mexico.
In: Elewa, A.M. (Ed.), Morphometrics: Applications in Biology and Paleontology.
Springer-Verlag, New York, NY, pp. 115–124.
Emmett, R.L., Brodeur, R.D., Miller, T.D., Pool, S.S., Krutzikowsky, G.K., Bentley, P.J.,
Mccrae, J., 2005. Pacific sardine (Sardinops sagax) abundance, distribution, and
ecological relationships in the Pacific northwest. CalCOFI Rep. vol. 46, 122–
143.
Excoffier, L., Laval, G., Schneider, S., 2005. Arlequin ver 3.0: An integrated software
package for population genetics data analysis. Evol. Bioinform. Online 1, 47–
50.
Félix-Uraga, R., Alvarado, R.M., Carmona, R., 1996. The sardine fishery along the west
coast of Baja California, 1981–1994. CalCOFI Rep. 37, 188–192.
Félix-Uraga, R., Gómez-Muñoz, V.M., García-Franco, W., 2004. On the existence of
Pacific sardine groups off the West coast of Baja California and Southern California. CalCOFI Rep. 45, 146–151p.
Félix-Uraga, R., Gómez-Muñoz, V.M., Quiñonez-Velázquez, C., Melo-Barrera, F.N.,
Hill, K.T., García-Franco, W., 2005. Pacific sardine (Sardinops sagax) stock discrimination off the West coast of Baja California and Southern California using
otolith morphometry. CalCOFI Rep. 46, 113–121.
Felsenstein, J., 2005. PHYLIP (Phylogeny Inference Package) version 3.6. Distributed
by the author. Department of Genome Sciences, University of Washington, Seattle.
Gutiérrez-Flores, C., 2007. Estructura genética poblacional de la sardina del pacífico
nororiental Sardinops sagax caeruleus. Tesis de Maestría, CICESE, Ensenada, B.C,
p. 112.
Hall, T.A., 1999. BioEdit: a user-friendly biological sequences alignment edit and
analysis program for Windows 95/98/NT. Nucleic Acids Sympos. Ser. 41, 95–
98.
Hedgecock, D., 1994. Temporal and spatial genetic structure of marine animal populations in the California Current. CalCOFI Rep. 35, 73–81.
Hedgecock, D., Hutchinson, E.S., Li, G., Sly, F.L., Nelson, K., 1989. Genetic and morphometric variation in the Pacific sardine, Sardinops sagax caerulea: comparisons
and contrasts with historical data and with variability in the northern anchovy,
Engraulis mordax. U.S. Fish Bull. 87, 653–671.
Hedgecock, D., Hutchinson, E.S., Li, G., Sly, F.L., Nelson, K., 1994. The central stock
of northern anchovy (Engraulis mordax) is not a randomly mating population.
CalCOFI Rep. 35, 121–136.
Hewitt, R., 1981. Eddies and speciation in the California Current. CalCOFI Rep. XXII,
96–98.
Hubbs, C.L., 1960. The marine vertebrates of the outer coast, Symp: the biogeography
of Baja California and Adjacent Seas. Syst. Zool. 9 (3 and 4), 134–147.
Karl, S., Avise, J.C., 1992. Balancing selection at allozyme loci in oyster: implications
from nuclear RFLPs. Science 256, 100–102.
Kessler, W.S., 2006. The circulation of the eastern tropical Pacific: a review. Prog.
Oceanogr. 69, 181–217.
Koehn, R.K., Newell, R.I.E., Immerman, F.W., 1980. Maintenance of an aminopeptidase allele frequency cline by natural selection. Proc. Natl. Acad. Sci. U.S.A. 77,
5385–5389.
Kramer, D., Smith, P.E., 1971. Seasonal and geographic characteristics of fishery
resources, California current. Region VII. Pacific Sardine Com. Fish. Rev. 33 (10),
7–11.
Larson, R.J., Julian, R.M., 1999. Spatial and temporal genetic patchiness in marine
populations and their implications for fisheries management. CalCOFI Rep. 40,
94–99.
Lecomte, F., Grant, W.S., Dodson, J.J., Rodríguez-Sánchez, R., Bowen, B., 2004. Living with uncertainty: genetic imprints of climate shifts in East Pacific anchovy
(Engraulis mordax) and sardine (Sardinops sagax). Mol. Ecol. 13, 2169–2182.
Lluch-Belda, D., Crawford, R.J.M., Kawasaki, T., MacCall, A.D., Parrish, R.H., Schwartzlose, R.A., Smith, P.E., 1989. World-wide fluctuations of sardine and anchovy
stocks: the regime problem. S. Afr. J. Mar. Sci. 8, 195–205.
Lluch-Belda, D., Magallon, F.J., Schwartzlose, R.A., 1986. Large fluctuations in the sardine fishery in the Gulf of California: possible causes. CalCOFI Rep. 27, 136–140.
Lynn, R.J., 2003. Variability in the spawning habitat of Pacific sardine (Sardinops
sagax) off southern and central California. Fish. Oceanogr. 12 (3), 1–13.
Maluf, L.Y., 1983. The physical oceanography. In: Case y, T.J., Cody, M.L. (Eds.), Island
Biogeography in the Sea of Cortez. University of California Press, Los Angeles,
CA, pp. 26–44.
Marr, J.C., 1960. The causes of major variations in the catch of the Pacific sardine,
Sardinops caerulea (Girard). In: Rosa, H., Murphy, G.I. (Eds.), Proceedings of the
World Scientific meeting on the Biology of Sardines and Related Species, vol. III.
Food and Agriculture Organization of the United Nations, pp. 667–791.
Miller, S.A., Dykes, D.D., Polesky, H.F., 1988. A simple salting out procedure for
extracting DNA from human nucleated cells. Nucleic Acids Res. 16, 1215.
Murphy, G.I., 1967. Vital statistics of the Pacific sardine (Sardinops caeruea) and the
population consequences. Ecology 48, 731–736.
Pogson, G.H., Mesa, K.A., Boutilier, R.G., 1995. Genetic population structure and gene
flow in the Atlantic cod, Gadus morhua: a comparison of allozyme and nuclear
RFLP loci. Genetics 139, 375–385.
Rogers, A.R., Harpending, H., 1992. Population growth makes waves in the distribution of pairwise genetic differences. Mol. Biol. Evol. 9, 552–569.
�176
F.J. García-Rodríguez et al. / Fisheries Research 107 (2011) 169–176
Rohlf, F.J., 2004. TpsDIG Version 1.40. Department of Ecology and Evolution, State
University of New York at Stony Brook, New York.
Smith, P.E., 2005. A History for subpopulation structure in the Pacific sardine
(Sardinops sagax) population off Western North America. CalCOFI Rep. 46,
75–82p.
Sprague, L.M., Vrooman, A.M., 1962. A racial analysis of the Pacific sardine (Sardinops
caerulea), based on stidies of erythrocyte antigens. Ann. N. Y. Acad. Sci. 97,
131–138.
Torres-Villegas, J.R., 1997. La reproducción de la sardina monterrey Sardinops
caerulea (Girard, 1854) en el Noroeste de México y su relación con el ambiente.
Ph.D. thesis, Universidad Politécnica de Cataluña.
Valentine, J., 1966. Numerical analysis of marine molluscan ranges on the extratropical northeastern Pacific shelf. Limnol. Oceanogr. 11, 198–211.
Vrooman, A.M., 1964. Serologically differentiated subpopulations of the Pacific sardine, Sardinops caerulea. J. Fish. Res. Board Can. 21, 691–701.
Waples, R.S., 1998. Separating the wheat from the chaff: patterns of genetic differentiation in high gene flow species. J. Hered. 89, 438–450.
Wisner, R.L., 1960. Evidence of northward movement of stocks of Pacific sardine
based on the number of vertebrae. CalCOFI Rep. 8, 75–82.
Wolf, R., Daugherty, A.E., 1964. Age and length composition of the sardine catch off
the Pacific Coast of the United States and Mexico in 1961 and 1962. Calif. Fish
Game 50, 241–242.
�
 Alejandra García-Gasca