VOLUME 6, NO. 4, 1999
NEURAL PLASTICITY
Temporal Coding of Periodicity Pitch in the
Auditory System: An Overview
Peter Cariani
Eaton Peabody Laboratory, Massachusetts Eye and Ear Infirmary, Department of Otology and
Laryngology, Harvard Medical School Boston, Massachusetts, USA
SUMMARY
This paper outlines a taxonomy of neural pulse
codes and reviews neurophysiological evidence for
interspike interval-based representations for pitch
and timbre in the auditory nerve and cochlear
nucleus. Neural pulse codes can be divided into
channel-based codes, temporal-pattern codes, and
time-of-arrival codes. Timings of discharges in
auditory nerve fibers reflect the time structure of
acoustic waveforms, such that the interspike
intervals that are produced precisely convey
information concerning stimulus periodicities.
Population-wide inter-spike interval distributions
are constructed by summing together intervals
from the observed responses of many single Type
I auditory nerve fibers. Features in such distributions correspond closely with pitches that are
heard by human listeners. The most common allorder interval present in the auditory nerve array
almost invariably corresponds to the pitch
frequency, whereas the relative fraction of pitchrelated intervals amongst all others qualitatively
corresponds to the strength of the pitch.
Consequently, many diverse aspects of pitch
perception are explained in terms of such
temporal representations. Similar stimulus-driven
temporal discharge patterns are observed in
major neuronal populations of the cochlear
nucleus. Population-interval distributions constitute an alternative time-domain strategy for
Reprint address:
243 Charles St., Boston MA 02114 USA
fax: + 1- (617) 720-4408;
email: peter@epl.meei.harvard.edu
(C)Freund &
Pettman, U.K.
representing sensory information that complements spatially organized sensory maps. Similar
autocorrelation-like representations are possible
in other sensory systems, in which neural
discharges are time-locked to stimulus waveforms.
KEYWORDS
neural codes, interspike intervals, autocorrelation,
phase-locking, temporal correlation, sensory coding,
vowels, voice pitch, speech perception
THE NEURAL CODING PROBLEM
The neural coding problem, how populations
of neurons represent and convey information
throt/gh trains of spikes, is fundamental to our
understanding how sensory systems function
(Boring, 1942; Mountcastle, 1967; Perkell &
Bullock, 1968; Uttal, 1973; Wasserman, 1992;
Cariani, 1995; Rieke et al., 1997; Richmond &
Gawne, 1998; Gerstner, 1999). The neural coding
problem in perception involves mappings (Fig. 1)
between stimulus, neural response, and percepts,
whose biological basis can be approached from
considerations of structure, function, and
functional organization. These considerations
involve different disciplines. Psychophysics seeks
to understand the relation between stimulus and
percept. Currently most neuroscience research is
devoted to understanding the structure-function
relationship of neurons on both the molecular and
cellular levels. At the neural systems level, most
current sensory neurophysiology focuses on
understanding the relation between stimulus and
neural response (system identification). Although
147
�PETER CARIANI
148
a great deal is known about neural response
properties at many levels of the auditory system,
we do not yet have firm understandings of which
particular response properties subserve the
perceptions of auditory-form qualities, such as
pitch, timbre, consonance, and phonetic identity.
For auditory forms, solution of the neural coding
problem entails identifying which aspects of the
neural response are responsible for the perceptual
detections, discriminations, and recognitions that
can be realized by the system as a whole. In
semiotic terms, neural responses shorn of their
functional roles are signs, whereas neural codes
and representations constitute those aspects of the
neural responses that have particular functional,
informational significance. In the auditory
context, a major focus of such investigations is to
find strong psychoneural correspondences
between patterns of activity in auditory neurons
A
and the auditory percepts that invariably
accompany them. Once such correspondences are
found, then one can posit possible neural
processing strategies that can make use of such
information and look in the auditory pathway for
specific neural mechanisms that might subserve
such processing. The ultimate goal of these
efforts is to understand the biological design
principles, the functional organization of the
auditory system as an informational system, that
are essential for its perceptual and cognitive
capabilities. Neural codes, the manner in which
sensory information is represented by the system,
lie at the heart of this functional organization.
A number of biological and behavioral
constraints narrow the search for viable candidate
codes. Knowing how the system is constructed,
how the elements behave and how they are
interconnected, places strong constraints on how
EXPERIMENTAL
NEUROSCIENCE
Structure
PSYCHOPHYSICS
Function
FUNCTIONAL
NEUROSCIENCE
Functional Organization
B
Psychophysics
STIMULUS
"..
System Identification
Neurophysiological
’ps
PERCEPT
ychophysiology
/Neural coding
NEURAL
RESPONSE
Fig. 1" Structure, function, and functional organization in the nervous system. Mappings between stimulus, neural responses,
and their related percepts.
�TEMPORAL CODING IN THE AUDITORY SYSTEM
the system can handle information. Neuroanatomy supplies us with the interconnections,
neurophysiology with the response properties of
the parts, and molecular and cellular neuroscience
with more detailed understanding of their
operation. Similarly, knowing what perceptual
functions the system can and cannot perform
imposes a different set of functional constraints.
Here information-theoretic approaches have been
used to quantify how much information about the
stimulus can be extracted from neural responses
under particular coding schemes (Bialek et al.,
1991; Rieke et al., 1997; Richmond & Gawne,
1998). Decision-theoretic approaches have been
used to test how well neural information
represented via particular coding schemes
covaries with perceptual capabilities (Siebert,
1968; Siebert, 1970; Srulovicz & Goldstein,
1977; Delgutte, 1995). For example, decisiontheoretic criteria can use the high precisions of
perceptual discriminations that the system can
perform under challenging conditions to narrow
down the field of candidate codes. Potential codes
are eliminated if not enough information exists in
the neural response to support the observed
precisions, or if the information is not present
under all the confounding conditions under which
the system is able to function. Strong perceptual
and cognitive equivalence classes yield other
clues as to the nature of the information being
processed and of the modes by which it is
utilized.
Neuroanatomical and neurophysiological
considerations inform us as to how the parts of
the system are interconnected and how they
behave under particular conditions, but by
themselves do not inform us as to which parts are
essential for which functions, or how neural
responses are interpreted by the rest of the system
(Kiang, 1975). The psychological sciences inform
us as to the functional capabilities of the system,
but by themselves do not inform us the details of
the neural mechanisms, what parts are needed,
and how they must be organized to achieve
perceptual functions. A complementary approach
is therefore needed to focus on how the system is
organized to perform its functions. Currently this
149
approach comes under the rubric of functional,
integrative, or computational neuroscience. In the
context of informational functions, functional
organization involves those aspects of neural
responses that convey information and those
aspects of neural structure that permit this
information to inform behavior usefully.
Neuroanatomical and neurophysiological
considerations inform us as to how the parts of
the system are interconnected and how they
behave under particular conditions, but by
themselves they do not inform us as to which
parts are essential for which functions how
neural responses are interpreted by the rest of the
system (Kiang, 1975). The psychological sciences
inform us as to the functional capabilities of the
system, but by themselves they do not inform us
the details of the neural mechanisms what parts
are needed and how they must be organized so as
to achieve perceptual functions. A complementary approach is therefore needed to focus on
how the system is organized so as to perform its
functions. Currently this approach comes under
the rubric of functional, integrative, or
computational neuroscience. In the context of
informational functions, functional organization
involves those aspects of neural responses that
convey information and those aspects of neural
structure that permit this information to usefully
inform behavior.
TAXONOMY OF NEURAL PULSE CODES
Many different kinds of neural pulse codes are
possible (Fig. 2). Neural coding of sensory information can be based on discharge rates, imerspike
interval patterns, latency patterns, intemeural
discharge synchronies and correlations, spikeburst structure, or still more elaborate crossneuron volley-patterns. Sensory coding can be
based on the mass-statistics of many independent
neural responses (population codes) or on the
joint properties of particular combinations of
responses (ensemble codes)(Hatsopoulos et al.,
1998). Amidst the many ways that neural spike
trains can convey sensory information are
�PETER CARIANI
150
fundamentally two basic ideas: "coding-bychannel" and "coding-by-time". Channel-based
codes depend upon the activation of specific
neural channels or of configurations of channels.
Temporal codes, on the other hand, depend on the
relative timings of neural discharges rather than
on which particular neural channels respond how
much. Temporal codes can be based on particular
patterns of spikes within spike trains (temporalpattern codes) or on the relative times-of-arrivals
of spikes (time-of-arrival codes).
The three different modes of neural coding:
coding by channel, coding by temporal pattern,
and coding by time-of-arrival, are complementary
and correspond respectively to different, independent, and general aspects of signals:
a) the physical channel through which the
signal is transmitted,
its
intemal form (for example, its waveform
b)
or Fourier spectrum), and
c) its time of arrival.
The absolute magnitude of the signal
constitutes a fourth, intensive aspect that can be
used in conjunction with the other three. For
encoding multiple kinds of stimulus properties in
a signaling system, each signal requires two
independent variables, signal-type and signalvalue. One variable conveys the type or category
of the information that is contained in the signal,
whereas the other encodes the particular state of
the signal amongst the possible alternative states.
In artificial devices, the signal-type is most
commonly conveyed by the particular channel
through which a signal is sent (consider the many
types of information conveyed by the respective
wires leading to different gauges on the dashboard
of a car). The identity of the channel conveys to the
rest of the device what kind of information is being
sent (namely, to which type of sensor the wire is
connected). Similarly, in artifacts, signal-value is
usually conveyed by the amplitude of the signal,
often a voltage. Neural coding schemes similarly
l
Hi
!
I
,;!
-i
ii
Channel-activation
I!1
Latency-place
Spatio-temporal
pattern
Temporal pattern
Synchmnyplace
,,
ij!ji
II
Relative time-of-arrival
Fig. 2: A space of possible pulse codes. Three complementary modes of coding are shown at the vertices, with their
combinations on the edges.
�TEMPORAL CODING IN THE AUDITORY SYSTEM
require two sets of independent coding variables.
Most typically, channel-based neural-coding
schemes use the identities of neurons to encode
signal-types, whereas some intensive measure of
activation, such as discharge rate, encodes signalvalue. So constructed, channel-based coding
schemes depend critically upon which particular
neurons are activated how much. If the
connectivities of neurons are suddenly rearranged
in such a system, the coherence of neural
representations will be disrupted, at least until the
system can be adaptively rearranged to reflect the
new channel-identities.
Many different channel-based coding schemes
are possible. Such schemes can range from
simple, unidimensional representations to lowdimensional sensory maps to higher dimensional
feature detectors. In simple "doorbell" or "labeled
line" systems, activation (or suppression) of a
given neuron signals the presence or absence of
one particular property. In more multipurpose
schemes, neurons are differentially tuned to
particular stimulus properties, such as frequency,
periodicity, intensity, duration, or external
location. Profiles of average discharge rates
across a population of such tuned elements then
convey multidimensional information about a
stimulus. When spatially organized in a
systematic manner by their tunings, these
elements form sensory maps, in which spatial
patterns of channel-activation can then represent
arbitrary combinations of those stimulus
properties. In lieu of coherent spatial order, tuned
units can potentially convey their respective
channel-identities through the specificity of
spatially distributed neural connections. More
complex constellations of properties can be
represented via more complex concatenations of
tunings to form highly specific "featuredetectors". In the absence of coherent tunings,
response
of idiosyncratic
combinations
properties can potentially form "across-neuron
pattern codes" of the sort that are commonly
proposed for the olfactory system. Nevertheless,
idiosyncratic across-neuron patterns and
associative learning mechanisms have fundamental difficulties in explaining common strong
151
perceptual equivalence classes that are shared by
most humans and are largely independent of an
individual’s particular history (Gesteland et al.,
1965). Although these various functional
organizations, from labeled lines to feature
detectors to across-neuron patterns, encompass
widely diverse modes of neural representation, all
draw on the same basic strategy of coding-bychannel. In channel-coding schemes, it is usually
further assumed that distinctions between
alternative signal-states are encoded by different
average discharge rates (Shadlen & Newsome,
1994; Shadlen & Newsome, 1998). The
combination of channel- and rate-based coding
has remained by far the dominant neural coding
assumption throughout the history of neurophysiology (Boring, 1942; Barlow, 1995), and,
consequently, forms the basis for nearly all our
existing neural-network models.
Within channel-coding schemes, aspects of the
neural response other than rate, such as relative
latency or temporal pattern, can also play the role of
encoding alternative signal states (for example, the
latency-place and spatiotemporal codes shown in
Fig. 2). In a simple latency-channel code, channels
producing spikes at shorter latencies relative to the
onset of a stimulus indicate stronger activation of
tuned elements, which can be used to encode
stimulus intensity (Stevens, 1971), location (Brugge
et al., 1996), or other qualities. Common-response
latency, in the form of interchannel synchrony, has
been proposed as a strategy for grouping channels to
form discrete, separate objects (Singer, 1990;
Singer, 1995). In this scheme, rate pattems across
simultaneously activated channels encode objectqualities, whereas interchannel synchronies (joint
properties of response latencies) create perceptual
organization, which channels combine to encode
which objects. The concurrent use of multiple coding
vehicles, channel, rate, and common time-of-arrival
permits time-division multiplexing of multiple
objects. Still, other kinds of asynchronous multiplexing are possible if other coding variables, such as
common temporal pattem and phase coherence, are
used (Cariani, 1997).
Characteristic temporal discharge patterns can
also convey information about stimulus qualities.
�152
PETER CARIANI
Neural codes that rely predominantly on the timings
of neural discharges have been found in a variety of
sensory systems (Mountcastle, 1967; Perkell &
Bullock, 1968; Chung et al., 1970; Kozak &
Reitboeck, 1974; Covey, 1980; Emmers, 1981;
Bialek et al., 1991; Carr, 1993; Cariani, 1995;
Cafiani, 1997). Conceptually, these temporal codes
can be divided into time-of-arrival and temporalpattern codes.
Time-of-arrival codes use the relative times of
arrival of spikes in different channels to convey
information about the stimulus. Examples of timeof-arrival codes are found in many sensory systems
that utilize the differential times of arrival of stimuli
at different receptor surfaces to infer the location of
extemal objects (Bower, 1974; Carr, 1993). Strong
examples are auditory localizations that rely on the
time-of-arrival differences of acoustic signals at the
two ears, echolocation range-findings that rely on
time-of-arrival differences between emitted calls and
their echoes, and electroceptive localizations that
use the phase-differences of internally generated
weak electric fields at different locations ofthe body
to infer the presence of external phase distortions
caused by nearby objects.
Temporal pattern codes, such as interspike
interval codes, use temporal patterns between
spikes to convey sensory information. In a
temporal pattern code, the internal patterns of
spike arrivals bear stimulus-related information.
The simplest temporal pattern codes are interspike interval codes, in which stimulus
periodicities are represented using the times
between spike arrivals. More complex temporal
pattern codes use higher-order time patterns
consisting of interval sequences (Emmers, 1981;
Lestienne & Strehler, 1987). Like time-of-arrival
codes, interval and interval-sequence codes could
be called correlational codes because they rely on
temporal correlations between individual spikearrival events. These codes should be contrasted
with conceptions of temporal coding that rely on
temporal variations in average discharge rate or
discharge probability (for example, Richmond &
Gawne, 1998), which count numbers of events
across stimulus presentations as a function of
time and then perform a coarse temporal analysis
on event-rates. Both time-of-arrival and temporalpattern codes depend on the stimulus impressing
itself, in one way or another, on the timings of
neural discharges. The stimulus-related temporal
discharge patterns, on which temporal-pattern
codes depend, can arise in two ways, through
stimulus-locking and through intrinsic-time
courses of response.
For stimulus-locking, the discharges of
sensory neurons follow the time-amplitude course
of the stimulus waveform. The highly stimuluslocked nature of discharges in the auditory nerve
and the cochlear nucleus is evident in the peristimulus time histograms shown in the figures
below. As long as a monotonic relation exists
between the amplitude of the driving input and
the probability of subsequent discharge, temporal
correlations will be produced between waveform
and spike train. In the auditory system, as in many
other sensory systems, receptor cells depolarize
when stereocilia are deflected in a particular
direction, such that the timings of spikes
predominantly occur during one phase of the
stimulus waveform as it presents itself to the
individual receptor (for example, after having
been mechanically filtered by the cochlea). This
form of stimulus-locking is known as phaselocking. In the auditory system, depending upon
the species, strong phase-locking can exist up to
several kHz, dramatically declining as progressively higher frequencies are reached. Such
phase-locking is also found in many other sensory
systems, albeit usually at much lower frequencies.
Phase-locked responses exist
a) to flutter-vibrations of the skin in mechanoception (Mountcastle, 1993),
to
b) accelerations in the vestibular system,
c) to drifting gratings aod flickering lights in
the visual system (Pollen et al., 1989),
d) to inhalation cycles and odor pulses in
olfaction (Macrides & Chorover, 1972;
Onoda & Mori, 1980; Marion-Poll & Tobin,
1992),
e) to self-produced electrical oscillations in
electroception, and
f) to the movements of muscles in proprioceptive stretch receptors.
�TEMPORAL CODING IN THE AUDITORY SYSTEM
A generalization can be made that every sensory
system will show phase-locked responses to its
adequate stimulus, provided that the contrast is
sufficient to create distinguishable, phasedependent responses and that modulations are
slow enough for phase-dependent responses to be
separated temporally. To the extent that phaselocking exists, then the time intervals between the
spikes that are produced (interspike intervals)
reflect stimulus periodicities, such that time
intervals themselves can serve as neural
representations of stimulus form. In addition,
phase-locked discharges register the arrival times
of nonperiodic, transient, and unitary events, such
that comparisons of the arrival times of the same
event at different sensory surfaces (for example,
the differential time-of-arrival of aa acoustic
wavefront at the two ears) can serve as neural
representations of stimulus location relative to
those sensory surfaces.
The intrinsic temporal patterns of neural
response can also convey information concerning
stimulus qualities. Such temporal response
patterns can be characteristic of particular
receptor types, individual neurons, local neural
circuits, or even whole neural populations.
Stimulus-related temporal discharge patterns that
are not directly locked to the time structure of the
stimulus have been observed in many sensory
systems: olfaction (Kauer, 1974; Macrides, 1977;
Marion-Poll & Tobin, 1992; Laurent & Naraghi,
1994); gustation (Covey, 1980; Di Lorenzo &
Hecht, 1993); spatial vision (Richmond et al.,
1987; Richmond & Gawne, 1998); color (Kozak
& Reitboeck, 1974; Wasserman, 1992). In some
sensory modalities, temporal patterns of electrical
stimulation appear to produce particular sensory
qualities, such as taste and color (Young, 1977;
Covey, 1980; Di Lorenzo & Hecht, 1993),
suggesting that the temporal patterns themselves
may be the neural-coding vehicles that subserve
these particular qualities. Stimulus-triggered
intrinsic temporal patterns that are associated with
conditioning and perceptual expectations have
also been found in cortical regions (John &
Schwartz, 1978; John, 1990).
153
How might such intrinsic time patterns represent
combinations of stimulus properties? One
possibility is that the relative occurrence of different
time patterns, associated with characteristic impulseor step-responses of particular neurons, can serve as
markers that indicate the activation of particular subpopulations of neurons. Mixtures of odorants,
tastants, and wavelengths of light would then
produce mixtures of the respective temporal spike
patterns of the receptors and neurons that they
preferentially activate. As in the population-interval
representation for pitch discussed below, patterns
that are associated with the individual constituents,
their interactions, and their fusions presumably
would exist in the population time structure. These
features could then be used to discriminate basic
stimulus properties and to represent mixtures.
For different stimulus-receptor combinations,
many ionic and molecular mechanisms in sensory
receptors are available to produce differential
kinetics of activation, inactivation, and recovery.
In neural populations, temporal dynamics of
excitation and inhibition could similarly produce
characteristic temporal patterns. Both stimuluslocked and stimulus-triggered intrinsic temporal
response patterns can be found throughout the
auditory pathway. Extrinsic stimulus-locked
patterns are most apparent in the lower stations,
whereas intrinsic patterns become more apparent
as one progresses to more central stations, where
neural responses become increasingly dominated
by the recent history of the system as a whole.
Finally, yet another dimension to neural codes
involves the joint response properties of multiple
neurons. This dimension is the distinction
between population codes and ensemble codes
(Deadyler & Hampson, 1995; Hatsopoulos et al.,
1998), between statistical orders and switchboards (John, 1972). To represent information,
population codes use the mass statistics of
stimulus-driven response properties of individual,
largely independent units. Examples of such
population codes are population-rate vectors in
the motor cortex (Lee et al., 1998), or the auditory
population-interval distributions presented below.
In population codes, interdependencies between
�154
PETER CARIANI
the responses of particular neurons are themselves
irrelevant to the representation. Ensemble codes,
on the other hand, use these interdependencies
rather than common, stimulus-driven statistical
structure to represent information. Response
interdependencies can be reliably produced by
specific intemeural connectivities and timedelays. The resulting stimulus-related intrinsic
correlations between the neuronal channels that
are activated and/or synchronized, as well as
between the latencies of spikes produced by
different neurons, then can convey information
about a stimulus. Perceptual grouping by means
of channel-synchronizations that are not stimulusdriven would be an example of an ensemble code,
in which statistics of channel activations by
themselves would be insufficient for its
interpretation; one would have to know which
combinations of channels are synchronized at
each moment. In the context of sensory coding,
the relative merits of the stimulus-driven, massstatistics of population-codes versus the stimulustriggered, joint-response properties of ensemble
codes remain to be more fully explored.
THE NEURAL BASIS OF PITCH PERCEPTION
The nature of the neural codes that subserve
auditory perception have generated lively ongoing
discussion and debate for most of the last 150
years (Boring, 1942; Wever, 1949; de Boer,
1976). For the most part, this discussion has been
focused on whether frequency is represented
(a) via rate-place codes, namely, neural dischargerate profiles in auditory frequency maps, or
(b) via temporal codes, namely, interspike
interval distributions (Siebert, 1970; Moore,
1997; Evans, 1978s). In many debates about
neural coding, pitch has played a pivotal role
mainly because pitch is a perceptual correlate of
frequency (Boring, 1942; de Boer, 1976). At the
same time, pitch is also a perceptual correlate of
periodic waveforms, whether single pure tones or
complexes consisting of many harmonically
related partials. Operationally, pitch is defined as
the frequency of a pure tone to which a given
sound can be reliably matched. The percept
provides a very rich test bed for understanding
many aspects of perception. Like color, pitch is
metameric; the same pitch can be evoked by
many different stimuli that can differ markedly in
their power spectra. When harmonically related
partials are sounded together, strong pitches at
their common, fundamental frequency (F0) can be
produced in the absence of any spectral
component at that frequency (specifically, the
"missing fundamental" is heard). These pitches
are often called "low" pitches because the
fundamental has a lower pitch than those that are
associated with any of the individual partials.
Such pitches are often called "periodicity" pitches
because the low pitch at the fundamental reflects
the periodicity of the recurring time pattern that is
associated with the whole harmonic complex.
Thus, combinations of partials give rise to new
low pitches that are not heard in the separate
constituents. Pitches produced by such complex
tones are consequently "emergent" perceptual
Gestalts, products of the relations between parts
rather than of the parts themselves. Finally, pitch
is largely invariant with respect to a host of
factors, such as stimulus intensity and location,
that produce large changes in the responses of
auditory neurons. These perceptual invariances
focus the search for the neural basis of pitch on
the aspects of neural activity displaying similar
stability.
Historically, a strong case for temporal coding
of pitch has always been made ( Troland, 1929;
Boring, 1942; Wever, 1949), although the
pendulum of scientific opinion has swung back
and forth between spectral pattern and temporal
theories several times now (de Boer, 1976; Evans,
1978; Lyon & Shamma, 1995). Although autocorrelation-based models for pitch were first
proposed almost a half-century ago (Licklider,
1951; Licklider, 1959), only during the last two
decades have similar kinds of global, intervalbased models been revived and extended (van
Noorden, 1982; de Cheveign6, 1986; Meddis &
Hewitt, 1991; Slaney & Lyon, 1993; Lyon &
Shamma, 1995; Cariani & Delgutte, 1996a,
1996b; Meddis & O’Mard, 1997; Moore, 1997).
�TEMPORAL CODING IN THE AUDITORY SYSTEM
In physiological studies at the level of the
auditory nerve of the cat (Cariani & Delgutte,
1996a, 1996b), a robust and pervasive correspondence was found between interspike interval
statistics of populations of auditory nerve fibers
and pitches that are produced by a wide array of
complex tones. The auditory nerve is a strategic
location for the study of pitch, the conduit
through which must pass virtually all the auditory
information that the central auditory system uses
for the representation of sounds. Thus, whatever
the nature of subsequent processing, the necessary
information for all auditory capabilities must be
present in the responses of auditory nerve fibers.
For this reason, the auditory nerve has been one
of the most intensively studied neural populations
in the nervous system (Kiang et al., 1965; Rose et
al., 1967).
METHODS
The auditory nerve responses presented here
come from the same data set that has been published
previously in (Cariani & Delgutte, 1996a; 1996b),
where experimental methods, stimuli, and analytical
procedures are described in detail. Briefly, stimuli
were numerically synthesized and delivered via
closed, calibrated acoustic systems to Dialanesthetized cats with normal heating. Posterior
craniectomy and partial retraction of the cerebellum
permitted the visually-guided insertion of glass
microelectrodes into the auditory nerve near the
intemal auditory meatus. The auditory nerve in the
cat consists of two populations of spiral ganglion
afferents: myelinated Type I radial afferents (90% to
95%) and unmyelinated Type II outer spiral
afferents (5% to 10%) (Ryugo, 1992). The responses
of single Type I auditory nerve fibers were recorded
serially, using standard electrophysiological techniques. For each fiber, the characteristic frequency
(CF), the discharge-rate response threshold, and
the spontaneous rate were measured. The CF is
the frequency to which a fiber has its lowest
sound-pressure threshold (namely, the frequency
for which the lowest sound-pressure level reliably
elicits an extra spike within a 50 ms period).
155
Characteristic frequencies therefore provide an
indication of the cochlear "place" from which an
auditory nerve fiber receives its synaptic inputs.
Units in the cochlear nucleus were recorded extracellularly, using tungsten electrodes positioned
under direct visual guidance.
NEURAL CORRELATES OF PITCH IN THE
AUDITORY NERVE
In these studies, microelectrode recordings
were made of responses of single auditory nerve
fibers to stimuli that produce low, periodicity
pitches in humans. Figure 3 shows the responses
of 51 auditory nerve fibers to 100 presentations of
such a stimulus.
The waveform, power spectnma, and autocorrelation function of the vowel stimulus are
shown in panels 3A,C,E. The vowel is a harmonic
complex whose partials are all integer multiples
of its fundamental frequency (F0=80 Hz) and
whose waveform is periodic, repeating every
fundamental period (1/F0=12.5) ms. Perceptually,
the vowel produces a strong low pitch at its
fundamental frequency (F0=80 Hz), whereas the
vowel quality or timbre is determined by its
single, formant frequency (F1=640 Hz) and its
bandwidth (50 Hz). The temporal patterns that are
associated with the fundamental and the formant
can be seen in the waveform (3A) of the vowel,
whereas their respective harmonic spacings and
concentration of energy in the formant can be
seen in the power spectrum of the vowel (3C).
The vowel stimulus was delivered at a moderate
level (60 dB SPL).
Response peristimulus time histograms
(PSTHs) for the whole ensemble of fibers are
shown in Fig. 3B. The PSTHs are ordered by their
respective characteristic frequencies (CFs).
Immediately striking is the wide extent to which
stimulus-driven temporal discharge patterns
predominate over the entire auditory nerve array.
Periodicities related to the fundamental F0, and
hence, to the pitch period, are distributed across
the entire array in the responses of fibers, with
CFs ranging from 200 Hz to over 10 kHz. Given
�PETER CARIANI
156
1/FO = Pitch period
0
10
20
30
Peristimulus time (ms)
C
Pitch period
E
so-
1/Fo
1/F1
FO
IVlV v v v v v VlV v v v v v v V
Frequency (kHz)
D
50
40
2500
,
00 v
0 wO
0
.v
,p
VO0o00Oob
0
0
0
0.1
10
Characteristic frequency (kHz)
0
5
10
15
20
25
Interspike inte,al (ms)
Fig. 3: Auditory nerve response to a single-formant vowel. A. Vowel waveform. A strong, low voice pitch is heard
corresponding to the fundamental period, 1/F0=12.5 ms. B. Peristimulus time histograms of 51 cat auditory nerve fibers
to 100 presentations at 60 dB SPL, arranged by characteristic frequency (CF). C. Power spectrum of the vowel
(logarithmic frequency scale). The ftmdamental frequency, (F0=80 Hz frequency spacing of harmonics) and the
formant frequency (F1 640 Hz spectral peak) are indicated. Bandwidth 50 Hz. D. Discharge rates as a function of
CF and spontaneous rate (SR) (circles, high SR; triangles, medium SR; crosses, low SR). E. Stimulus autocorrelation
function. Arrows indicate formant period l/F1 and fundamental period l/F0. F. Population-interval distribution formed
by summing all-order intervals from all fibers.
�TEMPORAL CODING IN THE AUDITORY SYSTEM
that the stimulus has relatively little power above
1 kHz (Fig. 3C), this result is perhaps even more
remarkable. To a greater or a lesser degree, all
temporal discharge patterns follow the stimulus
waveform, reflecting the relation between the
respective fiber CFs and the stimulus spectrtnn.
The reason for this near ubiquity of common
temporal structure lies in the broadband nature of
the responses at moderate- and high-stimulus
levels and in the frequency asymmetry of cochlear
tuning. The broad, low-frequency tails of tuning
curves are such that low-frequency components
presented at moderate levels (>50 dB SPL) can
weakly drive large numbers of auditory nerve
fibers whose CFs are well above them (Kiang &
Moxon, 1974; Kim & Molnar, 1979). Discharge
rates as a function of CF and spontaneous rate are
shown in Fig. 3D for a rough comparison with the
stimulus power spectrum. Spectral pattern
representations for pitch that are based on
discharge rates would require that
a) the individual harmonics be separated in
population-rate profiles,
b) their frequencies be associated with the
individual harmonics estimated, and
harmonic relations be analyzed to infer
their
c)
the
frequency of their common
fundamental.
The two dominant periodicities of the vowel,
F0 and F1, can be readily seen in the discharge
patterns of fibers in different CF regions. At this
sound-pressure level, intervals related to the fundamental are found virtually everywhere, whereas
formant-related periodicities are concentrated
primarily in the CF regions that are nearest to the
formant. More detailed views of the responses of
two fibers with different CFs are shown in Fig. 4.
A fiber whose CF is in the formant region
(CF=950 Hz, Fig. 4A to 4F) discharges throughout most of each vowel period. A second fiber
whose CF is above the formant region (CF=2100
Hz, Fig. 4H to 4K) responds less vigorously to the
stimulus, producing spikes mostly at the onset of
the vowel period. In Fig. 4. first-order and allorder interspike interval histograms are shown for
the two fibers. A first-order interval histogram
(Fig. 4E and 4J) tabulates the distribution of
157
interspike intervals between consecutive spikes,
whereas an all-order interval histogram (4F and
4K), also called an autocorrelation histogram,
tabulates the distribution of intervals between
both consecutive and nonconsecutive spikes. Both
fibers produce intervals that are related to the
fundamental period (1/F0=12,5 ms) and to components in the formant region (1/Fl=l.6 ms),
albeit in different proportions.
It should be noted here that some measures
that have been traditionally used to quantify
temporal structure in neural responses, such as
first-order interval distributions, period histograms, and synchronization indices, can provide
misleading comparisons. For example, the
discharge rate of the higher-CF fiber is more
highly modulated, so that its period histogram
would show spikes that are distributed over a
smaller fraction of the vowel period, producing a
correspondingly higher synchronization index.
The higher-CF fiber might therefore be thought to
better encode the fundamental period. Similarly,
the higher-CF fiber produces more first-order
intervals at the fundamental period than does its
formant-region counterpart. But nevertheless, in
absolute terms, the formant-region fiber contributes more all-order, F0-related interspike
intervals to the population response. The reason
for the inversions concerns the relative nature of
these measures; for both measures, adding extra,
intervening spikes alters the apparent amount of
F0-related temporal structure. Because synchronization indices are relative, vectorial additions,
adding extra spikes throughout the period,
degrades the index. Because first-order interval
distributions omit longer intervals when intervening spikes are present, these distributions
systematically exclude longer F0-related intervals
as discharge rates increase. As discharge rates
generally increase with the level, if first-order
intervals were used, then the neural representation
of low fundamental frequencies should have
worsened at higher levels, a trend that is not
observed in the psychophysics. By contrast, allorder intervals that are associated with particular
periodicities are not adversely affected by the
extra, intervening spikes; hence such intervals
�PETER CARIANI
158
A
B
D
lOO
o
F.irst order
u}
o
C
F
25,
10
20
30
40
30
All order
0
50
5
10
15
J 14
20
25
First order
intervals
._
K 20
30,
o.
0
J,
,
I1,.
1)
2)
3)
4)
5)
Peristimulus time (ms)
]
All order
intervals
.t
0
5
10
15
20
25
Interspike interval (ms)
Fig. 4: Responses of two auditory nerve fibers with different CF’s to 100 presentations of a single formant vowel, 60 dB SPL.
A-F. Unit 25-19, CF 950 Hz, near the formant region. H-K. Unit 25-91, CF 2.1 kHz, well above the formant region.
A. Vowel waveform. Fundamental period l/F0 (line) is 12.5 ms, F0 80 Hz. B. Dot raster display of individual spike
arrival times. C. Peristimulus time histogram of spike arrival times. D. Stimulus autocorrelation function. Vertical line
indicates fundamental period, l/F0 voice pitch. E. Histogram of first-order interspike intervals (between consecutive
spikes). Arrows indicate intervals near the fundamental/pitch period. F. Histogram of all-order intervals (between both
consecutive and nonconsecutive spikes). H-K. Corresponding histograms for the second fiber.
�TEMPORAL CODING IN THE AUDITORY SYSTEM
constitute a neural coding strategy that better
mimics perception in its behavior. For these
reasons, it is important to choose measures of
temporal response structure appropriate to the
kinds of neural codes that one is investigating.
Every neural response measure that one analyzes
carries with it an implicit neural coding
hypothesis.
Population-interval distributions are formed
by summing together the all-order interspike
interval distributions of individual fibers (Fig.
3F). Population-interval distribution serves as a
rough estimate of the interval statistics of the
entire auditory nerve. Because this distribution is
the sum of many autocorrelation histograms or
channel-auto-correlations such a distribution is
often called the "summary autocorrelation" in
many signal-processing and auditory simulations
contexts (Meddis & Hewitt, 1991; Lyon &
Shamma, 1995). The most salient aspect of this
distribution is the large major peak associated
with the fundamental period (1/F0=12.5ms)
which, in turn, corresponds to the low pitch that is
heard. For harmonic stimuli, all-order intervals at
the fundamental period are always at least as
numerous as those associated with any other
periodicity (Rose, 1980), so that invariably, when
the all-order intervals from many fibers are
pooled together, the intervals at the fundamental
are the most abundant. The second major peak, at
25 ms, is also associated with the fundamental:
the second peak corresponds to two fundamental
periods. These major interval peaks correspond to
the major peaks in the stimulus autocorrelation
fimction (Fig. 3E). Thus, the most common interspike intervals that are generated at the level of
the auditory nerve correspond to the pitch of the
stimulus. This concordance was found to be the
case for a wide range of fundamental frequencies
and for many other kinds of harmonic stimuli as
well, using both neurophysiological data (Cariani
& Delgutte, 1996a; 1996b) and auditory nerve
simulations (Meddis & Hewitt, 1991; Meddis &
O’Mard, 1997).
Yet another salient aspect of the populationinterval distribution (Fig. 3F) is its similarity in
form with the autocorrelation function of the
159
stimulus (Fig. 3E). The similar locations of major
and minor peaks in both distributions is a general
consequence of phase-locking, namely, temporal
correlation between the stimulus waveform and
the spike timings. In effect, population-interval
distributions can serve as autocorrelation-like
representations of the stimulus that contains the
same information, up to the frequency limits of
phase-locking, as its power spectrtnn. Thus,
operations that are formally related to Fourier
analysis can be neurally realized in the time
domain by using all-order interval distributions.
Interspike interval information is extremely
precise, permitting the fundamental period to be
reliably estimated with a high degree of accuracy.
From the responses of a few thousand spikes,
estimates of the fundamental frequencies of
stimuli producing strong pitches, such as the
single-formant vowel, typically have standard
errors on the order of 1%. This estimate can be
compared with the ability of human listeners
(--30,000 Type I auditory nerve fibers) to
distinguish fundamental frequencies differing by
fractions of a percent (cf. Siebert, 1968; Siebert,
1970).
Many other aspects of pitch perception can be
explained in terms of population-interval representations. Some of these are summarized in Fig.
5, with their associated population-interval histograms. Harmonic complexes lacking frequency
components at their ftmdamentals, such as the
AM tone in Fig. 5A, nevertheless evoke strong
pitches at their "missing" fundamentals. The
power spectrum of the AM tone in the second
plot shows the frequencies of its three
components (solid lines at 480, 640, and 800 Hz)
and the frequency of the low pitch heard at the
fundamental (dotted line at 160 Hz). Both the
stimulus autocorrelations and the populationinterval distributions produced by such stimuli
(rightmost plots) exhibit major peaks that
correspond to these emergent pitches.
Different kinds of stimuli can give rise to the
same low pitch. In one way or another, the auditory
system creates strong perceptual equivalence
classes for pitch. Population-interval distributions
for four stimuli are shown in Fig. 5B. Despite very
�PETER CARIANI
160
A
Pitch of the
"missing
fundamental"
AM tone
Pure tone
B
AM nolse
Cllck tmln
Pitch Equivalence
(160 Hz)
Weak pitch
Strong pitches
C
Pitch salience
D
Level invariance
E
Pitch shift of
inharmonic
80
60
40 dB SPL
AM tones
F
AM tone
Phase invariance
QFM tone
G
Dominance region
1/F4’103-5
F03.5=160 Hz
ae
H
320 Hz
240 Hz
ah
er
480 Hz
u
vowel quality
(timbre)
0
5
Fig. 5: Schematic summary of major correspondences between pitch percepts and population interval distributions at the level
of the auditory nerve. The population-interval histograms plot relative numbers of all-order intervals (ordinates) of
different durations (abcissas). Interval ranges for the histograms: 0-5 ms (H), 0-10 ms (A, F); 0-15 ms (B, C, E, G); 0-25
ms (D). Waveform segments are 20 ms long. See text for discussion.
�TEMPORAL CODING IN THE AUDITORY SYSTEM
different power spectra, each kind of stimulus
evokes a common low pitch at 160 Hz. In all
cases, the positions of the major interval peaks
correspond to the common pitch period (6.25 ms).
Thus, if the auditory system carried out an
analysis of population-interval distributions, with
the predominant interval corresponding to the
pitch, then the pitch-equivalence of these stimuli
would be a direct consequence of the basic
neural-coding mechanisms that are used by the
auditory system.
Different stimuli also differ in pitch salience,
evoking stronger or weaker pitches. The
population-interval distributions for three stimuli
differing in pitch salience are shown in Fig. 5C.
The two leftmost stimuli, a pure tone and an AM
tone, evoked strong pitches, whereas the rightmost stimulus, an amplitude-modulated broadband noise, evoked a weak pitch. Qualitatively,
the stimuli evoking strong pitches produced
population-interval distributions with higher
peak-to-mean ratios, namely, a higher fraction of
all the pitch-related intervals that were produced.
The stimuli producing weak pitches had low
peak-to-mean ratios that were much closer to
unity. The correspondence between pitch salience
and peak-to-mean ratios is rough only because the
pure tone produces a pitch that is always at least
as salient as an equivalent AM tone, yet the peakto-mean ratio of the AM tone was substantially
greater than that of the pure tone.
The low pitches of complex tones are highly
invariant with respect to stimulus intensity.
Population-interval distributions for the singleformant vowel discussed above are shown in Fig.
5D for three sound pressure levels: low (40 dB
SPL), moderate (60 dB SPL) and high (80 dB
SPL). Like human pitch judgments, the pitches
that were estimated from population-interval
distributions changed very little over the 40 dB
range. Similarly, the representation of formantrelated periodicities remained very stable over
that range. In the auditory system, such stability
makes for extremely robust representations of
pitch and timbre that do not degrade at moderate
and high levels. In contrast, the saturation of
discharge rates at these levels (Kim & Molnar,
161
1979), with the consequent loss of representational contrast and precision, poses fundamental
problems for rate-place coding of these qualities.
Population-based correlational representations
of loudness are conceivable. As stimulus levels
increase, population interval distributions more
closely resemble the stimulus autocorrelation: the
correlation coefficient r between the stimulus
autocorrelation function of the single formant
vowel, and its respective population-interval
histogram is 0.62 (n--17 fibers) for 40 dB SPL;
rising to 0.70 (n-61 fibers) at 60 dB SPL, and
0.77 (n=31 fibers) at 80 dB SPL. The correlation
coefficient is, in effect, a measure of the amount of
the common stimulus-driven time structure in the
neural population. These comparisons are tentative
because little overlap exists among the three sets of
fibers. Nevertheless, such comparisons suggest a
straightforward interpretation. As stimulus levels
increase, a progressively greater fraction of discharge
timing is stimulus-driven, such that the ratio of
stimulus-driven intervals versus tmcorrelated,
spontaneously produced intervals steadily increases.
Thus, the loudness of an auditory object potentially
could be encoded by the fraction of the common
temporally structured activity with which it is
associated. Such a correlational representation would
effectively use the entire dynamic range of the whole
auditory nerve array. In such a scheme, spontaneous
activity increases the dynamic range of the system by
providing an uncorrelated noise source that can be
successively displaced by stimulus-driven interspike
intervals.
Complex pitch phenomena can also be explained
of population-interval distributions. Whereas
terms
in
periodic, harmonic tone complexes generally evoke
unambiguous low pitches, inharmonic complexes can
evoke ambiguous, mtdtiple low pitches and small
pitch shifts. A half-century ago, Schouten and deBoer
(deBoer, 1976) conducted a classic set of experiments to determine whether pitch perception relies on
spacings between adjacent frequency componems (or
equivalently on waveform envelope periods) rather
than on harmonic relationships between components
(or equivalently on the waveform fine structure). An
AM tone consists of a complex comprising three
successive harmonics that evokes a clear,
�162
PETER CARIANI
unambiguous pitch at its (missing) fundamental
frequency. When all three harmonics were shifted
either upward or downward in frequency by the same
amotmt, while keeping their frequency-spacings
comtant, the low pitch of the complex first shifted
slightly by a much smaller amount than this frequency
difference, an amount that was related to harmonic
structure. When the frequencies were further shifted,
listeners could hear one of two ambiguous pitches in
the vicinity of the original pitch. The pitches
estimated from the population-interval distributiom
for these respective cases (Fig. 5E) closely correspond
to the pitch shifts that have been observed for human
listeners. When the complex is harmonic
(n=Fc/Fm=6=integer), there is one clear pitch and
one population-interval maximum. When the
complex is inharmonic (n=5.86=noninteger), the
pitch shifts, as does this maximum (arrow). When
the components are further shifted downward
(n=5.5), either of the two pitches can be heard
with roughly equal probability; correspondingly,
two equal population-interval maxima are present
(double arrows). Thus, a complex set of
harmonically-based pitch effects can be readily
explained in terms of population-interval
representations.
The relative insensitivity of most auditory
perception to the phase spectra of stationary
sounds has long been recognized. For complex
tones consisting of lower-frequency stimulus
components (<1500 Hz), distinguishing stimuli
that differ in phase, but not magnitude spectrum,
despite very obvious differences in their
waveforms, is generally very difficult. The
waveforms of two such stimuli, an AM tone and a
quasi-frequency modulated (QFM) tone that
differ only in the phases of their center
components (640 Hz), are shown in Fig. 5F.
Their waveform envelopes are considerably
different, with the AM tone having an envelope
that is highly modulated, and the QFM tone
having one that is much flatter. Their perceptual
indistinguishability argues against auditory
mechanisms that are sensitive to the phases of
low-frequency components, such as neural
computations that carry out an analysis of wholewaveform envelopes. The respective population-
interval distributions for these stimuli are highly
similar, almost indistinguishable.
Whereas the perception of pitches created by
low-frequency harmonics is largely phaseinsensitive, the same cannot be said for the
higher-frequency, closely-spaced, perceptually
"unresolved" harmonics. Alterations in the phases
of the upper harmonics can affect the low pitches
that they evoke (for example, doubling the pitch)
by altering the shapes of waveform envelopes that
are produced by cochlear filtering. Thus psychophysically, two kinds of low pitches appear to be
evoked by complex tones:
1) phase-insensitive pitches that are produced
by lower-frequency, perceptually-resolved
harmonics, and
2) phase-sensitive pitches that are produced by
higher-frequency, unresolved harmonics.
This dichotomy has led some auditory theorists to
posit dual pitch mechanisms, one for resolved
harmonics alongside another for unresolved ones
(Carlyon & Shackleton, 1994; Shackleton &
Carlyon, 1994). Both sets of low pitches can be
explained, however, in terms of a cemral analysis
of all-order population-interval distributions. For
closely spaced, unresolved, higher-frequency
components, phase-locking to individual components is weak relative to phase-locking to
envelopes, such that the interspike intervals that
are produced (primarily by high CF fibers) mostly
reflect the temporal structure of the envelope. The
two kinds of low pitches may therefore
correspond to the two modes by which pitchrelated interspike intervals can be generated:
phase-locking to individual harmonics, and
phase-locking to their interactions (envelopes).
As population-interval distributions incorporate
intervals that are generated by both mechanisms,
these representations provide a unified analytical
framework that accounts for both kinds of pitches
(Cariani & Delgutte, 1996a, 1996b; Meddis &
O’Mard, 1997). The perceptual resolvability of
harmonics itself may have a neural basis in the
two competing mechanisms of interval generation
and in the discriminability of multiple interval
peaks in population-interval distributions that
they produce (of. discussion of neural coding and
�TEMPORAL CODING IN THE AUDITORY SYSTEM
signal detection (Moore, 1997, pp. 118-121).
Thus, in population-interval accounts, linkages
could exist between the perceptual resolvability
of harmonics and different modes of pitch
perception.
The dominance of lower-frequency harmonics
in determining the low pitch of a complex tone
("the dominance region for pitch") can also be
explained in population-interval terms. All other
factors being equal, when two harmonic
complexes, one consisting of lower-frequency
(<1500 Hz) and the other of higher-frequency
(>1500 Hz) components, each having slightly
different fundamentals, are presented together so
that their pitches compete, the pitch of the former
is almost always heard over that of the latter.
Population-interval distributions for such a
combination of two complexes (harmonics 3-5 of
fundamentals at 160, 240, 320, and 480 Hz versus
harmonics 6-12 of fundamentals 20% higher) are
shown in (Fig. 5G). In all cases, the predominant
interval in the distribution corresponds to the
dominant pitch of the lower-frequency complex
(1/F03_5) rather than that of the upper (1/F06-12). It
thus appears that harmonics in the 500 to 1500 Hz
range are disproportionately effective in
generating many all-order interspike intervals at
the fundamental period. These frequencies
produce the most highly phase-locked responses
in the greatest number of fibers. As a result,
because of the basic factors that are common to
many mammalian auditory systems, populationinterval distributions preferentially reflect the
stimulus frequencies that play a predominant role
in determining pitch percepts.
In addition to pitch, vowel quality or timbre
can also be represented in population-interval
distributions in patterns of short intervals (Fig.
5H). Timbre itself is a complex, multidimensional
auditory quality that can depend upon many
factors, such as spectral shape, onset and offset
properties, ongoing temporal dynamics (vibrato,
roughness), and phase coherence (tones vs.
noises). For stationary, harmonic sounds, timbre
is determined by spectral shape, for example, the
locations and heights of formants. The stimulus
autocorrelation function and the population-
163
interval distribution show a series of minor peaks,
which are associated with components in the
formant region that give the vowel its
characteristic tone quality. Patterns of shorter
intervals, those less than half the fundamental
period (1/F0<6.25 ms), reflect formant structure
alone, whereas patterns of longer intervals reflect
fundamental-formant relationships. For multiple
formant vowels, the patterns of short intervals in
population-interval distributions are sufficient to
discriminate different vowels, using temporal
information alone ( Palmer, 1992; Cariani, 1995;
Cariani et al., 1997). The appearance and disappearance of minor peaks in the population-interval
distribution also closely follow the perceptual vowelclass boundaries that are observed psychophysically
(Hirahara et al., 1996).
These findings, when taken together with those
derived from populations of simulated auditory
nerve fibers, suggest that many diverse aspects of
pitch perception can be directly explained in terms
of population-interval distributions at the level ofthe
auditory nerve. The main conclusions can be
summarized as follows.
1) First, with very few exceptions, the most
common all-order interval present in the
population precisely and robustly corresponds to the pitch that is heard.
2) Second, the relative proportion of pitchrelated intervals amongst all others roughly
corresponds to the strength of the pitch that
is heard.
Many complex aspects of pitch perception can
consequently be readily explained in terms of a
central analysis of population-interval representations. All-order interspike intervals themselves
are time durations that preserve harmonic
relations between frequencies, such as the 2:1
octave ratio. If the auditory system uses
representations that preserve the harmonic
structure inherent in time intervals, then the
perception of basic harmonic relations may be a
direct consequence of the neural codes that the
auditory system uses to represent and analyze
sounds, rather than the product of elaborate
harmonic cognitive schemas that have been built
up from prior experience.
�PETER CARIANI
164
CODING OF PITCH IN THE CENTRAL
AUDITORY SYSTEM
Whether such a temporal analysis is in fact
implemented in the central auditory system, what
form it might take, and where it might occur are
issues that are presently under investigation.
Previous studies of neural responses in the
auditory brainstem have indicated a widespread
locking of discharges to pitch-related stimulus
periodicities (Greenberg & Rhode, 1987; Kim &
Leonard, 1988; Kim et al., 1990; Rhode, 1995).
Several populations of neurons in the three major
divisions of the cochlear nucleus (anteroventral
division, AVCN; posteroventral division, PVCN;
dorsal division, DCN) project to more central
auditory stations in the brainstem and midbrain.
By virtue of the differences in the distribution of
their inputs and intrinsic properties, the neurons
in each population have a characteristic response
pattern when driven with pure tone bursts at their
characteristic frequencies (TBCF). As in the
auditory nerve, harmonic complex tones that
produce strong pitches at their fimdamentals
similarly produce many pitch-related interspike
intervals. Figure 6 shows the responses to a
single-formant vowel of three physiologicallycharacterized units (Fig. 6A to 6C) that are
representative of their respective populations.
Previous studies have identified the morphological cell-types that are associated with
different TBCF response patterns (Pfeiffer, 1966;
Rhode et al., 1983; Young, 1984). "Primary-like"
TBCF responses are produced by spherical cells
in the AVCN, sustained "chopper" responses to
high-frequency tone bursts are produced by
multipolar cells in the PVCN, whereas "pauser"
patterns consisting of an onset-pause-sustained
discharge pattern are produced by fusiform cells
in the dorsal division (DCN). Pdmarylike units,
as their name implies, have responses that are
name implies, have responses that are most
similar to those of primary sensory neurons
(auditory nerve fibers). The discharges of this
primarylike unit (Fig. 6A) exhibit stimulus-driven
periodicities that are associated with fimdamental
(12.5 ms) and formant frequency (multiples of
1.6 ms), as well as with intrinsic periodicities that
are associated with the characteristic frequency of
the unit (CF=400Hz; 1/CF=2.5ms). These
intrinsic periodicities ostensibly stem from
similar CF-related periodicities that are seen in
auditory nerve fibers, which are in turn produced
by the mechanics of the cochlea. Sustained
chopper responders are so named because they
fire very regularly ("chop") at their own
characteristic rate when driven by high-frequency
tone bursts. When these units are driven by
periodic harmonic stimuli, however, their
discharges almost invariably lock strongly to the
fundamental and only weakly to other stimulusperiodicities, if at all (Rhode, 1998). Pauser
responders manifest more complex TBCF
patterns that are the product of both intrinsic
membrane properties and local circuit action.
Whereas these units tend to respond more weakly
to periodic stimuli than do other cochlear nucleus
response types, their discharges nevertheless lock
to fundamentals to produce many pitch-related
intervals. A general rule of thumb for these
populations is that if a unit responds to a
haxmonic stimulus that is capable of producing a
strong low pitch, the unit will either produce
intervals that. are related to the fundamental
(extrinsic, stimulus-driven time structure) or to its
characteristic frequency (stimulus-triggered,
system-dependent intrinsic time structure). As
intervals related to the fundamental are common
to all units that are driven by a harmonic complex
tone, but those related to any given characteristic
frequency are not, it is all but inevitable that such
pitch-related intervals predominate in these
cochlear nucleus populations (for the same
reasons that such intervals predominate in the
auditory nerve). Thus, the population-interval
representations of pitch appear to be viable at the
level of the cochlear nucleus, as well as at the
auditory nerve.
From all accounts, as one ascends the auditory
pathway to auditory midbrain, thalamus, and
cortex, the presence of pitch-related interspikeinterval information becomes less apparent. One
possibility is that interspike interval information
is converted to a rate-based representation
�TEMPORAL CODING IN THE AUDITORY SYSTEM
somewhere in the pathway. Units that are
differentially responsive to particular modulation
frequencies have been proposed as the basis of
such a time-to-place transformation (Langner,
1992), although whether such rate-based
representations are sufficiently precise or robust
to account adequately for pitch perception is not
yet clear.
Another possibility is that interspike interval
information persists, albeit in a sparser and more
distributed form, at still more central stations. The
same amount of interval information might well
be distributed more sparsely over progressively
greater numbers of neurons. Intervals bearing
periodicity-related information might be multi-
A
B
AVCN Primarylike
165
plexed with other kinds of spike pattems bearing
information about location and context. These
factors would make interspike interval
information more difficult to detect using
standard spike train analysis techniques.
Still another possibility is that central stations
might simply use less interval information than is
available at more peripheral stations. A great
overabundance of interval-based information
exists in the auditory nerve, such that relatively
small numbers of intervals are sufficient to
account for the high precision of frequency
discrimination (Siebert, 1970). Indeed, this
overabundance has often been used to assert that
if auditory central processors were to make
C
PVCN Sustained chopper
DCN Pauser
100
..:
35
20
20
o
LIJ
-iJ
o
5o
-.,.
".
....!
"":
,.;
,,"
;,hi l-],l
0
Peristimulus time (ms)
Peristimulus time (ms)
Peristimulus time (ms)
70
.. "
IIi.,l’il
I.,
5o
...,,:.;;
20
25
._
0
0
25
lnterval (ms)
25
0
Interval (ms)
25
0
Interval (ms)
Fig, 6: Responses of three units in the cochlear nucleus to 100 presentations of a single-formant vowel (F0=80 Hz, F =640 Hz,
BW=50) at 60 dB SPL. Units were classified according to their PSTH response to short tone bursts at CF. A. Dot-raster,
PSTH, and all-order interval histogram for a primarylike unit in antero-ventral cochlear nucleus (AVCN), CF=400 Hz.
B. Response of a sustained chopper unit in posterior-ventral cochlear nucleus (PVCN), CF=I.5 kHz. C. Response of a
pauser unit in dorsal cochlear nucleus (DCN), CF=4.4 kHz.
�PETER CARIANI
166
optimal use of this information, then human
frequency discrimination would be some 40 times
better than it is. The other side of this coin is that
even if most interval information were to be lost
or degraded in the ascending pathway, then
enough information would remain to account for
the observed precision of pitch discrimination.
Although stimulus-driven temporal structure
declines at higher stations, it is important not to
understate how much remains. Most studies thus
far have been conducted under general anesthesia,
but such agents generally reduce the upper
frequency limits of stimulus-driven neural
response periodicities by about one half (for
example, see Goldstein et al., 1959). In
unanesthetized animals, considerable phaselocking to 1-2 kHz tones is observed at the
thalamic level (de Ribaupierre, 1997). Likewise,
in the input layers of unanesthetized primary
auditory cortex, fundamental frequencies up to
400 Hz are reflected in the synchronized
responses of local ensembles of auditory neurons
(Steinschneider et al., 1998). First-spike latencies
for onsets of tone bursts at the level of the
primary auditory cortex have small variances on
the order of fractions of a millisecond that are
comparable to those seen at the auditory nerve
(Phillips, 1989; Heil, 1997), despite a
conspicuous lack of sustained phase-locking to
the pure tones themselves. Precise temporal
patterns, embedded in spike trains, occur in a
diversity of cortical locations (Abeles et al., 1993;
Lestienne & Tuckwell, 1998). Although the
evidence for and against time structure in the
cerebral cortex has a decidedly mixed character,
the data nevertheless suggest that the cortex may
be capable of preserving more fine timing
information than is commonly thought.
GENERAL IMPLICATIONS FOR
SENSORY CODING
Population-interval representations hold many
general implications for sensory coding. The
coding of pitch through the interspike interval
statistics of a population of neurons is a strong
example of a temporal pattern code in its purest
form, an example of a distributed temporal
population code that does not entail imemeural
synchrony.
The population-interval distribution differs
from both rate- and channel-based represemations
in two crucial ways: through the different nature
of their primitives, and through the qualitatively
different roles that channels play. Interspike
intervals are time intervals that describe temporal
relations between pairs of jointly occurring spike
Such time imervals constitute
correlational, relational primitives. In comrast,
representations that are based on probabilities or
on rates of unitary spike evems coum numbers of
spike events over comiguous time windows. The
counting assumption, with its scalar signals, in
turn necessitates a whole host of assumptions
concerning the functional topology of neural
networks (Cariani, 1997). Second, in a
channel
population-interval
representation,
identities, which particular channels are activated
how much, are not essemial to the
representational function. In the auditory nerve, of
course, particular CF regions are preferemially
activated by stimulus components that are nearby
in frequency, and these regions will therefore
contribute relatively more of their stimulusrelated intervals to the global distribution. In this
way, the population-interval distribution reflects
the differential contributions of differem CF
regions. Once the intervals are combined,
however, the representation does not rely on the
particular channel-identities of the fibers to
encode frequency (because the imervals
themselves bear this information, and in a much
more precise and robust way). One could discard
all information concerning characteristic
frequency (or cochlear place) without affecting
the representation. In contrast, in a channel-based
neural represemation, such as a rate-place
frequency map, the identities of particular
channels
critical
for
are
absolutely
representational function. Consequently, stimulus
representations would be corrupted if the channelidentities were scrambled (if the "labels" on the
events.
�TEMPORAL CODING IN THE AUDITORY SYSTEM
"labeled lines" were switched). Thus, the
population-interval representation relies upon
how neurons in a population respond and which
intervals they produce, rather than upon which
particular neurons fire how much.
The basic informational constituents of rateplace and population-interval representations are
therefore very different, such that they complement each other, with neither representational
mode precluding the other. The same holds true
for representations based on relative response
latencies and neural synchronies: fine temporal
structure and relative latency patterns can all
coexist within the coarser-grained, tonotopically
ordered spatial patterns of activation. At the level
of the auditory nerve and cochlear nucleus, the
representation of periodicity pitch appears to
follow this pattern of fine temporal structure
within more coarsely tuned frequency channels.
Strong correspondences, population-interval
distributions, and their respective stimulus autocorrelation functions were manifest in the similar
patterns of major and minor peaks, with major
peaks corresponding to pitch and minor peaks to
timbres. Pitch judgments are relatively welldescribed by temporal autocorrelation models,
precisely because the neural, interval-based
representations subserving these judgments are
themselves autocorrelation-like. In retrospect, the
reasons for such similarities are fairly
straightforward, being direct consequences of the
stimulus-locked nature of auditory nerve fiber
discharges. In the cochlea, the acoustic stimulus
is, in effect, passed through a set of band-pass
filters, such that each auditory nerve fiber is
driven by a different set of frequency
components. If a signal is passed through an array
of overlapping frequency channels consisting of
linear band-pass filters, then a series of filtered
waveforms is produced. The sum of the channelautocorrelations of the filtered waveforms equals
the autocorrelation of the original, unfiltered
signal (Licklider, 1951) for the same formal
reasons that permit the linear superposition of
Fourier components in power spectra. In the
cochlea, each auditory nerve fiber produces
phase-locked discharges to components whose
167
frequencies are closest to its own CF, and in
doing so, produces all-order imervals that are
correlated with the autocorrelations of those
components. The interval peak positions for
individual fibers consequently mirror those in the
stimulus autocorrelation (Fig. 4). In a linear
system, both peak positions and relative heights
would mirror those in the stimulus autocorrelation function. Whereas the populationinterval distributions presented in Fig. 3F show
similar peak positions, the relative peak heights
are noticeably different. Such differences are
created by nonlinear processes, such as firing rate
thresholds and saturations, that alter relative peak
heights without changing peak positions.
Representations of frequency that are based on
all-order interspike intervals are therefore
resistant to many kinds of intensity-dependent
nonlinearities. The functional implications of
nonlinear distortions in the cochlea thus depend
critically on the neural codes that the central
auditory system uses. The robustness of intervalbased representations, with respect to intensitydependent distortions, makes them ideal for
representing auditory forms.
More generally, it can be said that to the
extent that spike-arrival times are correlated with
a stimulus waveform, the intervals between
spikes will be correlated with the stimulus autocorrelation function. This relation will hold for
any sensory system whose receptors follow the
time courses of their effective stimuli. Such
phase-locking is seen for patterns of vibrations on
the skin (Morley et al., 1990; Motmtcastle, 1993)
and for changing luminance patterns as images
move relative to retinal arrays ( Reichardt, 1961;
Pollen et al., 1989; Bialek et al., 1991).
Autocorrelation-like sensory representations that
use all-order interspike intervals thus constitute
potential stimulus-coding strategies in such
modalities. Representations of visual form and
texture that are based on spatial autocorrelation
have been proposed (Uttal, 1975), but few
attempts have been made to use stimulus-driven,
fine spatiotemporal correlation structure for this
purpose (Reitboeck et al., 1988). Recent psychophysical evidence points to a strong role for such
�PETER CARIANI
168
structure in the perception of visual forms (Lee &
Blake, 1999).
The means by which neural computational
architectures might make use of interspike
interval statistics of populations of neurons
largely remains to be explored. Different kinds of
codes naturally lead to different neural-processing
architectures. Channel-coding naturally leads to
connectionist networks, in which information is
represented through specific pattems of channel
activation and processed through networks, in which
specific connectivities determine functional roles. In
such systems, highly specific modification of
effective connectivity is the main mechanism by
which functional plasticity is achieved.
For the most part, when temporal structure has
been considered in functional terms; it has been
assumed that to use the information, temporal
patterns must be converted to channel-activation
patterns. Thus the first neural auditory
computation networks converted time-of-arrival
differences and temporal patterns into spatial
patterns of activations. Time-delay neural
architectures, consisting of tapped delay lines and
coincidence counters, were proposed for using
interaural time-of-arrival differences to localize
sounds by computing binaural cross-correlations
(Jeffress, 1948). The coincidence channels that
were maximally activated served to indicate the
relative time-of-arrival of sounds at the two ears
and hence, their location in the azimuthal plane.
Similarly, neural time-delay networks that used a
different arrangement of tapped delay lines and
coincidence counters were proposed for carrying out
neural autocorrelational analyses that spatialize
population-interval distributions for analysis
(Licklider, 1951; Lyon & Shamma, 1995). The
coincidence counters act as autocorrelating
periodicity-detectors that operate on all-order
intervals.
In general, systematic differences in arrival
times of external disturbances at different sensory
surfaces support neural representations for
external location based on stimulus-locked, timeof-arrival codes. Such differences naturally lend
themselves to analysis via temporal crosscorrelation operations (Carr, 1993). On the other
hand, characteristic temporal spike-pattems that
are generated at sensory surfaces through either
stimulus-locking or stimulus-triggered intrinsic
responses potentially support neural representations of stimulus-form. These characteristic
temporal patterns naturally lend themselves to
autocorrelational analyses. Early comprehensive
computational models for hearing (Licklider,
1959; Cherry, 1961) integrated both kinds of
correlational processes to represent both location
and form. How many auditory functions can be
subsumed under these two operations, and the
extent to which other sensory systems might
operate using similar principles, remains to be
seen.
In time-delay architectures, plasticity of
function is achieved by adjusting effective
connectivities to favor particular sets of timedelays (Licklider, 1959; Tank & Hopfield, 1987),
or by adjusting time delays to synchronize
particular sets of inputs (MacKay, 1962).
Changes in temporal response properties as a
result of conditioning have been observed in a
wide variety of systems (Morrell, 1967; Thatcher
& John, 1977; John & Schwartz, 1978; Singer,
1995). In principle, a neural assembly can be
formed that will respond preferentially to any
spatiotemporal pattern in its inputs by adjusting
the relative time delays and connection weights to
match those in the incoming pattern. Neural
delays can be created by any process that takes
time to unfold and be modified by any process
that alters response latency. Axonal and dendritic
transmission times, latencies of activation, and timecourses of neuronal recovery (Raymond, 1979;
Wasserman, 1992) potentially provide shifts in time
and sensitivities to time pattem that can become
control points for adaptive adjustment. Intraneural
delays can then be concatenated in multisynaptic,
recurrent, and/or re-entrant pathways to form still
longer delays. To the extent that timing is important
in a neural information processing system, such
alterations of temporal response properties provide
avenues by which modifications of struc.ture can
lead to modifications of function.
Finally, neural networks that carry out their
operations entirely within the time domain can be
�TEMPORAL CODING IN THE AUDITORY SYSTEM
envisioned (Cariani, in press). Neural timing nets,
consisting of tapped delay lines and coincidence
detectors, analyze temporally-coded inputs to
produce temporally-coded outputs. Simple feedforward timing networks fimction as temporal
sieves that extract common periodicities in their
inputs, thereby finding similarities and
differences between them. A fundamental
advantage of these timing nets is that they operate
on interval statistics, obviating the necessity for
precise regulation of point-to-point connectivities.
Recurrent timing networks can be used to build
up periodic temporal patterns in their inputs and
to separate out repeating patterns that have
different periods. Combinations of feed-forward
and recurrent delay lines coupled with
coincidence and anticoincidence elements may
then provide general-purpose strategies for
detecting correlational, relational structure in the
world. Efforts to understand the combined
functional capabilities of temporal codes and
timing nets are presently in their early, formative
stages.
ACKNOWLEDGMENTS
This work was supported by Grant DC03054
from the National Institute for Deafness and
Communications Disorders (NIDCD) of the
National Institutes of Health (NIH).
REFERENCES
Abeles M, Bergrnan H, Margalit E, Vaadia E. Spatiotemporal firing patterns in the lontal cortex of behaving
monkeys. J. Neurophysiol. 1993; 70: 1629-1638.
Barlow HB. The neuron doctrine in perception. In:
Gazzaniga, MS, ed, The Cognitive Neurosciences.
Cambridge: MIT Press 1995; 415-435.
B ialek W, Rieke F, van Stevenink RR, de Ruyter WD.
Reading a neural code. Science 1991; 252: 1854-1856.
Boring EG. Sensation and Perception in the History of
Experimental Psychology. New York: AppletonCentury-Crofts, 1942.
Bower TGR. The evolution of sensory systems. In:
MacLeod RB, Pick Jr. H, eds, Perception: Essays in
169
Honor of James J. Gibson. Ithaca, NY: Comell
University Press 1974; 141-152.
Bmgge JF, Reale RA, Hind JE. The structure of spatial
receptive fields of neurons in primary auditory cortex of
the cat. J Neurosci 1996; 16: 4420-4437.
Cariani P. As if time really mattered: temporal strategies for
neural coding of semory information. Communication
and Cognitiotr---Artificial Intelligence (CC-AI) 1995;
12: 161-229. Reprinted in: Pribram K, ed, Origins:
Brain and Self-Organization. Hillsdale, NJ: Lawrence
Erlbaum 1994; 208-252.
Cariani P. Emergence of new signal-primitives in neural
networks. Intellectica 1997; 1997: 95-143.
Cariani P. Temporal coding of sensory information. In:
Bower, JM, ed, Computational Neuroscience: Trends in
Research. 1997. New York: Plenum 1997; 591-598.
Cariani P. Neural timing nets for auditory computation. In:
Greenberg S, Slaney M, eds, Computational Models of
Auditory Function. Amsterdam: lOS Press in press; 16 pp.
Cariani P. Delgutte B. Tmmo M. Neural representation of
pitch through autocorrelation. Proceedings. Audio
Engineering Society Meeting (AES). New York.
September. 1997. Preprint #4583 (L-3); 1997.
Cariani PA, Delgutte B. Neural correlates of the pitch of
complex tones. I. Pitch and pitch salience. J Neurophysiol.
1996a; 76: 1698-1716.
Cariani PA, Delgutte B. Neural correlates of the pitch of
complex tones. II. Pitch shift, pitch ambiguity, phaseinvariance, pitch circularity, and the dominance region
for pitch. J Neurophysiol. 1996b; 76:1717-1734.
Carlyon RP. Shackleton TM. Comparing the fundamental
frequencies of resolved and unresolved harmonics:
evidence for two pitch mechanisms?. J Acoust. Soc. Am.
1994; 95: 3541-3554.
Carr CE. Processing of temporal information in the brain.
Ann Rev Neurosci 1993; 16: 223-243.
Cherry C. Two earsmbut one world. In: Rosenblith WA, ed,
Sensory Communication. New York: MIT Press/John
Wiley 1961; 99-117.
Chung SH. Raymond SA. Lettvin JY. Multiple meaning in
single visual units. Brain Behav Evol 1970; 3" 72-101.
Covey E. Temporal Neural Coding in Gustation. Duke
University. 1980.
de Boer E. On the ’esidue" and auditory pitch perception.
In: Keidel WD, Neff WD, eds, Hand-book of Sensory
Physiology. Berlin: Springer Verlag 1976; 479-583.
de Cheveign6 A. A pitch perception model. ICASSP 86
(Tokyo) 1986; 897-900.
de Ribaupierre F. Acoustical information processing in the
auditory thalamus and cerebral cortex. In: Ehret G,
Romand R, eds, The Central Auditory System. New
York: Oxford University Press 1997; 317-397.
Deadyler SA, Hampson RE. Ensemble activity and behavior: what’s the code?. Science 1995; 270:1316-1318.
�170
PETER CARIANI
Delgutte B. Physiological models for basic auditory
percepts. In: Hawkins H, McMullin T, Popper AN, Fay
RR, eds, Auditory Computation. New York: Springer
Verlag, 1995, 157-220.
Di Lorenzo PM, Hecht GS. Perceptual consequences of
electrical stimulation in the gustatory system. Behavioral
Neuroscience 1993; 107: 130-138.
Emmers R. Pain: A Spike-Interval Coded Message in the
Brain. New York: Raven Press 1981.
Evans EF. Place and time coding of frequency in the
peripheral auditory system: some physiological pros and
cons. Audiology 1978; 17: 369-420.
Gersmer W. Spiking neurons. In: Maass W, Bishop CM,
eds, Pulsed Neural Networks. Cambridge, Massachusetts,
USA: MIT Press 1999; xiii-xxvi.
Gesteland RC, Lettvin JY, Pitts WH. Chemical transmission
in the nose ofthe fi’og. J Physiol. 1965; 181" 525-559.
Goldstein MH Jr, Kiang NYS, Brown RM. Responses ofthe
auditory cortex to repetitive acoustic stimuli. J Acoust
Soc Am 1959; 31: 356-364.
Greenberg S, Rhode WS. Periodicity coding in cochlear
nerve and ventral cochlear nucleus. In: Yost WA,
Watson CS, eds, Auditory Processing of Complex
Sounds. Hillsdale, NJ: Lawrence Erlbaum Associates
1987; 225-236.
Hatsopoulos NG, Ojakangas CL, Donohue JP, Maynard
EM. Detection and identification of ensemble codes in
motor cortex. In: Eichenbaum HB, Davis JL, eds,
Neuronal Ensembles: Strategies for Recording and
Decoding. New York: Wiley-Liss 1998; 161-176.
Heil P. First-spike timing of auditory-nerve fibers and
comparison with auditory cortex. J Neurophysiol. 1997;
78: 2438-2454.
Hirahara T, Cariani P, Delgutte B. Representation of lowfrequency vowel formants in the auditory nerve.
Proceedings. European Speech Communication Association (ESCA) Research Workshop on The Auditory Basis
of Speech Perception. Keele University, UK, July 1519, 1996; 1-4.
Jeffi’ess LA. A place theory of sound localization. J Comp
Physiol Psychol 1948; 41" 35-39.
John ER. Switchboard vs. statistical theories of learning and
memory. Science 1972; 177: 850-864.
John ER. Representation of information in the brain. In: John
ER, ed, Machinery of the Mind. Boston, MA: Birkhauser
1990; 27-56.
John ER, Schwartz EL. The neurophysiology of information
processing and cognition. Ann Rev Psycho11978; 29: 1-29.
Kauer JS. Response patterns of amphibian olfactory bulb
neurones to odour stimulation. J Physiol 1974; 243:
695-715.
Kiang NYS. Stimulus representation in the discharge
patterns of auditory neurons. In: Tower DB, ed, The
Nervous System. New York: Raven Press 1975; 81-96.
Kiang NYS. Moxon EC. Tails of tuning curves of auditorynerve fibers. J Acoust Soc Am 1974; 55: 620-630.
Kiang NYS, Watanabe T, Thomas EC. Clark LF. Discharge
Patterns of Single Fibers in the Cat’s Auditory Nerve.
Cambridge, Massachusetts, USA: MIT Press 1965.
Kim DO, Leonard G. Pitch-period following response of cat
cochlear nucleus neurons to speech sounds. In: Duifhuis
H, Horst JW, Wit HP, eds, Basic Issues in Hearing.
London: Academic Press 1988; 252-260.
Kim DO, Molnar CE. A population study of cochlear nerve
fibers: comparison of spatial distributions of average-rate
and phase-locking measures of responses to single tones.
J Neurophysiol. 1979; 42" 16-30.
Kim DO, Sirianni JG, Chang SO. Responses of DCN-PVCN
neurons and auditory nerve fibers in unanesthetized
decerebrate cats to AM and pure tones: Analysis with
autocorrelation/power-spectrum. Hearing Res 1990; 45:
95-113.
Kozak WM, Reitboeck HJ. Color-dependent distribution of
spikes in single optic tract fibers of the cat. Vision Res
1974; 14: 405-419.
Langner G. Periodicity coding in the auditory system.
Hearing Res 1992; 60" 115-142.
Laurent G, Naraghi M. Odorant-induced oscillations in
mushroom bodies of the locust. J Neurosci. 1994; 14:
2993-3004.
Lee D, Port NL, Kruse W, Georgoupoulos AP. Neuronal
population coding: multi-electrode recordings in primate
cerebral cortex. In: Eichenbaum HB, Davis JL, eds,
Neuronal Ensembles: Strategies for Re-cording and
Decoding. New York: Wiley-Liss 1998; 117-138.
Lee S-H, Blake R. Visual form created solely from temporal
structure. Science 1999; 284:1165-1168.
Lestienne R, Strehler BL. Time structure and stimulus
dependence of precise replicating patterns present in
monkey cortical neuronal spike trains. Brain Res 1987;
43:214-238.
Lestienne R, Tuckwell HC. The significance of precisely
replicating patterns in mammalian CNS spike trains.
Neuroscience 1998; 82:315-336.
Licklider JCR. A duplex theory of pitch perception.
Experientia 1951; VII: 128-134.
Licklider JCR. Three auditory theories. In: Koch S, ed,
Psychology: A Study of a Science. Study I. Conceptual
and Systematic. New York: McGraw-Hill 1959; 41-144.
Lyon R, Shamma S. Auditory representations of timbre and
pitch. In: Hawkins H, McMullin T, Popper AN, Fay RR,
eds, Auditory Computation. New York: Springer Verlag
1995; 221-270.
MacKay DM. Self-organization in the time domain. In:
Yovitts, MC, Jacobi GT, Goldstein GD., eds, SelfOrganizing Systems 1962. Washington. DC: Spartan
Books 1962; 37-48.
Macrides F. Dynamic aspects of central olfactory
�TEMPORAL CODING IN THE AUDITORY SYSTEM
processing. In: Schwartze DM, Mozell MM, eds,
Chemical Signals in Vertebrates. New York: Plenum
1977; 207-229.
Macrides F, Chorover SL. Olfactory bulb units: activity
correlated with inhalation cycles and odor quality.
Science 1972; 175" 84-86.
Marion-Poll F, Tobin TR. Temporal coding of pheromone
pulses and trains in Manduca sexta. J Comp Physiol A
1992; 171: 505-512.
Meddis R. Hewitt MJ Virtual pitch and phase sensitivity of a
computer model of the auditory periphery. I. Pitch
identification. J Acoust Soc Am 1991; 89: 2866-2882.
Meddis R, O’Mard L. A unitary model of pitch perception. J
Acoust. Soc. Am. 1997; 102: 1811-1820.
Moore BCJ. Introduction to the Psychology of Hearing, 4th
Ed. London: Academic Press 1997; 118-121.
Morley JW, Archer JS, Ferrington DG, Rowe MJ, Turman
AB. Neural coding of complex tactile vibration. Information Processing in Mammalian Auditory and Tactile
Systems. New York: Alan R. Liss 1990; 127-140.
Morrell F. Electrical signs of sensory coding. In: Quarton
GC, Melnechuck T, Schmitt FO, eds, The Neurosciences: A Study Program. New York: Rockefeller
University Press 1967; 452-469.
Mountcastle V. The problem of sensing and the neural
coding of sensory events. In: Quarton GC, Melnechuk T,
Schmitt FO, eds, The Neurosciences: A Study Program.
New York: Rockefeller University Press 1967; 393-497.
Mountcastle V. Temporal order determinants in a somatosthetic frequency discrimination: sequential order coding.
Annals New York Acad Sci 1993; 682: 151-170.
Onoda N, Mori K. Depth distribution of temporal f’tring
patterns in olfactory bulb related to air intake cycles. J
Neurophysiol 1980; 44: 29-39.
Palmer AR. Segregation of the responses to paired vowels in
the auditory nerve of the guinea pig using autocorrelation. In: Schouten MEH, ed, The Auditory Processing of
Speech. Berlin: Mouton de Gruyter 1992; 115-124.
Perkell DH, Bullock TH. Neural Coding. Neurosciences
Research Program Bulletin 1968; 6:221-348.
Pfeiffer RR. Classification of response patterns of spike
discharges from units in the cochlear nucleus: tone-burst
stimulation. Exp Brain Res 1966; 1" 220-235.
Phillips DP. Timing of spike discharges in cat auditory
cortex neurons: implications for encoding of stimulus
periodicity. Hearing Res 1989; 40: 137-146.
Pollen DA, Gaska JP, Jacobson LD. Physiological constraints on models of visual cortical function. In: Cotterill
RMJ, ed, Models of Brain Function. Cambridge, UK:
Cambridge University Press 1989; 115-136.
Raymond SA. Effects of nerve impulses on threshold of frog
sciatic nerve fibres. J Physiol (Lond) 1979; 290: 273-303.
Reichardt W. Autocorrelation. a principle for the evaluation
of sensory information by the central nervous system. In:
Rosenblith WA, ed, Sensory Communication. New
171
York: MIT Press/John Wiley 1961; 303-317.
Reitboeck HJ Pabst M. Eckhom R. Texture description in
the time domain. In: Cotterill RMJ, ed, Computer Simulation in Brain Science. Cambridge, UK, Cambridge
University Press 1988.
Rhode WS. Interspike intervals as correlates of periodicity
pitch in cat cochlear nucleus. J Acoust Soc Am 1995; 97:
241 4-2429.
Rhode WS. Neural encoding of single-formant stimuli in
ventral cochlear nucleus of the chinchilla. Hearing Res
1998; 117: 39-56.
Rhode WS, Smith PH, Oertel D. Physiological response
properties ofcells labeled intracellularly with horseradish
peroxidase in cat ventral cochlear nucleus. J Comp
Neurol 1983; 213: 448-463.
Richmond B J, Gawne TJ. The relationship between neuronal
codes and cortical organization. In: Eichenbaum HB,
Davis JL, eds, Neuronal Ensembles: Strategies for Recording and Decoding. New York: Wiley-Liss 1998; 57-80.
Richmond BJ, Optican LM, Podell M, Spitzer H. Temporal
encoding of two-dimensional patterns by single units in
primate inferior temporal cortex. I. Response
characteristics.. J Neurophysiol 1987; 57: 132-146.
Rieke F, Warland D, de Ruyter van Steveninck R, B ialek W.
Spikes: Exploring the Neural Code. Cambridge. MA,
USA: MIT Press 1997; 395.
Rose JE. Neural correlates of some psychoacoustical
experiences. In: McFadden D, ed, Neural Mechanisms of
Behavior. New York: Springer Verlag 1980; 1-33.
Rose JE, Brugge JR, Anderson DJ, Hind JE. Phase-locked
response to low-frequency tones in single auditory nerve
fibers of the squirrel monkey. J Neuroplysiol 1967; 30:
769-793.
Ryugo DK. The auditory nerve: peripheral innervation, cell
body morphology, and central projections. In: Webster
DB, Popper AN, Fay RR, eds, The Mammalian Auditory
Pathway: Neuroanatomy. New York: Springer-Verlag
1992; 23-65.
Shackleton TM, Carlyon RP. The role of resolved and
unresolved harmonics in pitch perception and frequency
modulation discrimination. J Acoust Soc Am 1994; 95"
3529-3540.
Shadlen MN, Newsome WT. Noise. neural codes and cortical organization. Curr Op Neurobiol 1994; 4: 569-579.
Shadlen MN, Newsome WT. The variable discharge of
cortical neurons: implications for connectivity.
Computation. and information coding. J Neurosci 1998;
18: 3870-3896.
Siebert WM. Stimulus transformations in the peripheral
auditory system. In: Kollers PA, Eden M, eds,
Recognizing Patterns. Cambridge, Massachusetts, USA:
MIT Press 1968; 104-133.
Siebert WM. Frequency discrimination in the auditory
system: place or periodicity mechanisms? Proc IEEE
1970; 58: 723-730.
�172
PETER CARIANI
Singer W. Search for coherence: a basic principle of cortical
self-organization. Concepts Neurosci 1990; 1" 1-26.
Singer W. Development and plasticity of cortical processing
architectures. Science 1995; 270: 758-764.
Singer W. Putative functions of temporal correlations in
neocortical processing. In: Koch C, Davis CL, eds,
Large-Scale Neuronal Theories of the Brain. Cambridge,
MA, USA: MIT Press 1995; 201-237.
Slaney M, Lyon RF. On the importance oftime---a temporal
representation of sound. In: Cooke M, Beet S, Crawford
M, eds, Visual Representations of Speech Signals. New
York: Wiley 1993; 95-118.
Srulovicz P, Goldstein JL. Central spectral patterns in aural
signal analysis based on cochlear neural timing and
frequency filtering. IEEE, Tel Aviv. Israel, 1977.
Steinschneider M. Reser DH. Fishman YI. Arezzo J. Click
train encoding in primary auditory cortex of the awake
monkey: Evidence for two mechanisms subserving pitch
perception. J Acoust Soc Am 1998; 104: 2395-2955.
Stevens SS. Sensory power functions and neural events. In:
Loewenstein WR, ed, Principles of Receptor Physiology.
Berlin: Springer-Verlag 1971; 226-242.
Tank DW, Hopfield JJ Neural computation by concentrating
information in time. Proc Natl Acad Sci USA 1987; 84:
1896-1900.
Thatcher RW. John ER. Functional Neuroscience. Vol. I.
Foundations of Cognitive Processes. Hillsdale, New
Jersey, USA: Lawrence Erlbaum 1977; 382.
Troland LT. The psychophysiology of auditory qualities and
attributes. 1929; 2: 28-58.
Uttal WR. The Psychobiology of Sensory Coding. New
York: Harper Row 1973.
Uttal WR. An Autocorrelation Theory of Form Detection.
New York: Wiley 1975.
van Noorden L. Two channel pitch perception. In: Clynes
M, ed, Music. Mind and Brain. New York: Plenum
1982; 251-269.
Wasserman GS. Isomorphism. task dependence, and the
multiple meaning theory of neural coding. Biol Signals
1992; 1:117-142.
Wever EG. Theory of Hearing. New York: Wiley 1949.
Young ED. Response characteristics of neurons in the
cochlear nuclei. In: Berlin C, ed, Hearing Science. San
Diego, CA, USA: College Hill 1984; 423-460.
Young RA. Some observations on temporal coding of color
vision: psychophysical results. Vision Res 1977; 17: 957.
�
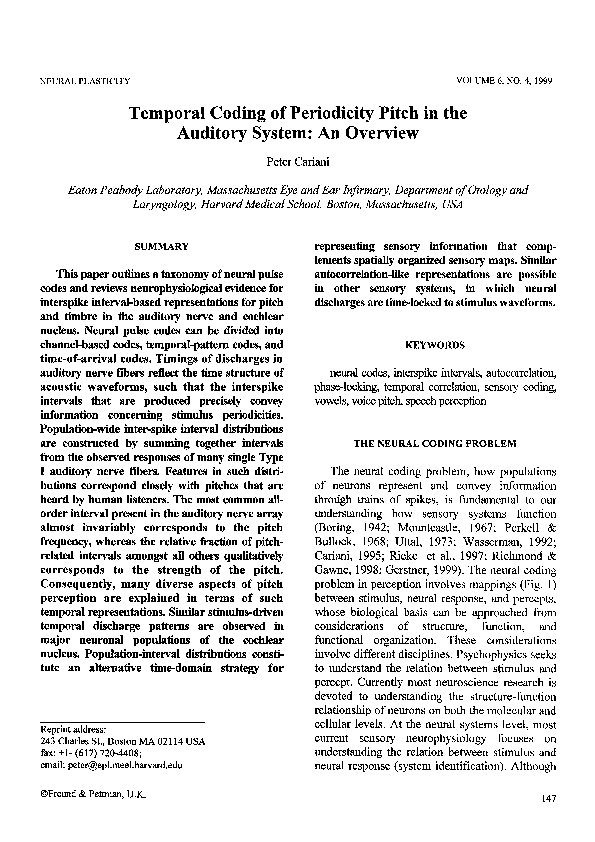
 Peter Cariani