 Mari-Anne Newman
To study the mechanism of resistance developed in rose cultivar High and Peace against Podosphaera pannosa was pretreated with SAR chemicals viz. salicylic acid, β-aminobutyric acid, calcium silicate, potassium bicarbonate, phosphoric acid, dipotassium orthophosphate and potassium silicate were assayed at six sampling intervals of 0 (at time of spray), 2, 4, 6 days, at bud formation and one month after bud formation for various biochemical constitutions like reducing and non-reducing sugars, total phenols, peroxidase and polyphenol oxidase activity and PAL activity. The results revealed that the dipotassium orthophosphate treated rose leaves developed highest amount of the reducing sugar (146.33 µg/g) with passage of time which was followed by salicylic acid (133.72 µg/g), β-aminobutyric acid (128.50 µg/g) and potassium silicate (124.00µg/g). While the lowest amount of reducing sugar was recorded in calcium silicate (117.67 µg/g) including control (115.33 µg/g). However, dipotassium orthophosphate treated rose leaves contain highest amount of the non-reducing sugar (65.00 µg/g) followed by salicylic acid (52.00 µg/g), β-aminobutyric acid (49.33 µg/g), potassium silicate (41.00 µg/g) and potassium bicarbonate (37.00 µg/g) while least amount of non-reducing sugar was found in calcium silicate (31 µg/g) treated plants followed by phosphoric acid (35.00 µg/g) at 6 ~ 1234 ~ th day of spray. The total phenol (137.67 µg/g) was higher in dipotassium orthophosphate and salicylic acid with 130.72 µg/g irrespective of sampling intervals and different plant stages in comparison to rest of the treatments. maximum polyphenol activity in dipotassium orthophosphate treated rose leaves (0.261) followed by salicylic acid (0.242), βaminobutyric acid (0.218) and potassium silicate (0.196) while lowest in calcium silicate (0.112) followed by phosphoric acid (0.145) and potassium bicarbonate (0.175). revealed the effectiveness of dipotassium orthophosphate in enhancing the peroxidase activity being highest (0.416) followed by salicylic acid (0.390), β-aminobutyric acid (0.360), potassium silicate (0.343) and potassium bicarbonate (0.313). While the least activity registered in calcium silicate (0.225). The highest PAL activity registered in dipotassium orthophosphate (0.586) followed by salicylic acid (0.523), β-aminobutyric acid (0.480) and potassium silicate (0.438) and potassium bicarbonate (0.403). While least PAL activity was observed in treatment with calcium silicate (0.287).
Academia.edu no longer supports Internet Explorer.
To browse Academia.edu and the wider internet faster and more securely, please take a few seconds to upgrade your browser.
Silicon-Induced Changes in Antifungal Phenolic Acids, Flavonoids, and Key Phenylpropanoid Pathway Genes during the Interaction between Miniature Roses and the Biotrophic Pathogen Podosphaera pannosa
2011, PLANT PHYSIOLOGY
Free related PDFsRelated papers

Resistance Reactions in Rose Leaves Against Powdery Mildew (Podosphaera Pannosa)
Acta Horticulturae, 2007
Free PDF
The role of silicon fertilization in the synthesis of phenolic compounds on chestnut plants infected with P. cinnamomi and C. parasitica
Journal of Plant Diseases and Protection, 2019
Free PDF
Some biochemical defense responses enhanced by soluble silicon in bitter gourd-powdery mildew pathosystem
Australasian Plant Pathology, 2016
Free PDF
Suppressive effects of a polymer sodium silicate solution on powdery mildew and root rot diseases of miniature rose
Sodium silicate was dissolved in water in either a monomer form or polymer form; the effects of both forms of sodium silicate aqueous solution on rose powdery mildew and root rot diseases of miniature rose were examined. Both forms of sodium silicate aqueous solution were applied to the roots of the miniature rose. Potassium silicate aqueous solution was used as a control and was compared to the effect of sodium silicate aqueous solution. The polymer sodium silicate aqueous solution was the most effective treatment against both powdery mildew and root rot diseases. Moreover, no inhibition effects of silicate solutions were observed in vitro on Pythium helicoides, the causal pathogen of rose root rot disease. The silicon contents in the roots of the miniature rose treated with polymer sodium silicate were significantly greater than that in plants treated with monomer sodium silicate. In conclusion, the suppressive effects of sodium silicate in the polymer form were confirmed against powdery mildew and root rot diseases of the miniature rose.
Free PDF


Management of Rose Powdery Mildew by Nanosilica, Diatomite and Bentocide
Recent trends in integrated pest management suggest that certain natural fungicides have positive effects on plant growth and disease management. This study was conducted to evaluate the possibility of using nanosilica, diatomite and bentocide instead of commercial fungicides against powdery mildew of rose. Silica nanoparticles and diatomite were applied at various concentrations to study the antifungal activity of each concentration. Application with either nanosilica at 500 mg/l water, bentocide at 2500 mg/l water, the fungicide (Penconazole) at 0.25 ml/l water or diatomite at 3000 mg/ l showed significant reductions in disease severity comparing with the other treatments. Other treatments, nanosilica at 125 and 250 mg/l water and diatomite at 1000 and 2000 mg/l water, recorded moderate reduction in disease severity. Microscopic observations revealed that silica nanoparticles caused damage effects on fungal structures of the pathogen. Based on RT-PCR, rose plants treated with nanosilica, bentocide and diatomite exhibited increased expression of phenylalanine ammonia lyase (PAL) gene.
Free PDF
Control of Powdery Mildew in Cut Roses using Natural Products in the Greenhouse
Floriculture and Ornamental Biotechnology, 2009
Roses grown under greenhouse cultivation are commonly affected by diseases and regular fungicide applications are commonly used. The aim of this research was to identify natural products that can substitute and reduce the health and environmental impacts of typical chemical treatments in the control of powdery mildew [(Podosphaera pannosa (Wallr. Fr.) de Bary] and grey mould (Botrytis cinerea Pers.). Treatments were applied in the greenhouse on the cut rose cultivars Sunluck (Gold Strike®) and Nirpbredy (New Fashion®) growing in a soilless system. Oregano and clove essential oil at 0.5 ml/l (an emulsifier was added) and sodium bicarbonate (NaHCO3) at 4 g/l were sprayed on rose plants to runoff. The controls were untreated roses and a standard chemical control (the fungicides Dinocap, Triadimenol, Dimethomorph+Sulphur, Bupirimate, Dithianon, Iprodione and Thiram) was applied in rotation. Sprays were applied every 7-10 days after the first symptoms of disease appeared. Disease incidence was checked on 100 leaflets and symptoms were evaluated using a scale from 0 (no disease) to 7 (76-100% infection). At three different times (June and November 2005 and January 2006) biometric data (stem height, stem diameter, stem flexibility, flower diameter, number of petals/flower and thorniness) and colorimetric analysis of the leaves were evaluated in order to determine the effect of treatments on cut rose quality. Treatment with essential oils and NaHCO3 was able to control the incidence and the severity of powdery mildew on roses. Ambient infection of grey mould was low and comparisons between treatments were not possible. Significant differences among the chemical and natural product treatments were found for all traits examined. Although NaHCO3 treatment controlled powdery mildew to a greater extent than essential oils, it resulted in slight phytotoxicity. These results indicate the potential use of natural products to control powdery mildew of roses and could be a good alternative to chemical fungicides. However, differences in response to powdery mildew depend on the cultivar susceptibility, period of treatments and level of control needed.
Free PDF
The mental health impact of COVID-19: the need for community interventions and collaboration for recovery
Academia Medicine, 2024
Background: Since 2019, the COVID-19 epidemic has spread across the world, affecting millions of individuals on physical, mental, and socioeconomic levels. Materials and methods: This qualitative study aims to map out the mental health consequences of the COVID-19 pandemic and suggest recovery strategies based on analyzing COVID-19 mental health and psychosocial impact-related comments on social/news media, participant’s observations, and participant action research. The results and suggested recovery strategies were triangulated with literature survey. Results: In COVID sufferers, neuropsychiatric symptoms lasting months were noted while some went on to have a relapse of psychological or neurological conditions. In the general population, common consequences included common mental health disorders, changing patterns of substance abuse particularly alcohol, and increased domestic violence. Family relationships and interactions generally improved but in a minority had strained dynamics. Vulnerable groups included the elderly, women, youth, children, disabled, frontline and health workers, minorities, and severely mentally ill. At the community level, there were signs of collective (mass) hysteria from panic buying to conspiracy theories, public shaming, fake news, and disinformation spreading on social media and mass protests. There were also positive effects such as better understanding of bio-knowledge, interventions and discoveries, online learning, gratitude toward health-care workers, increased community and family cohesion, reduction in road traffic accidents, and drop in other respiratory infections with their resultant morbidity and mortality. Conclusion: Given the widespread mental health consequences of the COVID-19 pandemic, a community-based approach is suggested while treating more severe mental disorders at the primary care or specialist level.
Free PDF

Silicon-Induced Changes in Antifungal Phenolic Acids,
Flavonoids, and Key Phenylpropanoid Pathway Genes
during the Interaction between Miniature Roses and the
Biotrophic Pathogen Podosphaera pannosa1[W]
Radhakrishna Shetty*, Xavier Fretté, Birgit Jensen, Nandini Prasad Shetty, Jens Due Jensen,
Hans Jørgen Lyngs Jørgensen, Mari-Anne Newman, and Lars Porskjær Christensen
Department of Plant Biology and Biotechnology, Faculty of Life Sciences, University of Copenhagen, DK–1871
Frederiksberg C, Denmark (R.S., B.J., N.P.S., J.D.J., H.J.L.J., M.-A.N.); Institute of Chemical Engineering,
Biotechnology, and Environmental Technology, Faculty of Engineering, University of Southern Denmark,
DK–5230 Odense M, Denmark (R.S., X.F., L.P.C.); and Plant Cell Biotechnology Department, Central Food
Technological Research Institute, Mysore 570 020, India (N.P.S.)
Application of 3.6 mM silicon (Si+) to the rose (Rosa hybrida) cultivar Smart increased the concentration of antimicrobial
phenolic acids and flavonoids in response to infection by rose powdery mildew (Podosphaera pannosa). Simultaneously, the
expression of genes coding for key enzymes in the phenylpropanoid pathway (phenylalanine ammonia lyase, cinnamyl
alcohol dehydrogenase, and chalcone synthase) was up-regulated. The increase in phenolic compounds correlated with a 46%
reduction in disease severity compared with inoculated leaves without Si application (Si2). Furthermore, Si application
without pathogen inoculation induced gene expression and primed the accumulation of several phenolics compared with the
uninoculated Si2 control. Chlorogenic acid was the phenolic acid detected in the highest concentration, with an increase of
more than 80% in Si+ inoculated compared with Si2 uninoculated plants. Among the quantified flavonoids, rutin and
quercitrin were detected in the highest concentrations, and the rutin concentration increased more than 20-fold in Si+
inoculated compared with Si2 uninoculated plants. Both rutin and chlorogenic acid had antimicrobial effects on P. pannosa,
evidenced by reduced conidial germination and appressorium formation of the pathogen, both after spray application and
infiltration into leaves. The application of rutin and chlorogenic acid reduced powdery mildew severity by 40% to 50%, and
observation of an effect after leaf infiltration indicated that these two phenolics can be transported to the epidermal surface. In
conclusion, we provide evidence that Si plays an active role in disease reduction in rose by inducing the production of
antifungal phenolic metabolites as a response to powdery mildew infection.
Miniature potted roses (Rosa hybrida) have become
an increasingly popular ornamental crop for the floriculture industry (Pemberton et al., 2003). Powdery
mildew caused by Podosphaera pannosa is one of the
most widespread diseases of potted roses (Horst, 1983;
Eken, 2005), and the white colonies, together with leaf
distortion, curling, and premature defoliation caused
by the pathogen, lead to poor marketing value (Eken,
2005). Powdery mildew is typically managed through
the use of synthetic fungicides (Horst, 1983; Eken,
1
This work was supported by Prydplantepakkens Projekt 2
(Direktoratet for FødevareErhverv), the Research School for Horticultural Science, Department of Plant Biology and Biotechnology,
Faculty of Life Sciences, University of Copenhagen, Producentforeningen for Prydplanter, Danske Prydplanter, and the Danish Institute of Agricultural Sciences, Department of Horticulture.
* Corresponding author; e-mail rsh@life.ku.dk.
The author responsible for distribution of materials integral to the
findings presented in this article in accordance with the policy
described in the Instructions for Authors (www.plantphysiol.org) is:
Radhakrishna Shetty (rsh@life.ku.dk).
[W]
The online version of this article contains Web-only data.
www.plantphysiol.org/cgi/doi/10.1104/pp.111.185215
2005). However, environmental considerations have
necessitated increasing restrictions on the use of pesticides; therefore, eco-friendly production methods for
plant disease suppression need to be developed. One
of the most promising methods is to increase the level
of silicon (Si) in the growth medium (or soil), as this
has been able to reduce the growth of a number of
plant pathogens, such as Magnaporthe oryzae infecting
rice (Oryza sativa; Rodrigues et al., 2001, 2004), Blumeria graminis f. sp. tritici infecting wheat (Triticum
aestivum; Bélanger et al., 2003; Rémus-Borel et al.,
2005), and Podosphaera fuliginea infecting cucumber
(Cucumis sativus; Fawe et al., 1998). Recently, we have
shown that this effect is also seen in roses, since
application of 3.6 mM Si significantly reduced powdery mildew severity (Shetty et al., 2011).
Si is the second most abundant element in the crust
of the Earth and is regarded as a semiessential nutrient
for plant growth (Epstein, 1994). Si is readily absorbed
by plant roots in the form of silicic acid [Si(OH)4; Ma
and Yamaji, 2006]. The soluble silicic acid is transported through the xylem to the vegetative tissues,
concentrated through transpiration, polymerized as
2194 Plant PhysiologyÒ, December 2011, Vol. 157, pp. 2194–2205, www.plantphysiol.org Ó 2011 American Society of Plant Biologists. All Rights Reserved.
Silicon Induces Changes in Rose Polyphenols
amorphous Si, and deposited in intracellular and intercellular spaces (Ma and Takahashi, 2002). We demonstrated that application of 3.6 mM Si in roses, which
is considered a nonaccumulator of Si, increased leaf Si
content to 14 ppm in the dry matter compared with no
application of Si (Si content of 3 ppm), and confocal
microscopy showed that Si deposition mainly occurred in the apoplast, particularly in epidermal cell
walls (Shetty et al., 2011). Earlier studies on Si have
documented the ability of Si to alleviate abiotic and
biotic stress by acting as a physical barrier to infection
and also by inducing active defense mechanisms (Ma,
2004; Fauteux et al., 2005). In accordance with this,
Shetty et al. (2011) found that the Si-induced protection
against P. pannosa in roses was accompanied by the
increased formation of papillae and fluorescent epidermal cells (FEC) as well as the accumulation of
callose and hydrogen peroxide, especially at the sites
of penetration and in FEC, which are believed to
represent the hypersensitive response.
Due to the threat of infection by pathogens, plants
have evolved and developed a multitude of chemical
and structural barriers for their protection. Various
antimicrobial compounds, which are synthesized by
plants after infection, have been discovered (Osbourn,
1996). One group of compounds, phytoalexins, is
formed de novo after invasion, whereas others, phytoanticipins, are preformed compounds that may undergo postinfection modifications in order to express
full toxicity (Barz et al., 1990). Secondary metabolites
of the phenylpropanoid pathway such as phenolic
acids and flavonoids are well-known examples of
compounds that may be produced by plants as phytoanticipins or phytoalexins in order to fight invading
microorganisms (Dixon and Paiva, 1995; Dixon et al.,
2002). Rapid and early accumulation of phenolic compounds at infection sites is a characteristic of phenolicbased defense responses. At the infection sites, the
production of toxic phenolic compounds may result in
effective inhibition of the pathogen (de Ascensao and
Dubery, 2003). Production of such metabolites may
also be involved in the increased formation of FEC in
Si-treated roses after P. pannosa inoculation (Shetty
et al., 2011). Only a few secondary metabolites have
been implicated in Si-induced resistance against fungal diseases (i.e. flavonoid phytoalexins in cucumber
as well as diterpenoid phytoalexins in rice; Fawe et al.,
1998; Rodrigues et al., 2004; Rémus-Borel et al., 2005).
Transcription analysis of genes encoding enzymes in
the biosynthetic pathways of secondary metabolites,
especially during the early stages of infection, could
help explain the relationship between secondary metabolites and Si-mediated resistance. Transcriptome
analysis in wheat and Arabidopsis (Arabidopsis thaliana) showed that inoculation of both Si-treated and
untreated plants with powdery mildew induced alterations in expression levels of several hundred of genes
(Fauteux et al., 2005; Chain et al., 2009). On the other
hand, Si application alone only played a limited role in
the transcriptomic changes in wheat, Arabidopsis, and
Plant Physiol. Vol. 157, 2011
tomato (Solanum lycopersicum), and no effect was seen
for genes related to secondary metabolism (Fauteux
et al., 2005; Chain et al., 2009; Ghareeb et al., 2011).
Investigations of modern rose cultivars have shown
that they are a rich source of polyphenols in both
leaves and petals (Biolley et al., 1994a, 1994b; Helsper
et al., 2003). Our hypothesis is that secondary metabolites of the phenylpropanoid pathway such as flavonoids
and phenolic acids are important defense compounds in roses against powdery mildew, acting either
as phytoanticipins or phytoalexins, and that application of Si in the form K2SiO3 increases the production of these phenolic compounds.
RESULTS
Phenolic Acids and Flavonol Glycosides in Rose Leaves
Several phenolic acids and flavonoids were identified in extracts of rose leaves (Supplemental Fig. S1).
Typical HPLC chromatograms at 320 and 360 nm of an
aqueous methanol extract of the leaves are shown in
Supplemental Figure S2 and Figure 1, respectively.
Based on the UV spectra, the compounds could be
grouped into (1) caffeic acid derivatives, with an
absorption band centered around 325 nm with a
shoulder at around 300 nm, and (2) flavonol glycosides, with lmax values between 343 to 364 nm and 253
to 265 nm for peaks in bands I and II, respectively
(Table I). The UV absorptions of compounds 2 and 3
clearly indicated that these compounds were derivatives of caffeic acid, which was also confirmed by their
liquid chromatography-mass spectrometry (LC-MS)
data. Compounds 2 and 3 had a pseudomolecular ion
[M–H]– at mass-to-charge ratio (m/z) 353, compatible
with caffeoylquinic acids, and were identified as 3-Ocaffeoylquinic acid (neochlorogenic acid) and 5-Ocaffeoylquinic acid (chlorogenic acid), respectively.
Compounds 4 to 14 showed typical UV spectra of
flavonol glycosides, which were also confirmed by
their LC-MS data (Table I). Compounds 4 to 12 all gave
an ion at m/z 301 corresponding to the aglycone
quercetin. Compounds 8 and 10 showed a pseudomolecular ion [M–H]– at m/z 463, clearly indicating that
these compounds are quercetin hexose molecules, and
they were identified as quercetin-3-O-galactoside (hyperoside) and quercetin-3-O-glucoside (isoquercitrin),
respectively. Compounds 4 and 9 showed pseudomolecular ions [M–H]– at m/z 625 and 609, respectively, as
well as ions at m/z 463 and 301 corresponding to the
loss of two Glc moieties in compound 4 and a Rha and
Glc moiety in compound 9. Consequently, compounds
4 and 9 were identified as quercetin-3-O-gentiobioside
and quercetin-3-O-rutinoside (rutin), respectively
(Table I). Compound 11 was identified as quercetin-3O-arabinoside (avicularin) based on its pseudomolecular ion [M–H]– at m/z 433, which clearly indicated
that it was a quercetin pentose. The pseudomolecular
ion [M–H]– at m/z 447 for compound 12 indicated that
2195
Shetty et al.
Figure 1. Typical HPLC-PDA chromatograms of aqueous 80% methanol extracts of leaves of rose at 360 nm for Si2
uninoculated (A), Si+ uninoculated (B), Si2 inoculated (C), and Si+ inoculated (D). Compounds are as follows: 1, unknown
phenolic acid; 2, 3-O-caffeoylquinic acid (neochlorogenic acid); 3, 5-O-caffeoylquinic acid (chlorogenic acid); 4, quercetin-3O-gentiobioside; 5, quercetin diglycoside; 6, quercetin derivative; 7, quercetin pentoside; 8, quercetin-3-O-galactoside
(hyperoside); 9, quercetin-3-O-rutinoside (rutin); 10, quercetin-3-O-glucoside (isoquercitrin); 11, quercetin-3-O-arabinoside
(avicularin); 12, quercetin-3-O-rhamnoside (quercitrin); 13, kaempferol-3-O-pentoside; and 14, kaempferol-3-O-rhamnoside
(afzelin). The chromatographic conditions and the validation of the HPLC method are described in “Materials and Methods.”
mAU, Milliabsorbance units.
it was a quercetin methyl-pentose; thus, it was identified as quercetin-3-O-rhamnoside (quercitrin).
Compounds 13 and 14 both gave an ion at m/z 285
corresponding to the aglycone kaempferol. Compound 14 showed a pseudomolecular ion [M–H] – at
m/z 431, clearly indicating that it was a kaempferol
methyl-pentose; thus, it was identified as kaempferol3-O-rhamnoside (afzelin).
Effects of Si Application and Inoculation on the
Concentration of Phenolic Acids
The concentrations of all phenolic acids were unaffected by Si treatment at 0 h after inoculation (hai).
However, at 24 to 120 hai, the concentrations of total
phenolic acids, chlorogenic acid, neochlorogenic acid,
and an unknown phenolic acid increased in the inoculated Si+ and Si2 compared with uninoculated Si2
and Si+ leaves (Fig. 2; Supplemental Table S1). Furthermore, Si+ inoculated leaves had a higher level of
phenolic acids than Si2 inoculated leaves at 24 to 120
2196
hai, except for an unknown phenolic acid at 24 and 72
hai. While the total concentration of total phenolic
acids, chlorogenic acid, and neochlorogenic acid increased at 24 to 120 hai in Si+ inoculated leaves, the
concentration of total phenolic acids and chlorogenic
acid peaked at 24 hai in Si2 inoculated leaves. For the
uninoculated Si2 and Si+ leaves, the concentrations of
phenolic acids did not change over time, except for
chlorogenic acid and neochlorogenic acid at 24 and 72
hai, respectively, with a higher level in Si+ uninoculated than in Si2 uninoculated leaves. For all treatments and time points, chlorogenic acid occurred at
the highest concentrations and made up more than
80% of the total phenolic acids in most cases (Supplemental Table S1).
Effects of Si Application and Inoculation on the
Concentration of Flavonoids
The total concentrations of all flavonoids were generally unaffected by Si treatment at 0 hai (Fig. 3;
Plant Physiol. Vol. 157, 2011
Silicon Induces Changes in Rose Polyphenols
Table I. LC-PDA-MS analysis (UV spectra, characteristic ions, and molecular masses) of phenolic acids and flavonoids in aqueous 80% methanol
extracts of leaves of rose
Data represent results from the analysis of samples from two independent experiments, each with three independent extractions. Compounds
listed here were detected in all samples.
Peak
No.a
Rt
LC-MS (Atmospheric Pressure Chemical
Ionization, Negative Ion Mode)
b
HPLC-PDA, UV
Spectra, lmax
min
m/z (% base peak)
nm
1
2
10.5
12.4
347 [M–H]– (56), 301 (52), 139 (100)
353 [M–H]– (100), 191 (18), 179 (15)
296sh,c 323
302sh, 329
3
18.6
353 [M–H]– (100), 325 (29), 191 (19)
298sh, 325
4
5
6
7
8
9
10
11
12
13
14
25.6
31.3
41.8
42.9
44.7
47.2
48.3
54.7
56.5
63.5
66.0
625 [M–H]– (100), 463 (28), 301 (9)
609 [M–H]– (100), 447 (21), 301 (8)
615 [M–H]– (100), 493 (4), 463 (7), 441 (9), 301 (24)
433 [M–H]– (7), 301 (100)
463 [M–H]– (100), 301 (6)
609 [M–H]– (100), 463 (67), 301 (19)
463 [M–H]– (100), 301 (22)
433 [M–H]– (100), 301 (7)
447 [M–H]– (100), 301 (10)
417 [M–H]– (100), 285 (10)
431 [M–H]– (100), 285 (9)
253, 263sh, 353
265, 284sh, 348
262, 291sh, 352
255, 285sh, 348sh, 362
253, 299sh, 356sh, 364
256, 263sh, 298sh, 354
256, 263sh, 299sh, 354
256, 263sh, 301sh, 352
256, 262sh, 305sh, 348
264, 294sh, 331sh, 345
263, 296sh, 324sh, 343
Compound
Unknown phenolic acid
3-O-Caffeoylquinic acid
(neochlorogenic acid)d
5-O-Caffeoylquinic acid
(chlorogenic acid)d
Quercetin-3-O-gentiobiosidee
Quercetin diglycosidee,f
Quercetin derivativef
Quercetin pentosidef
Quercetin-3-O-galactoside (hyperoside)d
Quercetin-3-O-rutinoside (rutin)d
Quercetin-3-O-glucoside (isoquercitrin)d
Quercetin-3-O-arabinoside (avicularin)d
Quercetin-3-O-rhamnoside (quercitrin)d
Kaempferol-3-O-pentosidef
Kaempferol-3-O-rhamnoside (afzelin)d
b
c
a
Peak numbers correspond to the compound numbers in Figure 1 and Supplemental Figure S2.
Rt, Retention time on HPLC.
sh,
d
e
Shoulder.
Conclusively identified by comparison with authentic standard.
Identification based on comparison of retention time, UV, and
f
LC-MS data with data from the literature (Masada et al., 2009).
Tentatively identified by UV and mass spectral data.
Supplemental Table S2). However, at 24 to 120 hai,
significant changes in the concentrations of flavonoids occurred, depending on treatment and time
point, except for a quercetin diglycoside (compound
5; Table I), where all treatments displayed a similar
low content at all time points (Supplemental Table
S2). For the other detected flavonoids, four main
patterns were observed. (1) From 24 to 120 hai, the
total content of flavonoids for Si+ inoculated leaves
was higher than for Si2 inoculated leaves, in which
the concentration was higher than for both the uninoculated treatments. The same pattern was seen for a
quercetin derivative (compound 6; Table I) at 24 hai
(Supplemental Table S2). (2) For several of the detected
flavonoids (e.g. avicularin and quercitrin), the inoculated leaves for both treatments had similar concentrations, especially at 24 and 72 hai, and these
concentrations were higher than for the uninoculated
leaves. (3) In several cases, especially at 120 hai, the
concentrations in uninoculated Si+ and Si2 leaves and
inoculated Si2 leaves did not differ, but the levels
were lower than for the inoculated Si+ leaves (e.g. for
hyperoside, rutin, and avicularin). (4) The levels
of quercetin derivative, avicularin, quercitrin,
and kaempferol-3-O-pentoside followed the order
Si+ inoculated . Si2 inoculated . Si+ uninoculated .
Si2 uninoculated. The concentration of total flavonoids and the 11 quantified flavonoids did not change
over time (0–120 hai) for the uninoculated Si2 and
Si+ leaves, except that the levels of avicularin and
quercitrin in Si+ uninoculated leaves were higher at 24
hai and that the quercetin derivatives, kaempferol3-O-pentoside and afzelin, were higher at 72 hai comPlant Physiol. Vol. 157, 2011
pared with Si2 uninoculated (Fig. 3F; Supplemental
Table S2).
Disease Reduction Mediated by Si Application
Assessment of disease on the remaining inoculated
plants from the metabolite experiment showed that
Si+ plants had a disease severity score of 48.1% compared with 81.4% of Si2 plants (P , 0.001). The Si
application thus resulted in a 46% disease reduction
(Supplemental Fig. S3).
Disease Reductions after Chlorogenic Acid and
Rutin Treatment
Treatment of roses either by spray application or leaf
infiltration with 1 mg mL21 chlorogenic acid or rutin
resulted in an overall reduction in powdery mildew
severity (P , 0.001) compared with their respective
water-treated controls at 9 d after inoculation (dai; Fig.
4). The application of chlorogenic acid decreased the
disease severity in both sprayed and infiltrated leaves
by 51%. Likewise, rutin also reduced the disease
severity following both treatments, although at
slightly lower levels (41% for spraying and 44% for
infiltration). For both types of treatments, chlorogenic
acid was more effective than rutin (P , 0.001).
Table II shows results from the quantitative brightfield and epifluorescence microscopy study of the
interaction at 72 hai after spraying or infiltration
with chlorogenic acid, rutin, or water (control). The
different infection steps are calculated based on the
2197
Shetty et al.
Figure 2. Contents of total phenolic acids (A) and 5-O-caffeoylquinic acid (chlorogenic acid; B) in leaf extracts of rose from
plants either treated with (Si+) or without (Si2) Si followed by either inoculation with P. pannosa or no inoculation. Data
represent results from one experiment, and each observation represents the mean from three extractions. All values are presented
as means 6 SE. Means within each time point are comparable, and bars marked by different letters are significantly different.
Further information on the results from this experiment is given in Supplemental Table S1. The findings of this experiment were
confirmed in a second independent experiment.
number of germinated conidia. The percentages of
germinated conidia (having a primary germ tube)
and of conidia forming appressoria were reduced
by both spray application and infiltration of the
phenolics compared with the water controls. On the
other hand, penetration and formation of haustoria
and elongating secondary hyphae (ESH) were not
altered in plants treated with either phenolic compound. None of the host responses examined (formation of papillae and FEC) was affected by chlorogenic
acid or rutin by either application method.
Expression of Phenylpropanoid Pathway Genes
The expression of genes encoding the key enzymes
phenylalanine ammonia lyase (PAL), cinnamyl alcohol
dehydrogenase (CAD), and chalcone synthase (CHS)
in the phenylpropanoid pathway were often affected
both by Si application and powdery mildew inoculation (Table III). Compared with Si2 uninoculated
leaves, the transcript levels of PAL were elevated at
24 hai for the treatments Si2 inoculated, Si+ uninoculated, and Si+ inoculated. However, at 72 hai, elevation of PAL transcript was only found for Si+
inoculated plants, with a 39-fold increase followed
by a decrease to only a 3-fold up-regulation at 120 hai.
For CHS, elevated transcript levels were seen for all
three treatments at 24 and 72 hai. In contrast, accumulation of CHS transcript was only seen for the two
Si+ treatments at 120 hai. The transcription of CAD
followed a pattern differing markedly from the two
other genes. Thus, CAD only showed elevated transcript levels in the Si+ inoculated plants at 24 and 72
hai, while levels were elevated for all three treatment
at 0 hai (i.e. immediately after inoculation).
2198
DISCUSSION
Active Role of Si in Disease Resistance of Rose:
Induction of the Production of Antifungal Phenolics
against Powdery Mildew Infection
This study provides evidence that root application
of 3.6 mM Si+ to the miniature rose cv Smart increases
the concentration of phenolic acids and flavonoids in
response to P. pannosa infection, some of which, to our
knowledge, have not been reported in roses before.
This was accompanied by an increased expression of
genes encoding enzymes in the phenylpropanoid
pathway. This was particularly prominent in Si+ inoculated plants, but there were also elevated transcript
levels in Si2 inoculated plants. Thus, according to the
definition of Ghareeb et al. (2011), most of the responses observed represent induced resistance. However, the contents of phenolics and flavonoids represent
priming, since Si+ uninoculated and Si2 uninoculated
plants were not different. The level of potassium was
different between the two nutrient solutions, due to
the extra potassium present in SiKal compared with
the control solution. It was only possible to partly
compensate for the extra potassium present in the 3.6
mM Si treatment without affecting other nutrients.
Therefore, it cannot be ruled out that the extra potassium potentially could have some influence on the
level of disease, but this appears less important compared with the effect of Si. Thus, there was a very clear
increase in Si content in the leaves where the pathogen
was inhibited (Shetty et al., 2011). Furthermore, preliminary experiments showed that the content of other
nutrients in rose leaves, including potassium, was not
significantly different between plants receiving 0 or 3.6
mM Si (data not shown).
Plant Physiol. Vol. 157, 2011
Silicon Induces Changes in Rose Polyphenols
Figure 3. Contents of total flavonoids and selected flavonoids in leaf extracts of rose from plants either treated with (Si+) or
without (Si2) Si followed by either inoculation with P. pannosa or no inoculation. A, Total flavonoids. B, Quercetin-3-Ogalactoside (hyperoside). C, Quercetin-3-O-rutinoside (rutin). D, Quercetin-3-O-arabinoside (avicularin). E, Quercetin-3-Orhamnoside (quercitrin). F, Kaempferol-3-O-rhamnoside (afzelin). Data represent results from one experiment, and each
observation represents the mean from three extractions. All values are presented as means 6 SE. Means within each time point are
comparable, and bars marked by different letters are significantly different. Further information on the results from this
experiment is given in Supplemental Table S2. The findings of this experiment were confirmed in a second independent
experiment.
Plant Physiol. Vol. 157, 2011
2199
Shetty et al.
Figure 4. Powdery mildew severity in leaves of rose after spraying or
leaf infiltration with chlorogenic acid and rutin. Control plants were
treated with water. Disease severity was scored 9 d after inoculation
with P. pannosa. Data represent results from one experiment, and each
observation represents the mean from 22 leaves. All values are
presented as means 6 SE. Means within each application method are
comparable, and bars marked with different letters are significantly
different. The findings of this experiment were confirmed in a second
independent experiment.
All phenylpropanoids are derived from cinnamic
acid, which is formed from Phe by the action of PAL.
PAL is the branch-point enzyme between primary
metabolism and the branch of secondary metabolism
leading to the phenylpropanoid pathway, which is
considered to be one of the most important metabolic
pathways due to its responsibility for the synthesis of a
large range of secondary metabolites, including phenolic acids and flavonoids (Dixon and Paiva, 1995).
CAD catalyzes the final step in a branch of phenylpropanoid synthesis specific for the production of
lignin monomers, and an increased expression of this
enzyme could indicate increased lignification (Walter
et al., 1988), which, however, was not observed in the
rose-P. pannosa interaction. A large number of stressinduced phenylpropanoids are derived from the C15
flavonoid skeleton, which is biosynthesized via CHS,
the key enzyme in the flavonoid branch of the phenylpropanoid pathway, catalyzing the production of
tetrahydroxychalcone, the precursor of all flavonoids
(Dixon and Paiva, 1995; Winkel-Shirley, 2001).
Many plant phenolics can function as passive or
inducible barriers against pathogens, and it is well
known that, for example, the content of flavonoids can
increase or the flavonoid composition can change in
response to pathogen attack. However, the involvement of flavonoids in plant defense depends on the
species (Dixon and Paiva, 1995; Carlsen et al., 2008).
2200
Initial screening of methanol extracts by HPLC and
LC-MS from Si-treated rose leaves both with and
without powdery mildew inoculation revealed that
the contents of phenolic acids and flavonol glycosides
were clearly affected, whereas the contents of flavan-3ols (proanthocyanidins), which are known to play a
role in defense in some plants (Miranda et al., 2007;
Koskimäki et al., 2009), were not significantly affected.
Consequently, the focus in this investigation was on
the changes in the contents of phenolic acids and
flavonol glycosides. Chlorogenic acid, neochlorogenic
acid, and an unknown phenolic acid were detected in
rose leaves. The two identified phenolic acids are wellknown constituents in aerial parts of many plant
species (Christensen et al., 2008; Grevsen et al., 2008;
Schmitzer et al., 2009). However, neochlorogenic acid
has, to the best of our knowledge, not previously been
reported as a constituent in the aerial parts of roses.
Chlorogenic acid was the phenolic acid present in the
highest concentration, with an increase of more than
80% in Si+ inoculated compared with the Si2 uninoculated leaves.
Flavonol glycosides like quercetin and kaempferol
are well-known constituents of rose species, and the
flavonoids identified in this investigation (Table I)
have all previously been detected in rose species
(Biolley et al., 1994a, 1994b; Helsper et al., 2003; Kumar
et al., 2009; Schmitzer et al., 2009), except for quercetin3-O-gentiobioside. Among the 11 quantified flavonoids, rutin and quercitrin occurred in the highest
concentrations, with rutin increasing more than 20fold in Si+ inoculated compared with Si2 uninoculated plants (Fig. 3C; Supplemental Table S2).
Antimicrobial Activity of Major Phenolics in Rose
The substantial increase in the contents of phenolic
acids and flavonoids in Si+ inoculated leaves correlated with a 46% reduction in disease severity compared with Si2 inoculated leaves (Supplemental Fig.
S3). In order to elucidate whether the identified phenolics could help explain the Si-mediated protection,
we tested the ability of chlorogenic acid and rutin to
reduce powdery mildew development in roses, as
these secondary metabolites were among the phenolics that were detected in the highest amounts in Si+
inoculated leaves. Both rutin and chlorogenic acid had
an antimicrobial effect on P. pannosa when applied to
leaves, reducing disease severity by 40% to 50% in
planta. Interestingly, both spray application and leaf
infiltration gave comparable disease reductions (Fig.
4). Since germination of conidia as well as the ability of
conidia to form appressoria were reduced to the same
extent by chlorogenic acid and rutin following both
application methods, it appears that these two phenolics and perhaps other phenolics as well can be transported from the cell lumen to the epidermis to act as
antimicrobial compounds against P. pannosa. In accordance with this, von Röpenack et al. (1998) also
suggested that the phenolic conjugate p-coumaroylPlant Physiol. Vol. 157, 2011
Silicon Induces Changes in Rose Polyphenols
Table II. Quantitative recordings of infection biology of P. pannosa and defense responses in the fifth developed leaves of rose cv Smart
Plants were treated with chlorogenic acid and rutin applied by spraying or leaf infiltration. Control plants were similarly treated with water.
Observations were made at 72 hai, and values were calculated on the basis of the number of germinated conidia. Data represent results from one
experiment, and each observation represents the mean from three leaves. All values are presented as means 6 SE. The findings of this experiment
were confirmed in a second independent experiment.
Application
Odds Ratioa
Treatment
Chlorogenic Acid
Rutin
Control
Chlorogenic Acid
Rutin
Control
b
Spraying
Germinated
With appressoria
With haustoria
With ESH
With FEC
With papillae
Infiltrationc
Germinated
With appressoria
With haustoria
With ESH
With FEC
With papillae
15.3
10.7
8.7
8.7
8.0
8.7
6
6
6
6
6
6
0.33
0.33
0.67
0.67
0.00
0.67
14.7
10.2
9.2
9.2
8.1
8.6
6
6
6
6
6
6
0.33
0.58
0.33
0.33
0.00
0.33
25.3
22.0
13.3
13.3
7.9
9.3
6
6
6
6
6
6
0.33
0.58
0.33
0.33
0.67
0.33
0.53***
0.43***
0.52NS
0.52NS
1.00NS
0.92NS
0.51***
0.40***
0.56NS
0.56NS
1.02NS
0.93NS
1.00
1.00
1.00
1.00
1.00
1.00
15.3
10.7
8.0
8.0
9.3
9.3
6
6
6
6
6
6
0.33
0.33
0.00
0.00
0.33
0.33
16.7
11.9
10.0
10.0
10.7
10.7
6
6
6
6
6
6
0.33
0.58
0.00
0.00
0.33
0.33
24.7
21.4
11.9
11.9
9.4
10.0
6
6
6
6
6
6
0.33
0.67
0.33
0.33
0.33
0.00
0.55***
0.44***
0.65NS
0.65NS
0.99NS
0.93NS
0.60***
0.50***
0.82NS
0.82NS
1.15NS
1.07NS
1.00
1.00
1.00
1.00
1.00
1.00
a
Odds ratio for comparison of treatments (control used as a reference; odds ratio = 1.00). NS, Nonsignificant difference; *** significant at P ,
b
c
0.001; * significant at P , 0.05.
Sprayed with a solution (1 mg mL21) of chlorogenic acid or rutin until runoff.
Infiltrated with a solution (1
21
mg mL ) of chlorogenic acid or rutin.
hydroxyagmatine was transported in vesicles in barley
(Hordeum vulgare) leaves to the sites of attempted
penetration by Blumeria graminis f. sp. hordei. An
antimicrobial effect of phenolics is also in accordance
with the increased amounts of chlorogenic acid and
rutin as well as other phenolics observed in Si2
inoculated compared with Si2 uninoculated rose
leaves (Figs. 2 and 3; Supplemental Tables S1 and
S2). Phenolic acids and flavonol glycosides have also
been shown to play an important role in the defense
strategy of other plant species against pathogens. For
example, in apple (Malus domestica) leaves and fruits
infected with Venturia inaequalis, it has been shown
that the content of phenolic acids (e.g. chlorogenic
acid), flavonol glycosides (e.g. rutin, quercitrin, and
isoquercitrin), and flavan-3-ols increased significantly
in infected leaves compared with healthy tissues
(Petkovšek et al., 2008, 2009). Chlorogenic acid has
also been shown to play a major role in relation to scab
resistance in potato (Solanum tuberosum) caused by
Streptomyces scabies (Johnson and Schaal, 1952), and
rutin and other flavonols showed significant antifungal activity against the fungi Cylindrocarpon destructans, Phytophthora megasperma, and Verticillium dahliae
attacking olive trees (Olea europaea); therefore, rutin
and other flavonols are believed to play a major role in
plant defense of olive plants (Báidez et al., 2006, 2007).
A characteristic for the most widespread phenolic
acids and flavonols is that they are not induced following infection (i.e. they do not act as phytoalexins
but are considered phytoanticipins, which are preformed antifungal compounds, present in different
amounts, that may undergo postinfection increases
following infection; Harborne, 1999). In accordance
Plant Physiol. Vol. 157, 2011
with this, application of the compounds reduced
prepenetration growth of P. pannosa but not the frequencies of fungal developmental stages or host defense responses after penetration.
Expression of Key Phenylpropanoid Pathway Genes Is
Altered by Si Application and by Powdery
Mildew Infection
Like the transcriptomic analysis of the wheat-B.
graminis and the Arabidopsis-Golovinomyces cichoracearum pathosystems (Fauteux et al., 2005; Chain et al.,
2009), we found an up-regulation of genes involved in
secondary metabolism in the rose-P. pannosa pathosystem. However, neither Chain et al. (2009) nor
Fauteux et al. (2005) were able to identify the key
secondary metabolite genes or suggest a function of
secondary metabolite genes in their pathosystems.
Transcriptomic analysis of Si effects in wheat, Arabidopsis, rice, and tomato additionally indicated that Si
had a limited role on the transcriptome in the absence
of stress induced by pathogen inoculation (Watanabe
et al., 2004; Fauteux et al., 2005; Chain et al., 2009;
Ghareeb et al., 2011). In contrast, by using quantitative
real-time reverse transcription (RT)-PCR, we demonstrated that the transcript levels for PAL, CAD, and
CHS were often elevated by Si application compared
with Si2 uninoculated plants (Table III). Furthermore,
in several cases, the Si+ uninoculated plants had an
increased content of phenolics compared with the
uninoculated controls, thus substantiating the gene
expression results that Si primarily induces resistance
in rose plants against powdery mildew. The discrepancy between our findings and those from the Arabi2201
Shetty et al.
Table III. Quantitative real-time RT-PCR analysis of PAL, CHS, and CAD gene expression in leaves of rose from plants either treated with (Si+)
or without (Si2) Si followed by either inoculation with P. pannosa or no inoculation
Values shown represent fold up- or down-regulation in Si2 inoculated, Si+ uninoculated, and Si+ inoculated plants relative to Si2 uninoculated
plants (relative expression ratio = 1) at each time point, after normalization of all treatments to 18S rRNA. Data represent results from one
experiment, and each observation represents the mean from three extractions. All values are presented as means 6 SE. The findings of this experiment
were confirmed in a second independent experiment. * Significant change; ns, nonsignificant change.
Genes
PAL
CHS
CAD
Si Supply
Pathogen
Si2
Si2
Si+
Si+
Si2
Si2
Si+
Si+
Si2
Si2
Si+
Si+
Uninoculated
Inoculated
Uninoculated
Inoculated
Uninoculated
Inoculated
Uninoculated
Inoculated
Uninoculated
Inoculated
Uninoculated
Inoculated
Fold Change
0 hai
1.0
21.7 6 0.17ns
21.6 6 0.14*
21.4 6 0.11*
1.0
1.3 6 0.46ns
21.4 6 0.24*
21.0 6 0.32ns
1.0
1.3 6 0.21*
2.1 6 0.40*
1.2 6 0.28*
dopsis and wheat transcriptomic analyses could reflect differences in experimental design. Thus, in the
investigations of Arabidopsis and wheat (Fauteux
et al., 2005; Chain et al., 2009), leaves of different
physiological age were pooled for RNA extraction,
whereas we only analyzed the fifth developed leaves.
PAL and CHS Gene Expression: Possible Correlations to
the Biosynthesis of Phenolic Acids and Flavonoids
in Rose
We found a clear correlation between the elevated
PAL and CHS transcript levels and an increased biosynthesis of phenolics in rose leaves, especially for
both the Si+ treatments. However, when comparing
the up-regulation of PAL and CHS at specific time
points after inoculation (24, 72, and 120 hai) and the
amounts of phenolics produced, some discrepancies
were revealed. In particular, the down-regulation of
PAL at 120 hai compared with 72 hai for the Si+
inoculated treatment (Table III) is not reflected in a
decreased production of phenolic acids from 72 to 120
hai. In fact, the total production of phenolic acids
increased from 1.38 mg g21 sample at 72 hai to 1.58 mg
g21 sample at 120 hai (Fig. 2A; Supplemental Table S1).
Therefore, a decrease in the concentration of phenolic
acids at 72 to 120 hai would have been expected to
result from the down-regulation of PAL during this
time interval. A possible explanation for this could be
that the down-regulation of PAL only occurs at 72 to
120 hai. Thus, the genes coding for the production of
specific enzymes involved in the biosynthesis (e.g.
cinnamate 4-hydroxylase, p-coumarate:CoA ligase)
are not affected or are down-regulated after 72 hai.
Alternatively, the levels of PAL are kept high (i.e. there
is no need to keep transcribing the gene if the enzyme
is still present). Simple phenolic acid derivatives such
as p-coumaroyl CoA is the shikimic acid-derived
2202
24 hai
1.0
3.7 6 1.25*
2.6 6 0.60*
5.2 6 1.49*
1.0
2.8 6 1.06*
2.6 6 0.55*
4.5 6 0.45*
1.0
1.6 6 0.59ns
20.3 6 0.26ns
2.0 6 0.17*
72 hai
120 hai
1.0
1.5 6 0.17ns
1.2 6 0.27ns
39.3 6 11.6*
1.0
1.5 6 0.30*
2.6 6 0.30*
2.7 6 0.38*
1.0
21.8 6 0.04ns
21.1 6 0.12ns
2.4 6 0.55*
1.0
1.1 6 0.40ns
21.0 6 0.25ns
3.0 6 0.58*
1.0
1.2 6 0.14ns
2.2 6 0.15*
2.1 6 0.36*
1.0
21.2 6 0.23*
1.1 6 0.39ns
2.5 6 0.40ns
starting unit in the biosynthesis of flavonoids (Dixon
and Paiva, 1995; Winkel-Shirley, 2001). A change in the
biosynthesis of flavonoids, therefore, may affect the
pool of phenolic acids and hence the content of phenolic acids.
The up-regulation of CHS at 24 to 120 hai compared
with 0 hai in the Si+ inoculated treatment is consistent
with an increase in the amounts of most flavonol
glycosides in rose leaves at these time points (Fig. 3;
Supplemental Table S2). However, in the Si2 inoculated rose leaves, there appeared to be a trend, although not significant, to a decrease in the amounts of
flavonol glycosides at 24 to 120 hai (Fig. 3A; Supplemental Table S2), which is also in accordance with the
down-regulation of CHS observed at 24 to 120 hai
(Table III). Furthermore, the up-regulation of CHS in
the Si+ uninoculated plants resulted in an increase in
the content of individual flavonoids, such as avicularin
and quercitrin, but not in the total amounts of flavonol
glycosides (Fig. 3, D and E; Supplemental Table S2).
Finally, it is interesting that rutin, isoquercitrin, avicularin, and quercitrin have almost the same concentration profiles after P. pannosa infection and in Si+ and
Si2 plants at the different time points (Fig. 3, C and D;
Supplemental Table S2). This clearly indicates some
correlation between the biosynthesis of these closely
related flavonoids in response to P. pannosa infection of
rose leaves. Our results here also demonstrate that
specific genes that encode flavonoid enzymes involved in the biosynthesis of specific flavonoids (Dixon
and Paiva, 1995; Winkel-Shirley, 2001) are expressed
differently after Si application and infection with
powdery mildew, which explains why some flavonoids are produced in much higher amounts compared with others in the different treatments (Fig. 3;
Supplemental Table S2). Therefore, it would be interesting to investigate the expression of specific genes
involved in the biosynthesis of antimicrobial phenolics
Plant Physiol. Vol. 157, 2011
Silicon Induces Changes in Rose Polyphenols
in more detail in order to understand the fundamental
mechanisms of disease resistance of rose plants against
powdery mildew and antimicrobial defense mechanisms
in general. Hodson et al. (2005) found Si uptake in a
number of different plants, and the Si concentration
varied among these species. The relationship between
function and level of Si uptake in the investigated species
is not fully understood. Based on the results of this study,
it could be interesting to investigate whether Si also plays
a role in the induced resistance of other horticultural
species, but also wild-type plants in natural settings, and
whether there is a correlation between Si uptake and
defense against pathogens.
In conclusion, this study has demonstrated that the
accumulation of fungitoxic phenolic compounds, in
particular chlorogenic acid and rutin, was stimulated
by Si application. Exogenous application of these
phenolic compounds to rose plants enhanced resistance against powdery mildew. Thus, Si plays an
important and active role in stimulating the antimicrobial defense of roses.
MATERIALS AND METHODS
Extraction of Plant Material for Metabolite Analyses
Ground samples of freeze-dried rose leaves were extracted with 8 mL of
aqueous 80% methanol in a centrifuge tube with lid and placed in an orbital
shaker (200 rpm). From each of the two independent experiments, three
independent extractions were carried out (0.4 g; 0.1 mm or less particle size) in
darkness for 90 min at room temperature (22°C). After the extraction, the
samples were centrifuged for 10 min using a Sorvall SA-600 head (maximum
centrifugal force = 20.845; Buch & Holm), and the supernatant was collected
and stored at 220°C until analysis. The samples were filtered through a nylon
0.45-mm Cameo 25P syringe filter (Bie & Berntsen) before analysis by HPLC
and LC-electrospray ionization-MS/MS for phenolic acids and flavonoids.
The efficiency and reproducibility of the extraction procedure described above
were determined by duplicate extractions (2 3 8 mL of 80% methanol or 2 3 8
mL of 90% methanol). This showed that extraction by 1 3 8 mL of 80%
methanol was reproducible (coefficient of variation , 5%) and ensured
the extraction of more than 95% of the total flavonoids and phenolic acids in
the samples. For determination of the efficiency of the extraction method, the
extract samples were centrifuged between each extraction and the supernatant was collected and analyzed.
Flavonoid and Phenolic Acid Standards
Quercetin-3-O-galactoside (hyperoside), quercetin-3-O-glucoside (isoquercitrin), quercetin-3-O-rhamnoside (quercitrin), kaempferol-3-O-rhamnoside
(afzelin), and 3-O-caffeoylquinic acid were purchased from Extrasynthese,
and quercetin-3-O-arabinoside (avicularin) was purchased from Phytolab.
Quercetin-3-O-rutinoside (rutin) and 5-O-caffeoylquinic acid (chlorogenic
acid) were purchased from Sigma-Aldrich.
Plants and Treatment with Si
The miniature potted rose (Rosa hybrida ‘Smart’), which is highly susceptible to powdery mildew, was obtained from Aarhus University, Department
of Horticulture. Roses were propagated, maintained, and treated with Si as
described by Shetty et al. (2011).
Soluble Si was supplied in the nutrient solution at a concentration of 3.6
mM Si from SiKal (9.1% Si and 25.5% potassium as potassium metasilicate
[K2SiO3]; Yara Industries), as described by Shetty et al. (2011). After the
propagation period (4 weeks), plants were moved to the growth chamber and
watered for the first time with the Si+ or Si2 solution. Plants were subsequently watered with the two nutrient solutions every 72 h until disease
scoring, a total of 10 times. After 3 weeks in the growth chamber, half of
the plants in each of the two groups (Si+ and Si2) were inoculated with the
pathogen and denoted Si+ inoculated and Si2 inoculated, respectively. The
remaining plants from each group were not inoculated and denoted Si+
uninoculated and Si2 uninoculated, respectively.
Inoculation with Podosphaera pannosa
Inoculum of P. pannosa was produced and inoculation took place as
described by Shetty et al. (2011). The fifth developed leaves of 7-week-old
plants were inoculated and denoted Si+ inoculated and Si2 inoculated. Fifth
leaves of Si+ uninoculated and Si2 uninoculated plants were similarly
marked at the same time point.
For all investigations of metabolites and gene expression, two independent
experiments were carried out, each comprising a total of 168 plants. In each
experiment, 88 plants were inoculated (44 Si+ and 44 Si2) and 80 plants were
left uninoculated (40 Si+ and 40 Si2). Leaves from 160 plants (80 inoculated
and 80 uninoculated) were sampled for further analyses as described below,
and eight plants were used for disease assessment 9 dai as described below.
Sampling of Plant Material for Extraction of Metabolites
and RNA
From each of the two experiments, leaves of Si+ and Si2 plants, inoculated
with P. pannosa or left uninoculated, were sampled for extraction of polyphenols (phenolic acids and flavonoids). Marked leaves from 20 plants of each of
the four treatments were harvested at 0, 24, 48, and 120 h, ground in liquid
nitrogen, and split into two portions. Approximately 0.2 g of the ground
material was immediately stored at 280°C for RNA extraction. Another 2 g of
ground plant material was freeze dried and stored at 280°C for extraction of
polyphenols.
Plant Physiol. Vol. 157, 2011
Identification and Quantification of Phenolic Acids and
Flavonoids in Extracts
Phenolic constituents in extracts of rose leaves of cv Smart were determined by HPLC combined with photodiode array (PDA) detection and LCelectrospray ionization-MS/MS (Table I). LC-MS data were obtained using an
LTQ XL Linear Ion Trap Mass Spectrometer (Thermo Scientific) equipped with
a PDA detector and an evaporative light-scattering detector (ELSD; Sedex
80LT; SEDERE). Settings for the ELSD were 50°C for temperature and 3.7 bar
for nitrogen pressure. Settings for the mass spectrometer fitted with the
atmospheric pressure chemical ionization source operated in negative mode
were 40, 10, and 0 (arbitrary units) for sheath, auxiliary, and sweep gas flow
rates, respectively. Discharge voltage and current were 1.13 kV and 5.38 mA,
respectively. Vaporizer temperature was 400°C, capillary temperature was
250°C, capillary voltage was 216.3 V, tube lens was 100 V, and automatic gain
control target settings were 3 3 104 for full MS. Separations were performed
on a Zorbax Eclipse XDB-C18 column (5 mm, 150 3 4.6 mm; Agilent) with the
following solvents: solvent A = 0.1% formic acid (HPLC grade, purity of 99%;
Sigma-Aldrich) in water, solvent B = 0.1% formic acid in acetonitrile (HPLC
grade; Fisher Scientific). The solvent gradient was 0 to 5 min, isocratic 5% B;
5 to 65 min, linear gradient from 5% to 20% B; 65 to 75 min, linear gradient
from 20% to 100% B; 75 to 80 min, isocratic 100% B; 80 to 85 min, linear
gradient from 100% to 5% B; 85 to 90 min, isocratic 5% B. Flow was 0.8 L min21,
column temperature was 35°C, and injection volume was 10 mL. The flow was
split 50:50 (ELSD detector:MS detector) at exit of the PDA detector.
Phenolic acids and flavonoids were quantified in extracts by HPLC-PDA
on an Agilent 1100 HPLC system (Agilent Technologies). The phenolic acids
and flavonoids were monitored at 320 and 360 nm, and UV spectra were
recorded from 210 to 600 nm. Separations were performed under the same
HPLC conditions as used for LC-MS analyses, thus making comparison of
chromatograms and spectra completely reliable. Flavonoids and phenolic
acids were determined in extracts from external calibration curves of rutin and
chlorogenic acid, respectively. Mr correction factors were taken into account in
the quantification of the individual polyphenols. Mean recovery rates (approximate accuracy) for chlorogenic acid and rutin were more than 98%, with
a relative SD of less than 5%, and were determined by spiking a known amount
of authentic standards of chlorogenic acid and rutin, respectively, to rose leaf
extract samples. The precision of the HPLC method was determined by four
injections of a rose leaf extract sample on the same day (intraday variation)
and on four different days (interday variation). The overall intraday and
interday variations were found to be less than 5% for both flavonoids and
phenolic acids.
2203
Shetty et al.
RNA Extraction and Quantitative Real-Time
RT-PCR Analysis
Total RNA was extracted from 150 mg of homogenized plant tissue using
the Ambion RNAqueous kit with plant RNA Isolation Aid added (Applied
Biosystems) following the manufacturer’s protocol. Removal of genomic DNA
and cDNA synthesis were carried out as described by Shetty et al. (2009). The
18S rRNA gene was used as a reference gene (Shimada et al., 2003). Primer
design and testing as well as quantitative RT-PCR were carried out as
described by Bedini et al. (2005). The following primers were used: for 18S
rRNA, forward, 5#-CGGCTACCACATCCAAGGAA-3#, and reverse, 5#GCTGGAATTACCGCGGCT-3#; for PAL, forward, 5#-TCCTGACTGGCGAAAAGTTC-3#, and reverse, 5#-GAAGAGGTTCACCGTTCCAA-3#; for
CHS, forward, 5#-ACAGCAACTCCTCCCAACTG-3#, and reverse, 5#CGCTGGAATTTCTCCTTGAG-3#; for CAD, forward, 5#-AGGACGGAGGAGGCTAGGTTA-3#, and reverse, 5#-ATGGCATGGGTTACTTCAGC-3#.
Effects of Chlorogenic Acid and Rutin on Disease
Severity and Infection Biology
In two separate, independent experiments, the inhibitory activities of
chlorogenic acid and rutin on P. pannosa were tested in rose leaves following
either spray application or leaf infiltration of the compounds. Each compound
was dissolved in water (1 mg mL21) using a sonicator (Barson Sonifier 250;
Buch & Holm). Each experiment comprised a total of 36 plants. The fifth
developed leaves (7-week-old plants) were labeled and sprayed with one of
the compounds until runoff (six plants for each compound), whereas another
set of plants were infiltrated with the compounds (six plants for each
compound) using a Hagborg device (Hagborg, 1970). Water-sprayed or
infiltrated plants served as controls (six plants for each compound). Plants
were inoculated with P. pannosa and incubated as described above. Disease
severity (percentage coverage with powdery mildew) was determined using a
stereomicroscope at 9 dai. For each treatment, 22 leaflets were used to
calculate the mean disease severity.
Infection biology and defense responses were compared between chlorogenic acid- and rutin-treated leaves (spray and infiltration) and their respective water-treated controls. Three leaves from each treatment were collected at
72 hai, cleared, and examined using bright-field and epifluorescence microscopy as described by Shetty et al. (2003). The number of nongerminated
conidia was recorded on each leaf; subsequently, the development of 50
randomly chosen germinated conidia was studied on each leaf (a total of 150
conidia per treatment and time point). For each conidium, it was recorded
whether it formed a germ tube, formed appressoria, caused penetration,
caused the formation of single or multiple FEC and papillae at penetration
sites, and whether ESH formed. Penetration was considered to occur when a
haustorium or a FEC developed from a conidium, or rather an appressorium.
FEC and papillae were considered to stop infection when no ESH developed
from germlings where these responses occurred.
Statistical Analyses
Data from metabolite quantification activity assays and studies of disease
severity represent continuous variables and were analyzed by ANOVA
assuming a normal distribution. Variances were stabilized by appropriate
transformation of data if necessary.
For gene expression studies, statistical evaluations of the relative expression levels of the target genes were performed for Si2 inoculated, Si+
uninoculated, and Si+ inoculated plants compared with Si2 uninoculated
plants at each time point and normalized to the 18S rRNA expression level.
The analyses were performed using the relative expression software tool REST
as described by Pfaffl et al. (2002).
Data from studies of infection biology represent discrete variables, since it
was recorded whether a certain event took place (e.g. whether a conidium
germinated or not, whether a germinated conidium formed appressoria, and
whether appressoria with successful penetration formed haustoria or not).
Consequently, these data were analyzed by logistic regression assuming a
binomial distribution (corrected for overdispersion when present; Collett,
1991). For comparison of variables (percentages), odds ratios (Collett, 1991)
were calculated using control (Si2) plants as a reference (odds ratio = 1.00).
All data were analyzed by PC-SAS (release 9.2; SAS Institute), and
hypotheses were rejected at P , 0.05. All experiments were performed twice.
Statistical tests were performed to ensure that the individual experiments
2204
gave the overall same conclusions. Because similar, but not identical, results
were obtained, only results from one of the experiments are presented.
Throughout the article, all differences are significant unless specifically
mentioned.
Supplemental Data
The following materials are available in the online version of this article.
Supplemental Figure S1. Chemical structures of identified phenolic acids
and flavonoids in leaves of rose in this study.
Supplemental Figure S2. Typical HPLC-PDA chromatograms of aqueous
80% methanol extracts of leaves of rose at 320 nm for the treatments Si2
uninoculated, Si+ uninoculated, Si2 inoculated, and Si+ inoculated.
Supplemental Figure S3. Comparison of powdery mildew severity at 9 dai
in the fifth developed leaf (of every branch) of cv Smart (highly
susceptible) either treated with 3.6 mM Si (Si+) or 0 mM (Si2) Si.
Supplemental Table S1. Contents of total phenolic acids and selected
phenolic acids in leaves of rose for the treatments Si2 uninoculated, Si+
uninoculated, Si2 inoculated, and Si+ inoculated.
Supplemental Table S2. Contents of total flavonoids and selected flavonoids in leaves of rose for the treatments Si2 uninoculated, Si+ uninoculated, Si2 inoculated, and Si+ inoculated.
ACKNOWLEDGMENTS
We thank Yara Industries for providing the Si product SiKal, Kurt Dahl
and Theo Bølsterli for help in propagating and maintaining the rose plants,
and Kim Guldberg Vitten for technical assistance.
Received August 9, 2011; accepted October 19, 2011; published October 20,
2011.
LITERATURE CITED
Báidez AG, Gómez P, Del Rı́o JA, Ortuño A (2006) Antifungal capacity of
major phenolic compounds of Olea europaea L. against Phytophthora
megasperma Drechsler and Cylindrocarpon destructans (Zinssm.) Scholten.
Physiol Mol Plant Pathol 69: 224–229
Báidez AG, Gómez P, Del Rı́o JA, Ortuño A (2007) Dysfunctionality of the
xylem in Olea europaea L. plants associated with the infection process by
Verticillium dahliae Kleb.: role of phenolic compounds in plant defense
mechanism. J Agric Food Chem 55: 3373–3377
Barz W, Bless W, Borger-Papendorf G, Gunia G, Mackenbock V, Meier D,
Otto C, Super E (1990) Phytoalexins as part of induced defense mechanisms in plants: their elicitation, function and metabolism. In DJ
Chadwick, J Marsh, eds, Bioactive Compounds from Plants. John Wiley
& Sons, New York, pp 140–156
Bedini E, De Castro C, Erbs G, Mangoni L, Dow JM, Newman M-A,
Parrilli M, Unverzagt C (2005) Structure-dependent modulation of a
pathogen response in plants by synthetic O-antigen polysaccharides. J
Am Chem Soc 127: 2414–2416
Bélanger RR, Benhamou N, Menzies JG (2003) Cytological evidence of an
active role of silicon in wheat resistance to powdery mildew (Blumeria
graminis f.sp. tritici). Phytopathology 93: 402–412
Biolley J-P, Jay M, Viricel M-R (1994a) Flavonoid diversity and metabolism in 100 Rosa 3 hybrida cultivars. Phytochemistry 35: 413–419
Biolley J-P, Jay M, Viricel M-R (1994b) Pigmentation patterns of modern
rose mutants throw light on the flavonoid pathway in Rosa 3 hybrida.
Phytochemistry 36: 1189–1196
Carlsen SCK, Understrup A, Fomsgaard IS, Mortensen AG, Ravnskov S
(2008) Flavonoids in roots of white clover: interaction of arbuscular
mycorrhizal fungi and a pathogenic fungus. Plant Soil 302: 33–43
Chain F, Côté-Beaulieu C, Belzile F, Menzies JG, Bélanger RR (2009) A
comprehensive transcriptomic analysis of the effect of silicon on wheat
plants under control and pathogen stress conditions. Mol Plant Microbe
Interact 22: 1323–1330
Christensen LP, Kaack K, Fretté XC (2008) Selection of elderberry (SamPlant Physiol. Vol. 157, 2011
Silicon Induces Changes in Rose Polyphenols
bucus nigra L.) genotypes best suited for the preparation of elderflower
extracts rich in flavonoids and phenolic acids. Eur Food Res Technol 227:
293–305
Collett D (1991) Modelling Binary Data. Chapman & Hall, London
de Ascensao ARFDC, Dubery IA (2003) Soluble and wall-bound phenolics
and phenolic polymers in Musa acuminata roots exposed to elicitors from
Fusarium oxysporum f.sp. cubense. Phytochemistry 63: 679–686
Dixon RA, Achnine L, Kota P, Liu C-J, Reddy MSS, Wang L (2002) The
phenylpropanoid pathway and plant defence: a genomics perspective.
Mol Plant Pathol 3: 371–390
Dixon RA, Paiva NL (1995) Stress-induced phenylpropanoid metabolism.
Plant Cell 7: 1085–1097
Eken C (2005) A review of biological control of rose powdery mildew
(Spaerotheca pannosa var. rosae) by fungal antagonists. Acta Hortic 690:
193–196
Epstein E (1994) The anomaly of silicon in plant biology. Proc Natl Acad Sci
USA 91: 11–17
Fauteux F, Rémus-Borel W, Menzies JG, Bélanger RR (2005) Silicon and
plant disease resistance against pathogenic fungi. FEMS Microbiol Lett
249: 1–6
Fawe A, Abou-Zaid M, Menzies JG, Bélanger RR (1998) Silicon-mediated
accumulation of flavonoid phytoalexins in cucumber. Phytopathology
88: 396–401
Ghareeb H, Bozsó Z, Ott GP, Repenning C, Stahl F, Wydra K (2011)
Transcriptome of silicon-induced resistance against Ralstonia solanacearum in the silicon non-accumulator tomato implicates priming effect.
Physiol Mol Plant Pathol 75: 83–89
Grevsen K, Fretté XC, Christensen LP (2008) Concentration and composition of flavonol glycosides and phenolic acids in aerial parts of
stinging nettle (Urtica dioica L.) are affected by high nitrogen fertilization and by harvest time. Eur J Hortic Sci 73: 20–27
Hagborg WAF (1970) A device for injecting solutions and suspensions into
thin leaves of plants. Can J Bot 48: 1135–1136
Harborne JB (1999) The comparative biochemistry of phytoalexin induction in plants. Biochem Syst Ecol 27: 335–367
Helsper JPFG, de Vos CHR, Maas FM, Jonker HH, Van Den Broeck HC,
Jordi W, Pot CS, Keizer LCP, Schapendonk AHCM (2003) Response of
selected antioxidants and pigments in tissues of Rosa hybrida and Fuchsia
hybrida to supplemental UV-A exposure. Physiol Plant 117: 171–178
Hodson MJ, White PJ, Mead A, Broadley MR (2005) Phylogenetic variation in the silicon composition of plants. Ann Bot (Lond) 96: 1027–1046
Horst RK (1983) Compendium of Rose Diseases. American Phytopathology
Press, St. Paul
Johnson G, Schaal LA (1952) Relation of chlorogenic acid to scab resistance
in potatoes. Science 115: 627–629
Koskimäki JJ, Hokkanen J, Jaakola L, Suorsa M, Tolonen A, Mattila S,
Pirttilä AM, Hohtola A (2009) Flavonoid biosynthesis and degradation
play a role in early defence responses of bilberry (Vaccinium myrtillus)
against biotic stress. Eur J Plant Pathol 125: 629–640
Kumar N, Bhandari P, Singh B, Bari SS (2009) Antioxidant activity and ultraperformance LC-electrospray ionization-quadrupole time-of-flight mass
spectrometry for phenolics-based fingerprinting of rose species: Rosa damascena, Rosa bourboniana and Rosa brunonii. Food Chem Toxicol 47: 361–367
Ma JF (2004) Role of silicon in enhancing the resistance of plants to biotic
and abiotic stresses. Soil Sci Plant Nutr 50: 11–18
Ma JF, Takahashi E (2002) Soil, Fertilizer, and Plant Silicon Research in
Japan. Elsevier Science, Amsterdam
Ma JF, Yamaji N (2006) Silicon uptake and accumulation in higher plants.
Trends Plant Sci 11: 392–397
Masada S, Terasaka K, Oguchi Y, Okazaki S, Mizushima T, Mizukami H
(2009) Functional and structural characterization of a flavonoid glucoside 1,6-glucosyltransferase from Catharanthus roseus. Plant Cell Physiol
50: 1401–1415
Plant Physiol. Vol. 157, 2011
View publication stats
Miranda M, Ralph SG, Mellway R, White R, Heath MC, Bohlmann J,
Constabel CP (2007) The transcriptional response of hybrid poplar
(Populus trichocarpa 3 P. deltoides) to infection by Melampsora medusae leaf rust involves induction of flavonoid pathway genes leading
to the accumulation of proanthocyanidins. Mol Plant Microbe Interact
20: 816–831
Osbourn AE (1996) Preformed antimicrobial compounds and plant defense
against fungal attack. Plant Cell 8: 1821–1831
Pemberton HB, Kelly JW, Ferare J (2003) Pot rose production. In A Roberts,
T Debener, S Gudin, eds, Encyclopedia of Rose Science. Elsevier Science,
Oxford, pp 587–593
Petkovšek MM, Štampar F, Veberič R (2008) Increased phenolic content in
apple leaves infected with the apple scab pathogen. J Plant Pathol 90:
49–55
Petkovšek MM, Štampar F, Veberič R (2009) Accumulation of phenolic
compounds in apple in response to infection by the scab pathogen,
Venturia inaequalis. Physiol Mol Plant Pathol 74: 60–67
Pfaffl MW, Horgan GW, Dempfle L (2002) Relative Expression Software
Tool (REST) for group-wise comparison and statistical analysis of
relative expression results in real-time PCR. Nucleic Acids Res 30: e36
Rémus-Borel W, Menzies JG, Bélanger RR (2005) Silicon induces antifungal compounds in powdery mildew-infected wheat. Physiol Mol Plant
Pathol 66: 108–115
Rodrigues FA, Datnoff LE, Korndorfer GH, Seebold KW, Rush MC (2001)
Effect of silicon and host resistance on sheath blight development in
rice. Plant Dis 85: 827–832
Rodrigues FA, McNally DJ, Datnoff LE, Jones JB, Labbé C, Benhamou N,
Menzies JG, Bélanger RR (2004) Silicon enhances the accumulation of
diterpenoid phytoalexins in rice: a potential mechanism for blast resistance. Phytopathology 94: 177–183
Schmitzer V, Veberic R, Osterc G, Stampar F (2009) Changes in the
phenolic concentration during flower development of rose ‘KORcrisett’.
J Am Soc Hortic Sci 134: 491–496
Shetty NP, Jensen JD, Knudsen A, Finnie C, Geshi N, Blennow A,
Collinge DB, Jørgensen HJL (2009) Effects of b-1,3-glucan from
Septoria tritici on structural defence responses in wheat. J Exp Bot 60:
4287–4300
Shetty NP, Kristensen BK, Newman M-A, Møller K, Gregersen PL,
Jørgensen HJL (2003) Association of hydrogen peroxide with restriction
of Septoria tritici in resistant wheat. Physiol Mol Plant Pathol 62: 333–346
Shetty R, Jensen B, Shetty NP, Hansen M, Hansen CW, Starkey KR,
Jørgensen HJL (July 3, 2011) Silicon induced resistance against powdery
mildew of roses caused by Podosphaera pannosa. Plant Pathol http://dx.
doi.org/10.1111/j.1365-3059.2011.02493.x
Shimada Y, Goda H, Nakamura A, Takatsuto S, Fujioka S, Yoshida S
(2003) Organ-specific expression of brassinosteroid-biosynthetic genes
and distribution of endogenous brassinosteroids in Arabidopsis. Plant
Physiol 131: 287–297
von Röpenack E, Parr A, Schulze-Lefert P (1998) Structural analyses and
dynamics of soluble and cell wall-bound phenolics in a broad spectrum
resistance to the powdery mildew fungus in barley. J Biol Chem 273:
9013–9022
Walter MH, Grima-Pettenati J, Grand C, Boudet AM, Lamb CJ (1988)
Cinnamyl-alcohol dehydrogenase, a molecular marker specific for lignin synthesis: cDNA cloning and mRNA induction by fungal elicitor.
Proc Natl Acad Sci USA 85: 5546–5550
Watanabe S, Shimoi E, Ohkama N, Hayashi H, Yoneyama T, Yazaki J,
Fujii F, Shinbo K, Yamamoto K, Sakata K, et al (2004) Identification of
several rice genes regulated by Si nutrition. Soil Sci Plant Nutr 50:
1273–1276
Winkel-Shirley B (2001) Flavonoid biosynthesis: a colorful model for
genetics, biochemistry, cell biology, and biotechnology. Plant Physiol
126: 485–493
2205
Free related PDFsRelated papers
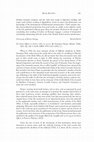
Art rupestre de la région de l’Oued Eççayad-Noun, Sud marocain : nouvelles données
L'Anthropologie, 2019
Free PDF

The Tilting Stream of Dharma Metaphor in Mahāyāna Buddhist Exegesis
36th Conference of the Institute for Oriental Philosophy, Hachioji, Japan, 2022
Free PDF
Gadir y Cartago ¿Relaciones cordiales o intereses enfrentados? (2021)
B. COSTA RIBAS (ed.), El papel de la Cartago Prébarcida en Iberia. XXXIII Jornades d’Arqueologia Feniciopúnica (Eivissa, 2018) (Treballs del Museu Arqueològic d'Eivissa i Formentera, 81, pp. 41-63). Eivisa: Museu Arqueològic d'Eivissa i Formentera., 2021
Free PDF


Diferenças que desafiam, potencializam o debate e a com(posição) de mundos outros
Interface - Comunicação, Saúde, Educação
Free PDF
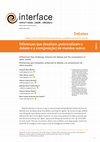

Free PDF
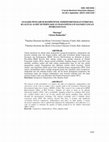
Beta-Blockers Following Cocaine Use: A Reappraisal
Annals of Emergency Medicine, 2008
Free PDF

Supraventricular arrhythmias in noncompaction of left ventricle: Is this a frequent complication?
International Journal of Cardiology, 2008
Free PDF
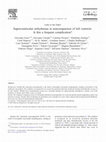


BotanicGarden: A high-quality and large-scale robot navigation dataset in challenging natural environments
arXiv (Cornell University), 2023
Free PDF
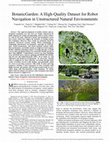
- Find new research papers in:
- Physics
- Chemistry
- Biology
- Health Sciences
- Ecology
- Earth Sciences
- Cognitive Science
- Mathematics
- Computer Science