Molecular Ecology (2012) 21, 3593–3609
doi: 10.1111/j.1365-294X.2012.05619.x
The Atlantic–Mediterranean watershed, river basins and
glacial history shape the genetic structure of Iberian
poplars
D . M A C A Y A - S A N Z , * M . H E U E R T Z , * U . L Ó P E Z - D E - H E R E D I A , † A . I . D E - L U C A S , ‡ E . H I D A L G O , §
C . M A E S T R O , – A . P R A D A , * * R . A L Í A * and S . C . G O N Z Á L E Z - M A R T Í N E Z *
*Department of Forest Ecology and Genetics, Forest Research Centre, INIA. Carretera de A Coruña km 7.5 – 28040 Madrid,
Spain, †Forest Genetics and Physiology Research Group, ETS Forestry Engineering, Technical University of Madrid (UPM),
Ciudad Universitaria s ⁄ n – 28040 Madrid, Spain, ‡Laboratorio de Diagnóstico Genético, Departamento de Biotecnologı́a,
ITAGRA.CT, Campus Universitario ‘‘La Yutera’’, Avenida de Madrid 44 – 34004 Palencia, Spain, §Departamento de
Producción Vegetal y Recursos Forestales, E.T.S. Ingenierı́as Agrarias, Universidad de Valladolid, Avenida de Madrid 44 –
34004 Palencia, Spain, –Unidad de Recursos Forestales, CITA, Gobierno de Aragón, Avenida de Montañana 930 – 50059
Zaragoza, Spain, **Banc de Llavors Forestals, Dirección General de Gestión del Medio Natural, Conselleria de Territorio y
Vivienda, Avda. Comarques del Paı́s Valencià 144 – 46913 Quart de Poblet, Valencia, Spain
Abstract
Recent phylogeographic studies have elucidated the effects of Pleistocene glaciations
and of Pre-Pleistocene events on populations from glacial refuge areas. This study
investigates those effects in riparian trees (Populus spp.), whose particular features may
convey enhanced resistance to climate fluctuations. We analysed the phylogeographic
structure of 44 white (Populus alba), 13 black (Populus nigra) and two grey (Populus x
canescens) poplar populations in the Iberian Peninsula using plastid DNA microsatellites and sequences. We also assessed fine-scale spatial genetic structure and the extent of
clonality in four white and one grey poplar populations using nuclear microsatellites and
we determined quantitative genetic differentiation (QST) for growth traits in white
poplar. Black poplar displayed higher regional diversity and lower differentiation than
white poplar, reflecting its higher cold-tolerance. The dependence of white poplar on
phreatic water was evidenced by strong differentiation between the Atlantic and
Mediterranean drainage basins and among river basins, and by weaker isolation by
distance within than among river basins. Our results suggest confinement to the lower
river courses during glacial periods and moderate interglacial gene exchange along
coastlines. In northern Iberian river basins, white poplar had lower diversity, fewer
private haplotypes and larger clonal assemblies than in southern basins, indicating a
stronger effect of glaciations in the north. Despite strong genetic structure and frequent
asexual propagation in white poplar, some growth traits displayed adaptive divergence
between drainage and river basins (QST > FST), highlighting the remarkable capacity of
riparian tree populations to adapt to regional environmental conditions.
Keywords: genetic differentiation, glaciations, Iberian Peninsula, Populus, QST > FST, spatial
genetic structure.
Received 15 December 2011; revision received 16 March 2012; accepted 27 March 2012
Introduction
Historical demographic processes caused by the Pleistocene glaciations have contributed to shape the current
Correspondence: Santiago C. González-Martı́nez, Fax:
+34 913572293; E-mail: santiago@inia.es
� 2012 Blackwell Publishing Ltd
patterns of phylogeographic structure in widespread
temperate tree species. As the location of glacial refugia
and the ways postglacial colonization took place
became elucidated (Nichols & Hewitt 1994; Palmé et al.
2003), researchers increasingly started focusing on phylogeographic patterns within former glacial refugia such
�3594 D . M A C A Y A - S A N Z E T A L .
as the Mediterranean peninsulas (Rodrı́guez-Sánchez
et al. 2010). The existence of numerous refugia in the
Mediterranean Peninsulas is believed to have enabled
species and populations to persist in these buffered
habitats throughout the Quaternary (Medail & Diadema
2009). Even in the southern regions that experienced the
severest conditions (e.g. the north-western Iberian
Peninsula), Mediterranean species could have persisted
in isolated benign locations, similar to the ‘cryptic refugia’ described for boreal species (Anderson et al. 2006;
Cheddadi et al. 2006; Petit et al. 2008). Typical
signatures of former refuge populations are low withinpopulation genetic diversity, accompanied by large
amounts of regional diversity, and high levels of genetic
differentiation among populations (Hampe & Petit
2005). Besides the effects of the Quaternary glaciations,
some recent studies have also highlighted the importance of older geological events, such as Tertiary plate
tectonics, in shaping the current phylogeographic
structure of forest trees in former refugial areas (e.g.
Quercus suber, Magri et al. 2007; Taxus baccata,
González-Martı́nez et al. 2010).
Although there is a large body of phylogeographic
studies on former glacial refugia regions (see review in
Medail & Diadema 2009 for the Mediterranean basin),
few have focused on riparian temperate species, whose
particular attributes could have enhanced their resilience to past climate changes. First, as riparian temperate species performance depends largely on a single
environmental condition, phreatic water availability,
that is more related to orography than to climate,
climate factors may affect them less than to other plant
species. Second, their preferred habitats (valley bottoms,
wetlands and deep gorges) are considered ideal to buffer climatic oscillations due to warmer and moister conditions, making them good candidates for ‘refugia
within the refugia’ (Medail & Diadema 2009; NietoFeliner 2011). Third, many typical temperate riparian species (e.g. Populus spp., Salix spp., Tamarix spp., Ulmus
spp.; Stuefer et al. 2002; Ruiz de la Torre 2006; Slavov &
Zhelev 2010) have high levels of clonality, which could
reinforce population survival by securing local persistence through unfavourable conditions and allowing
rapid colonization of disturbed areas. As a drawback,
the dependence of riparian trees on phreatic water
leads to a scattered pattern of suitable habitats, separated by large inhospitable areas (e.g. elevated plateaus
between river valleys). As a result, riparian populations
are exceptionally prone to isolation, and consequently
substantial genetic structure has been reported at regional level in different riparian trees (e.g. Cottrell et al.
2005; Fussi et al. 2010).
Pervasive population isolation promotes stochastic
processes reducing both molecular and quantitative
genetic variation (at a rate that depends on the reciprocal of effective population size). Depletion of genetic
variation reduces the ability of populations to adapt.
Theoretical models have shown an ambiguous role of
gene exchange in local adaptation. Gene flow counteracts the effects of selection, as it dilutes local changes in
allele frequencies (Lenormand 2002). However, Alleaume-Benharira et al. (2006) showed, using individualbased simulations, that gene flow can also mitigate the
effect of drift by replenishing genetic variance in small
marginal populations. In species with more specialized
ecological requirements, the gene flow from core populations necessary to ensure adaptability of isolated marginal populations is expected to increase (AlleaumeBenharira et al. 2006). As specialized species are prone
to geographic isolation but, at the same time, inhabit
similar environments across large ranges, gene flow
may be critical to keep levels of genetic variance high
enough to maintain their evolutionary potential. To our
knowledge, no study has hitherto reported on the adaptive consequences derived from the ecological specificity of riparian tree species.
In this study, we assessed the genetic diversity and
structure of wind-dispersed Iberian poplar species
(especially white poplar, Populus alba L.) at local, regional and wide spatial scales using chloroplast and
nuclear DNA markers. Additionally, common garden
data in white poplar provided insights into the adaptive
significance of river-basin isolation in this species. The
Iberian Peninsula (IP hereafter) represents an ideal setting for this study, as it harbours numerous refuge
areas with distinct environmental features (Gómez &
Lunt 2007 and references therein). With regard to riparian habitats, high climatic heterogeneity is accompanied
by a complex river system consisting of two drainage
basins (watershed of the Atlantic Ocean and the Mediterranean Sea), several main river basins and numerous
smaller watercourses originating in coastal mountain
ranges. Different parts of the IP currently inhabited by
poplar species (notably the Duero basin, in the northwestern range) were severely affected by Quaternary
glaciations and present particularly amenable conditions for testing the persistence of riparian species in
harsh environments. Within this range, we focused on
the white poplar, a widespread species with high colonization capability and marked tolerance to temperature
changes, atmospheric dryness and salt stress, if groundwater is available (Ruiz de la Torre 2006). Despite the
scarcity of palynological records resulting from poor
pollen preservation (Huntley & Birks 1983), leaf fossils
of white poplar found in travertine formations have
shown its undoubted native presence in the IP (Roiron
et al. 2004). Furthermore, in contrast with other European poplar species, white poplar has limited utility to
� 2012 Blackwell Publishing Ltd
�G E N E T I C S T R U C T U R E I N I B E R I A N P O P L A R S 3595
humans and negligible commercial value. Human mediated movement of reproductive material is therefore
unlikely to have modified the pattern of natural genetic
structure in this species.
Analysing different aspects of genetic diversity and
spatial genetic structure (SGS) in Iberian poplars, we
aimed at clarifying the role of climatic fluctuations and
orographic barriers on population dynamics in riparian
species. The use of different types of molecular markers
[plastid DNA (cpDNA) sequences and microsatellites
(cpSSRs) and nuclear microsatellites (nSSRs)] allowed
us to discriminate among distinct overlapping patterns
of SGS and to control for allele homoplasy. The comparison of neutral genetic differentiation patterns to quantitative traits facilitated understanding the role of
isolation in promoting local adaptation. More specifically, our goals were to (i) examine the genetic signature of ancient geological divides (the flooding of the
Strait of Gibraltar and the rise of the Mediterranean ⁄ Atlantic watershed), setting a temporal framework
for main phylogeographical events; (ii) assess regional
patterns of diversity and differentiation, informing on
the capability of riparian species to survive severe climatic changes in situ and to migrate across extensive
inhospitable areas; (iii) evaluate the role of asexual
reproduction and fine-scale genetic structure for maintaining population persistence and connectivity within
river basins in a water-dependent species; and (iv) test
for signs of local adaptation based on genetic differentiation for quantitative traits (as estimated by QST). The
comparison of levels of genetic differentiation for
molecular markers and quantitative traits addressed the
specific question of adaptive divergence vs. genetic drift
in a narrow-niche but widespread species.
Materials and methods
Plant material, sampling and DNA extraction
Fifty-nine Iberian poplar populations (n = 628 trees)
were sampled (see Fig. 1, details in Table S1, Supporting information), with a focus on Iberian white poplar
(Populus alba L.; 44 populations), and representative
samples of black (Populus nigra L.; 13 populations) and
grey (Populus x canescens (Aiton) Sm.; two populations)
poplars. Black poplar was not sampled in the south of
the IP as it is relatively scarce in that region. Sampling
included three major river basins, two draining to the
Atlantic Ocean (Duero and Guadalquivir rivers, in
northwestern and southern Spain, respectively) and one
to the Mediterranean (Ebro river, northeastern Spain).
Several smaller Mediterranean river basins and scattered populations in two additional major Atlantic river
basins (Tajo and Guadiana) were also sampled. In
� 2012 Blackwell Publishing Ltd
addition, one white poplar population from the High
Atlas in Morocco was sampled to obtain time calibrations based on major biogeographic events separating
the Iberian Peninsula from northern Africa (see below).
For each population, six leaves from each of n = 10
trees, separated by at least 100 m (to reduce the chance
of sampling clonal replicates or related trees), were collected and dried in silica gel prior to cpDNA analysis.
To study genetic structure at the local scale using
nuclear microsatellites (nSSRs), one population of grey
poplar (from the Guadiana river) and four of white
poplar (from the Duero, Guadalquivir and Ebro basins;
Fig. 1) were more intensively sampled, collecting material from three to five additional trees around each of
the ten core individuals (n = 200 trees). All trees were
geographically referenced.
Total DNA was purified from dried leaves following
a slightly modified protocol from Doyle & Doyle (1990).
Molecular markers (cpSSRs, nSSRs and cpDNA
sequences)
Thirteen chloroplast microsatellites (cpSSRs) from Weising & Gardner (1999) and Bryan et al. (1999) were
tested in a panel consisting of 17 individuals sampled
across the white poplar range in the Iberian Peninsula.
Out of 11 cpSSRs that produced a PCR product, only
two (ccmp2 and ccmp5) were polymorphic. All samples
were amplified at ccmp2 and ccmp5 (missing data of ca.
6%) in 10 lL of final volume, including 5 ng of DNA
template, 0.4 units of Taq (Bioline, London, UK),
0.15 lM of each primer (the forward primers labelled
with IRD800; Li-Cor Biosciences, Lincoln, NE, USA),
0.1 mM of each dNTP and 2 mM of MgCl2. The PCR
profile consisted of 5 min at 94 �C, 12–24 cycles (samples with weak amplification at 12 cycles were repeated
using 24 cycles) of 1 min at 94 �C, 30 s at 49 �C (ccmp2)
or 50 �C (ccmp5), and 1 min at 72 �C and a final extension of 10 min at 72 �C. PCR fragments were resolved
on a Li-Cor 4300 DNA analyser (Li-Cor Biosciences). To
reduce the probability of scoring errors, a selection of
samples that covered the fragment size range was
included as internal standard in each gel. SAGAGT vs.
3.3. was used for gel calibration and scoring (Li-Cor
Biosciences). The chloroplast DNA region trnC-petN1
was sequenced in at least one individual per population
and cpSSR haplotype (n = 133 individuals), assuming
that individuals with the same cpSSR haplotype within
populations would also share their trnC-petN1 haplotype, because of lower expected mutation rates in the
latter. For each combination of cpSSRs and trnC-petN1,
the rpl16-poprpl cpDNA region was sequenced in at
least one individual (n = 107 individuals). To sequence
the samples in both directions, 30 lL of PCR product
�3596 D . M A C A Y A - S A N Z E T A L .
(a)
Populus alba
h03
h04
h05
Ebro basin
h06
h07
h08
Duero basin
h09
h10
Catalonia
h11
h12
h20
h22
h23
h24
h25
Tajo basin
h26
h27
h28
h29
Populus nigra
h36
h37
Atlantic drainage basin
Levante
Guadiana basin
Mediterranean drainage basin
h01
h38
h02
h39
h13
h40
h14
h41
h15
h42
h16
h43
h17
h44
h45
h18
Guadalquivir basin
h30
h31
h46
Populus
x canescens
h51
h33
h52
h34
0
50
h47
h50
h32
h35
h04
h48
h27
h49
h51
100
200
h53
h54
h55
300 km.
(b)
Ebro basin
Duero basin
Catalonia
Tajo basin
Atlantic drainage basin
Levante
Guadiana basin
Guadalquivir basin
Populus alba
Populus nigra
Mediterranean drainage basin
Populus
x canescens
H11
50
H02
H03
H10
0
H01
H04
H12
H01
H05
H13
H02
H06
H14
H04
100
200
H07
300 km.
Fig. 1 Geographic distribution and population frequency of haplotypes based on (a) the full data set (cpSSRs and cpDNA
sequences) and (b) unique event polymorphisms (UEPs). Red squares indicate populations used to study clonality levels and finescale population genetic structure. Main hydrographic features and the altitudinal pattern (in shadows) are also shown.
� 2012 Blackwell Publishing Ltd
�G E N E T I C S T R U C T U R E I N I B E R I A N P O P L A R S 3597
was yielded for each sample and cpDNA region. The
PCR mix included 7.5 ng of DNA template, 0.75 units
of Taq (Bioline), 0.3 lM of each primer (unlabelled),
0.15 mM of each dNTP and 3 mM of MgCl2. The PCR
profile was 3 min at 94 �C, 39 cycles of 30 s at 94 �C,
30 s at 50 �C and 80 s at 72 �C, and a final extension of
10 min at 72 �C. Fragments were purified with Exo-SAP
(Affymetrix, Santa Clara, CA, USA), and sequenced
(standard Sanger sequencing) in external facilities (Secugen, Madrid). SEQMAN software (DNASTAR Inc.,
Madison, Wisconsin, USA) was used to edit and align
cpDNA sequences.
Five highly-polymorphic nSSRs (ORPM127, ORPM312,
PMGC2852, ORPM30 and ORPM344; Lexer et al. 2005)
were used to study genetic structure at the local scale.
Fourteen additional nSSRs (see Table S2, Supporting
information) were used to confirm clonal identity of
large clonal assemblies. Protocols for amplification and
fragment resolution were the same as for cpSSRs with
the following PCR modifications: 2 min initial denaturation, 30 s denaturation during cycles, 5 min final elongation, and annealing temperatures and number of
cycles as given in Table S2 (Supporting information).
polymorphism types [insertions ⁄ deletions (indels),
SSRs, SNPs or short tandem repeats (STRs)] were
weighted identically. For comparative purposes, haplotypes from 12 Iberian and French aspens (Populus
tremula) were added to the network.
Time to the most recent common ancestor in white
poplar
To obtain insights into the temporal scale of relevant
phylogenetic events in white poplar, we obtained estimates of the times to the most recent common ancestor
(TMRCAs) for different data sets, based on the standard
coalescence (constant size) model and Bayesian analysis
using BATWING (Wilson et al. 2003). Salix sp. was
used as outgroup (GenBank accessions AJ849602.1,
DQ875043, DQ875044.1, DQ875047.1, DQ875048.1 and
DQ875049.1). Analyses considered UEP sites to define
tree topology and included (set1) all white poplar haplotypes (including Morocco), (set2) all Iberian white poplar haplotypes (excluding Morocco) or (set3) the white
poplar haplotypes present in the Mediterranean drainage basin (upper part of the haplotype network, Fig. 2).
The analyses were performed based on parameters
Haplotypes and haplotype networks
CpSSR scores and cpDNA sequences were combined
into haplotypes (see Table S3, Supporting information).
Owing to SSR mutation mechanisms and high polymorphism in trnC-petN1, homoplasy events (and, therefore,
network reticulations) were considered likely in our
data. Homoplasy events can introduce severe biases in
some analyses, such as those based on coalescence
(Provan et al. 2001). Therefore, three haplotype sets
were defined: (i) based on the whole set of polymorphisms (‘full data set’, haplotypes coded with a ‘h’ prefix; see Table S3, Supporting information); (ii) based on
unique event polymorphisms, that is excluding any
polymorphisms that produced reticulations in the haplotype network (‘UEP data set’, haplotypes coded with
a ‘H’ prefix; Table S3, Supporting information); and (iii)
based on single nucleotide polymorphisms (‘SNP data
set’, haplotypes coded with a ‘HR’ prefix; Table S3,
Supporting information). Haplotype frequencies per
population (see Table S4, Supporting information) were
plotted using pie charts on a GIS (ARCMAP version 9.2;
ESRI, Redlands, CA, USA) that also included main
physiographical features.
Statistical parsimony networks were constructed with
TCS vs. 1.21 (Clement et al. 2000) based on genetic distance matrices among haplotypes for the three haplotype sets. Because locus-specific mutation rates were
not available, distances among different variants at each
polymorphic site were considered equal. Likewise, all
� 2012 Blackwell Publishing Ltd
Fig. 2 Statistical parsimony network representing the minimum number of polymorphic site differences among haplotypes. The network was constructed considering only unique
event polymorphisms (UEPs). The inset represents a network
using only single nucleotide polymorphisms (SNPs). Notice the
unexpected location of H08, H09 and H14.
�3598 D . M A C A Y A - S A N Z E T A L .
scaled by population size N (which have higher precision; Wilson et al. 2003). A uniform prior distribution
was assumed for h (h = 2 Nl, l being the mutation
rate), and an estimation of TMRCA, T, was obtained in
coalescence units, that is, scaled by N. For each data set,
three independent MCMC were run with a burn-in period of 10 000 iterations and a main run of 20 000 to
obtain a total of 60 000 iterations for the estimation of
T.
To obtain unscaled coalescence times in years, we
assumed that Iberian and African white poplar lineages
diverged after the flooding of the Strait of Gibraltar
(some 5.33 Ma; Duggen et al. 2003). This assumption
seems reasonable as post flooding seed dispersal across
the Strait of Gibraltar has been suggested to be very
rare (if any) for other forest trees with large dispersal
capabilities (see Jaramillo-Correa et al. 2010). The barrier to seed dispersal results from distance across the
strait (14.3 km at its narrowest point) and from accelerated wind speed through the strait due to funnelling by
the steep-sided land masses on both sides (wind normally blows from the East, that is, ‘Levanter’, during
poplar dispersal season; Dorman et al. 1995). Considering that the product T · h is proportional to the
unscaled TMRCA (t) in years (i.e. T · h = 2l · t · g,
where g is the generation time), rough estimates of t
were obtained for set2 (the spread of Iberian haplotypes) and set3 (the divergence across Mediterranean
lineages) by computing T · h proportions with respect
to set1 [i.e. (T · h)set2 ⁄ (T · h)set1 = tset2 ⁄ tset1 where t for
set1, tset1, is fixed at 5.33 Ma] under the assumption of
constant mutation rates across runs (a reasonable
hypothesis within species). Finally, effective population
sizes for each set run were computed as N = t ⁄ (T · g)
considering a generation time, g, of 20–60 years. These
values are slightly higher than those found in the literature (e.g. 15 years for P. tremula in Ingvarsson 2008)
because in white poplar generation times are probably
extended due to extensive clonal propagation.
Genetic diversity and differentiation across drainage
and river basins
Nei’s (1978) unbiased haplotypic within-population
genetic diversity (expected heterozygosity, HE) was calculated based on the full data set (cpSSRs and cpDNA
sequences) for all poplar species and populations using
Arlequin vs. 3.1 (Excoffier et al. 2005). HE was also computed by pooling individuals according to drainage
basin (Atlantic vs. Mediterranean), river basin or latitude (North vs. South). Non-parametric KolmogorovSmirnov tests were used to compare levels of genetic
diversity at each spatial scale. Computation of haplotypic richness, before and after rarefaction, and the
number of private haplotypes after rarefaction was carried out using RAREFAC (Petit et al. 1998).
Estimates of genetic differentiation among populations and regions for white and black poplars were
obtained based on the full and the UEP data sets. Hierarchical Analyses of Molecular Variance (AMOVAS) were
performed with Arlequin vs. 3.1 grouping populations
by drainage basins, river basins or latitude. AMOVAs for
the UEP data set considered haplotype frequencies (FST)
or distances among haplotypes (NST). Global F-statistics
were computed using SPAGEDI vs. 1.3d software
(Hardy & Vekemans 2002). Because F-statistics have
recently been shown to perform badly when levels of
diversity are dissimilar among populations, we also
computed the D estimator by Jost (2008) using DEMEtics vs. 0.8.0 in R environment (Gerlach et al. 2010). Significance of D estimates was evaluated using bootstrap
resampling.
In the extensively sampled white poplar, isolation by
distance (IBD) analysis was used to test the effect of
water-dependency on genetic structure. In the absence
of barriers to gene flow, the ratio FST ⁄ (1 ) FST) is
expected to increase linearly as a function of the distance between pairs of populations (or its logarithm in
two-dimensional analyses). Hence, a single linear
regression slope is expected for all population pairs. If
water-dependency influences the genetic structure,
smaller differentiation is expected for pairs of populations belonging to the same river basin than for pairs
belonging to different basins. Consequently, a flatter
regression slope is expected within and a steeper slope
between basins (see box 2 of Guillot et al. 2009). IBD
was assessed using only the full data set in one (within
main river basins) or two (within and between basins)
dimensions. In one dimension, both ‘resistance’ distances (the distance measured following the river
course, see Guillot et al. 2009) or Euclidean distances
were used; otherwise Euclidean distances were applied.
The significance of IBD (regression slope greater than
zero) was tested with permutations. Statistical analyses
were carried out with SPAGeDi vs. 1.3d (FST estimates)
and Statistica vs. 10 (significance of regression slopes).
Genetic structure at the local scale
Five highly-polymorphic nSSRs were used to identify
clonal assemblies and to evaluate fine-scale SGS in one
grey and four white poplar populations (see Fig. 1).
Clone identity in the Aranda de Duero population
(where unusually large clonal assemblies were found)
was confirmed using 14 additional nSSRs. Individuals
with the same genotype (ramets) were identified using
Gimlet vs. 1.3.2 (Valière 2002). All individuals (i.e.
genets and ramets) were used together to produce an
� 2012 Blackwell Publishing Ltd
�G E N E T I C S T R U C T U R E I N I B E R I A N P O P L A R S 3599
overall estimate of SGS. The relative kinship coefficient
Fij of Loiselle et al. (1995) was computed for all pairs of
individuals within populations using SPAGeDi, and
considering the whole sample (n = 201) allele frequencies as reference. Fij was regressed on the Euclidean distance between individuals (linear environment), and
deviation from zero (presence of SGS) of the regression
slope b was tested with permutations. Values of b were
used to compare SGS strength across populations. The
SGS patterns were plotted averaging Fij in five distance
classes (0–25, 25–50, 50–100, 100–200 and >200 m)
including a similar number of sample pairs. The average kinship in distance classes over 100 m (the distance
among trees chosen for wide-range population sampling) is relevant to evaluate the probability of including clonal replicates or related individuals in data
analyses performed at larger spatial scales.
Common gardens and genetic differentiation for
quantitative traits
Two of the genotyped white poplar populations from
the Ebro and three from the Guadalquivir basin were
included in a quantitative genetic study to determine
trait differentiation among populations and river basins.
The Ebro and Guadalquivir were chosen because they
represent typical locations of the species and belong to
different drainage basins (the Ebro drains to the Mediterranean Sea and the Guadalquivir to the Atlantic
Ocean). For each population, two to four open-pollinated families (15 in total: eight from the Ebro and
seven from the Guadalquivir) averaging c. 40
plants ⁄ family were established in a common garden following a complete block design with eight blocks. Total
height at age 1 and 3 years (HT1 and HT3), and stem
diameter at the base (DSB3) and stem form (FOR3) at
age 3 years were measured in all individuals. Stem
form was evaluated as a discrete variable, with values
from 1 for straight stems, to 2 for arched stems without
inflection, and 3 for sinuous stems with at least one
inflection.
Variance components for basin, population and family effects were obtained by Restricted Maximum Likelihood (REML) using the following model:
yijklm ¼ l þ rm þ pðrÞlðmÞ þ fðpÞkðlÞ þ bj þ ðf � bÞkj þ eijklm
where yijklm is the phenotypic value of the variable for
the ith tree from the kth family in the lth population in
the mth river basin located in the jth block, l is the
overall mean, rm is the effect of the mth river-basin,
p(r)l(m) is the effect of the lth population within the mth
river-basin, f(p)k(l) is the effect of the kth family within
the lth population, bj is the effect of the jth block,
� 2012 Blackwell Publishing Ltd
(f · b)kj is the family per block interaction and eijklm the
residual. Overall genetic differentiation in quantitative
traits (QST) and quantitative genetic differentiation at
different hierarchical levels (among populations within
river basins and among river basins) were estimated
from variance components for the four traits. To disentangle the effects of genetic drift from those of adaptive
divergence within and among river basins, QST estimates for each trait were compared with FST computed
based on the same populations using the allozyme data
set (7 loci, average of 60 diploid individuals per populations) in Alba (2000). Allozymes were preferred to
nSSRs as their lower polymorphism makes them more
suitable for unbiased FST estimation (Jost 2008). The
bootstrap procedure outlined in Whitlock (2008) was
used to test for QST > FST, generating 1000 bootstraps
for each statistic (over individuals for traits and over
loci for allozymes). In addition, 95% confidence intervals of the bootstrap distributions of QST and FST were
compared.
Results
Haplotypes and haplotype networks
The chloroplast loci showed a total of 36 polymorphic
sites, including three mononucleotide microsatellites
(one within the trnC-petN1 region), 13 SNPs, 17 indels
and three short tandem repeats (STRs). Combining all
polymorphisms, 54 haplotypes were resolved (Table S3,
Supporting information): 36 for Populus alba (one shared
with Populus x canescens), 2 exclusive for P. x canescens
and 16 for Populus nigra. The highly polymorphic trnCpetN1 region alone resolved 26 haplotypes, while the
less variable rpl16-poprpl resolved only ten. Considering
only UEPs, the number of haplotypes was reduced to
14 (Table S3, Supporting information). In terms of the
full and UEP data sets, there were no shared haplotypes
across species (Figs 1 and 2). However, cpSSRs alone
were unable to distinguish among species, with P. nigra
and P. alba sharing seven haplotypes. This fact highlights the limited value of cpSSRs for phylogenetic
inference in poplars. Only three haplotypes had a wide
distribution, h23, h37, h53, at frequencies of 0.054, 0.046
and 0.032, respectively. Interestingly, the most abundant
haplotypes had a restricted distribution (h24, h25 and
h41, at frequencies of 0.069, 0.107 and 0.058). Several
haplotypes were confined to a single population (over
40% of private haplotypes for white and black poplars)
or river basin (over 70% of private haplotypes for white
and grey poplars).
Haplotype networks based on the full data set showed
a great number of reticulations and could not be
resolved. However, the reduced data sets based on
�3600 D . M A C A Y A - S A N Z E T A L .
UEPs or SNPs yielded interpretable networks (Fig. 2).
Many frequent white poplar haplotypes (H02-H05) were
closely related to the widespread H01 that is found in
both Atlantic and Mediterranean drainage basins. Some
less abundant P. alba haplotypes (H06 and H07) lay
close to P. nigra haplotypes and were exclusive of the
southern part of the Atlantic drainage basin, probably
indicating an older presence of white poplar in this
range. Finally, we have to note one very divergent P. nigra haplotype (H14) and the wide separation (with intermingling P. nigra haplotypes) of (i) Iberian and North
African (H08) P. alba; and (ii) P. alba and the closely
related P. tremula (both in section Populus).
Time to the most recent common ancestor
0.8
The scaled TMRCA estimates from Bayesian inference
(T, in coalescent units) in white poplar followed unimodal, asymmetric (gamma-like) distributions with averages of 3.31 for set1 (see Material and methods), of 2.19
for set2 and 1.91 for set3. T · h distributions (Fig. 3)
were significantly different for the three data sets (Kolmogorov-Smirnov tests, P < 0.01) indicating divergence
of Moroccan and Iberian white poplar lineages 1.93
times (CI: 0.74–4.13 at 95%) before the spread of Iberian
lineages, and 4.32 times (CI: 1.71–8.81 at 95%) before
the lineage radiation of the Mediterranean drainage
basin in the IP. Considering the time of the last known
direct communication between the IP and northern
Africa (the Messinian Salinity Crisis that finished about
CpDNA diversity at different geographic scales
Overall, based on the full data set, haplotypic diversity
per population was lower in P. alba (average of 0.317)
than in P. nigra (average of 0.409) (Table S1, Supporting information). Sympatric populations often showed
contrasting diversity levels for each species (e.g.
Henares population, P. alba: 0.000, P. nigra: 0.600; see
also Fig. S1, Supporting information) reflecting their
different demographic history. Haplotypic diversity was
extremely variable at the population level for both
white and black poplars, and there were no significant
differences between populations belonging to different
drainage basins or latitudinal ranges (KolmogorovSmirnov tests, P > 0.1).
By contrast, genetic diversity at the regional level
(sensu Hampe & Petit 2005; see Material and methods)
was much greater for southern Iberian river basins than
for northern basins in white poplar (Table 1). Similarly,
after adjustment for uneven sample size via rarefaction
(Petit et al. 1998), 26 haplotypes (21 private) were found
in southern Iberian river basins compared to ten (five
private) in the north. Finally, regional genetic diversity
was similar for Mediterranean and Atlantic drainage
basins (see Table 1), thus indicating a more important
role of latitude than drainage basin for explaining the
current standing genetic variation of Iberian white poplar. As black poplar is scarce in southern Iberia, comparative data are not available for this species.
0.4
CpDNA differentiation across drainage and river
basins
0.0
0.2
Density
0.6
Mediterranean haplotypes
Iberian haplotypes
All haplotypes
5.33 Ma; Duggen et al. 2003), the spread of Iberian haplotypes was dated to c. 2.76 Ma, and the divergence
across Mediterranean lineages to 1.23 Ma. If we assume
a generation time, g, for P. alba of 20–60 years, effective
population sizes (N) are estimated to 21 000–63 000 for
Iberian white poplar (10 667–32 000 for the Mediterranean range).
0
5
10
15
T×θ
Fig. 3 Density plots of unscaled Time to the Most Recent
Common Ancestor, TMRCA, obtained by coalescence simulations using BATWING (see text for details). Three different sets
of runs are shown including (from right to left): (i) all white
poplar haplotypes; (ii) only Iberian haplotypes; and (iii) haplotypes that are present in Mediterranean populations.
In white poplar, genetic differentiation as estimated by
FST and Jost’s D was significant for almost all spatial
scales (populations, river basins, latitudinal groups and
drainage basins; see Table 2 and below for exceptions),
with overall values of FST = 0.670 (0.735 for the UEP
data set) and D = 0.929 (0.559 for the UEP data set,
Table 2). The main factors causing genetic structure
(based on the more reliable UEP data set) in this species
were river and drainage basins with FCT ⁄ NCT ⁄ D values
of 0.320 ⁄ 0.223 ⁄ 0.511 and 0.374 ⁄ 0.260 ⁄ 0.569, respectively.
In addition, judging by Jost’s D, the river basins with
the lowest (and non-significant) levels of internal differentiation were the northern Duero and Catalonia.
� 2012 Blackwell Publishing Ltd
�G E N E T I C S T R U C T U R E I N I B E R I A N P O P L A R S 3601
Table 1 Haplotypic genetic diversity and allelic richness in
white and black poplars from the Iberian Peninsula; number of
sampled individuals (n), number of haplotypes (A), number of
haplotypes after rarefaction (A¢), number of private haplotypes
after rarefaction (Ap¢) and Nei’s expected heterozygosity HE
(standard deviation). The minimum sample size in each category was used as reference for rarefaction
Species ⁄ group
White poplar
River basin
Duero
Catalonia
Ebro
Levante
Tajo
Guadiana
Guadalquivir
Latitude
Northern
Southern
Drainage basin
Atlantic
Mediterranean
Overall
Black poplar*
River basin
Duero
Catalonia
Ebro
Levante
Tajo
Drainage basin
Atlantic
Mediterranean
Overall
A¢
Ap ¢
n
A
64
28
86
91
30
10
127
4
2
7
15
5
2
11
3.00
1.91
4.40
6.63
4.35
2.00
5.66
1.28
0.00
1.12
3.89
3.35
0.00
4.00
178
258
10
28
10.00
26.49
5.00
21.80
0.797 (0.018)
0.940 (0.005)
231
205
436
19
19
33
18.95
19.00
26.64
13.97
14.00
11.65
0.904 (0.008)
0.863 (0.016)
0.939 (0.004)
10
24
54
6
30
3
5
9
2
5
2.60
3.21
4.03
2.00
3.14
0.60
1.04
2.46
0.00
0.50
0.644
0.721
0.831
0.333
0.674
40
84
124
7
13
16
7.00
11.09
16.00
3.00
7.79
7.00
0.767 (0.046)
0.892 (0.012)
0.908 (0.009)
HE (SD)
0.543
0.304
0.733
0.899
0.779
0.356
0.847
(0.059)
(0.094)
(0.037)
(0.012)
(0.040)
(0.159)
(0.016)
(0.101)
(0.058)
(0.024)
(0.215)
(0.076)
*Black poplar was not sampled in the southern Iberian
Peninsula as it is relatively scarce in that region.
Latitudinal differentiation was not significant for FST or
NST and very low for D. Finally, looking at the full data
set, only five haplotypes (out of a total of 36) were
shared across drainage basins and numbers of private
haplotypes were very similar in each region (16 in the
Atlantic vs. 14 in the Mediterranean).
In black poplar, patterns of genetic differentiation
were less clear, probably due to reduced sampling (only
northern Iberian populations) and higher human-mediated transfer of seeds and cuttings among populations
(Galán-Cela et al. 2003). Despite overall genetic differentiation similar to white poplar (FST = 0.627 and
D = 0.600 with the UEP data set), black poplar showed
lower (and non-significant for FST or NST) genetic differentiation across drainage basins (0.130 ⁄ 0.032 ⁄ 0.432 for
FCT ⁄ NCT ⁄ D) and inconsistent values for differentiation
across river basins (low and non-significant for F- and
N-statistics but relatively high for Jost’s D; Table 2).
� 2012 Blackwell Publishing Ltd
Isolation by distance (i.e. positive slopes) was found
in white poplar, albeit with different strengths at different spatial scales. Regression slopes showed stronger
(and significant) IBD among river basins than within
them, highlighting the isolation effect produced by the
dependence of white poplar on water courses (Table 3;
see also Fig. S2, Supporting information). Within-basin
IBD was found in the Duero when regressing on the
logarithm of Euclidean distance and (marginally,
0.05 < P < 0.10) in the Guadalquivir regressing on resistance distance. No IBD was found in the Ebro basin.
Levels of clonality and genetic structure at the local
scale
In white poplar, the five highly polymorphic nSSRs
identified 6–13 genets per population, with an average
4.2 ramets per genet (n ⁄ NG, Table 4). Clone size in this
species was highly variable (from a few metres to several kilometres). Three out of four white poplar populations had average clone sizes below 100 m. Larger
clonal assemblies, with one of them extending over
15 km (Fig. 4), were identified and confirmed with 14
additional SSRs in Aranda de Duero from the northern
Duero basin (a tundra-like area during glacial times).
This population also contained a higher number of genets (13) than other populations (6–9), resulting in similar
levels of (significant) overall fine-scale genetic structure
(Table 4). All populations (including Aranda de Duero)
had lower and non-significant kinship at >100 m distance classes (Table 4), suggesting that samples of individuals separated by >100 m for cpDNA analysis
consisted largely of unrelated individuals.
The grey poplar population was characterized by just
four genets with wide-ranging distances (up to 24 km)
among ramets. This surprising clonal structure could be
a consequence of propagation by farmers, as grey poplar is the only source of softwood in the region, and
occurs mostly in managed environments (e.g. abandoned watermills, farms, etc.).
Genetic differentiation for quantitative traits in white
poplar
Two of the four quantitative traits showed significant
overall genetic differentiation: HT3 with QST =
0.569 ± 0.149 (SD) and FOR3 with QST = 0.696 ± 0.114
(SD). Both traits had over three to sixfold higher differentiation among basins (0.435 ± 0.195 and 0.592 ± 0.120,
respectively) than within them (0.135 ± 0.046 and
0.104 ± 0.102, respectively). Populations from the Ebro
basin had generally taller and straighter individuals.
HT1 and DSB3 were not significantly different among
river basins. Given that secondary growth in trees is
�3602 D . M A C A Y A - S A N Z E T A L .
Table 2 Genetic differentiation among populations ⁄ groups at various hierarchical levels in white and black poplars from the Iberian
Peninsula. Differentiation was measured considering haplotypic frequencies (F-statistics and Jost’s D-statistics) or taking into account
genetic distances among haplotypes (N-statistics). Estimates are provided for haplotypes resolved using the complete data set or,
alternatively, using only UEPs (see text for details). All genetic differentiation estimates are significant at a = 0.05 unless stated otherwise (ns). NA: not available or not possible to compute
White poplar
Black poplar
Full set
UEPs
Full set
UEPs
Group
Level*
F-statistics
F-statistics
N-statistics
F-statistics
F-statistics
N-statistics
River basin
FCT
FSC
FST
FCT
FSC
FST
FCT
FSC
FST
0.165
0.616
0.679
0.090
0.653
0.685
0.082
0.655
0.683
0.670
0.320
0.632
0.750
)0.001ns
0.735
0.734
0.374
0.654
0.783
0.735
0.223
0.586
0.678
0.028ns
0.660
0.669
0.260
0.605
0.707
0.665
0.048ns
0.524
0.547
NA
NA
NA
0.043ns
0.532
0.552
0.542
0.170ns
0.568
0.642
NA
NA
NA
0.130ns
0.600
0.652
0.627
0.043ns
0.312
0.341
NA
NA
NA
0.032ns
0.324
0.346
0.331
0.773
NA
1.000
0.794
NA
0.661
NA
NA
NA
NA
0.744
0.737
0.892
0.889
0.586
NA
0.000ns
0.465
NA
0.723
NA
NA
NA
NA
0.432
0.695
0.501
0.600
Latitude
Drainage basin
Overall
Jost’s D-statistics
River basin
Duero
Catalonia
Ebro
Levante
Tajo
Guadalquivir
Latitude
North
South
Drainage basin
Atlantic
Mediterranean
Overall
Among
Within
Within
Within
Within
Within
Within
Among
Within
Within
Among
Within
Within
0.892
0.353
0.076ns
0.764
0.895
0.985
0.807
0.896
0.759
0.935
0.926
0.888
0.846
0.929
0.511
0.008ns
0.000ns
0.544
0.678
0.031ns
0.268
0.052
0.534
0.576
0.569
0.227
0.549
0.559
*FCT refers to genetic differentiation among groups (i.e. river basins, latitudes or drainage basins), FSC to genetic differentiation
among populations within groups and FST to genetic differentiation among populations without considering groups.
less important for early establishment than height differences, significant genetic differentiation for stem
diameter may become apparent in later common garden
assessments as trees mature. Interestingly, when compared to neutral markers for the same populations
using Whitlock’s (2008) approach (Table S5, Supporting
information), QST for FOR3 was significantly higher
than FST among river basins (P-value: 0.033, with FST
and QST 95% confidence intervals of 0.011–0.238 and
0.337–0.774, respectively), but not among populations
within them (P-value: 0.781, with FST and QST 95% confidence intervals of 0.086–0.247 and 0.000–0.303, respectively). For HT3, a similar trend was observed (P-value
for QST > FST among river basins: 0.151, P-value for
QST > FST within river basins: 0.715), but a high QST
variance among river basins for this trait (QST 95%
confidence intervals of 0.065–0.733) rendered the comparison not significant.
Discussion
Haplotype networks and shared polymorphism across
species
The paradoxical position of most black poplar haplotypes within the white poplar network and closeness to
aspen is consistent with previous hypotheses of ancient
hybridization followed by capture of Populus alba’s chloroplast by Populus nigra (Smith & Sytsma 1990). Hamzeh & Dayanandan (2004) observed a cyto-nuclear
incongruence for the phylogenetic position of black
poplar. They placed this species in the section Populus
� 2012 Blackwell Publishing Ltd
�G E N E T I C S T R U C T U R E I N I B E R I A N P O P L A R S 3603
hybridization events in shared glacial refugia and postglacial recolonization (e.g. Petit et al. 2002) and is maintained by recurrent interspecific gene flow (Lexer et al.
2006). In contrast, in species that do not currently
hybridize but that may have hybridized in the past, relatively recent reproductive isolation would result in a
progressive loss of shared haplotypes while retaining
close phylogenetic relationships. Our results in P. alba
and P. nigra are in agreement with the second explanation. The highly divergent P. nigra haplotype H14
(differing by 12 mutations from the closest haplotype in
the network) could then be more closely related to the
genuine, pre-introgressed P. nigra plastid genome.
Alternatively, haplotype introgression from commercial
Euroamerican clones (Vanden Broeck et al. 2006) or
from the ornamental Lombardy cultivar (Chenault et al.
2011) has been shown for P. nigra. Sequencing of a
diverse array of commercial clones (n = 14) found H14
among them (not shown), pointing to introgression,
despite being generally rare (<5%; Heinze & Lickl 2002
and references therein; but see Ziegenhagen et al. 2008
and Smulders et al. 2008a that reported c. 20–50% introgressed offspring in Elbe and Rhine rivers, respectively), as the most-likely explanation.
As DNA sequences revealed a complete segregation
among species, shared variants at ccmp2, ccmp5 and the
trnC-petN1 microsatellite are probably due to homoplasy rather than ancient hybridization. Microsatellites
usually have higher mutation rates than other regions
of the genome (reflected by a higher number of variants
Table 3 Isolation by distance (IBD) within and among river
basins of white poplar from the Iberian Peninsula (see also
Fig. S2, Supporting information). Pairwise genetic distances
expressed as FST ⁄ (1 ) FST) were regressed on the logarithm of
the Euclidean distance. For main river basins, regression slopes
with ‘resistance’ distances (i.e. geographic distances following
the river course) are also shown; *0.05 < P < 0.10,
**0.01 < P < 0.05, ***P < 0.01. NA: not available or not possible
to compute
Regression slopes
Different basins
Same basin
Duero
Ebro
Guadalquivir
Overall
log (Euclidean
distance)
Resistance
distance
0.86**
0.19
0.93**
)1.24
0.26
0.79***
NA
NA
0.3E-05
1.8E-05
0.3E-05*
NA
close to P. alba and P. tremula on the basis of cpDNA,
but in the section Aigeiros on nuclear DNA evidence. Its
inclusion in Aigeiros is in agreement with classical studies based on morphology (Eckenwalder 1996) and was
also supported by nuclear AFLP markers (Cervera et al.
2005). Haplotype sharing has been widely described in
sympatric, related tree species [for instance in European
ashes (Heuertz et al. 2006) or in white oaks (Petit et al.
2002)]. In species that hybridize readily, such as ashes
and oaks, haplotype sharing commonly occurred during
Table 4 Number and size of clonal assemblies, and fine-scale spatial genetic structure for four white poplar and one grey poplar
populations. All clone sizes are given as maximum among-ramet distance in metres; max (L): size of the largest clone, L: mean clone
size, min (L): size of the smallest clone, n: number of samples and NG: number of genets; standard errors of the regression slope (SE)
are computed by a jackknife resampling procedure. NA: not available or not possible to compute
Average kinship (Fij) by distance class
Population
White poplar
Aranda de
Duero
La Alfranca
Jimena
Villamanrique
de la
Condesa‡
Overall
Grey poplar
Montes de
Toledo
Slope
River basin
Max (L)
L
Min (L) n
NG 0–25
Duero
558.37†
163.58†
11.40†
36
13
0.324 0.272
0.209
0.074
)0.007 )1.2E-05 3.1E-06
25.69
30.30
NA
5.77
9.90
NA
49
33
32
9
6
8
0.386 0.164
0.421 0.340
NA
NA
0.038
0.209
NA
)0.028
)0.078
NA
0.082
0.114
NA
)3.6E-04 1.2E-04
)1.1E-03 2.8E-04
NA
NA
86.74
5.77
150 36
0.386 0.245
0.115
0.038
0.092
)8.2E-06 2.9E-06
50
0.267 0.286
0.514
0.516
0.198
)1.6E-05 2.1E-06
Ebro
32.32
Guadalquivir 62.61
Guadalquivir NA
558.37
Tajo
23749.85 13641.84 211.24
4
25–50 50–100 100–200 >200
*All slopes are significantly different from zero with P < 0.001, as tested by permutation.
†
Excluding one very large and widespread clone (four ramets stretched over 15 km; see Results).
‡
Spatial coordinates were not available for this population.
� 2012 Blackwell Publishing Ltd
b*
SE
�3604 D . M A C A Y A - S A N Z E T A L .
ED50 30N X686635 Y4606230
0
50
100
200 m
La Alfranca
GENOTYPES
1
2
3
4
5
6
7
8
9
ED50 30N X414930 Y4617020
0
GENOTYPES
1
2
3
0
4
50
5
100
6
7
8
9
10
11
12
13
5 km
Aranda de Duero
200 m
Fig. 4 Spatial distribution of clonal replicates from two contrasting white poplar populations. The La Alfranca population (top) had
smaller and less spread clonal assemblies than the Aranda de Duero population (bottom) that includes a clone stretching over c.
15 km.
in this study), making them more prone to homoplasy
(Provan et al. 2001). This condition makes them useful
for local and contemporary studies, especially those
where high levels of variability are desirable (e.g. parentage analysis), but discourages their use for phylogeographical inference in poplars.
The noteworthy lack of shared, or even closelyrelated, haplotypes between P. alba and P. tremula in
the IP contrasts with expectation, as these species often
hybridize and they are largely sympatric in this range.
However, a larger sampling of P. tremula should be carried out to confirm this observation. Finally, the pronounced divergence of the Moroccan endemic H08
from Iberian haplotypes indicates an ancient divergence
of North African and Iberian lineages (see below), as
previously noticed by Fussi et al. (2010) based on a limited sample of PCR-RFLP haplotypes.
Different species, different histories
Black poplar, while showing a similar degree of overall
genetic differentiation as white poplar, displayed higher
regional haplotypic genetic diversity and lower levels of
population genetic structure among river and drainage
basins. These results indicate that the two species have
different demographic histories. In particular, they
point to more frequent gene exchange across river and
drainage basins, and ⁄ or generally higher effective populations sizes in black poplar, which is to be expected in
view of its higher tolerance to cold temperatures
(Galán-Cela et al. 2003; Ruiz de la Torre 2006) and previous literature (e.g. Smulders et al. 2008b). Alternatively, the lower genetic structure in black poplar could
reflect a higher seed and cutting transfer by humans
across regions. However, the high number of private
� 2012 Blackwell Publishing Ltd
�G E N E T I C S T R U C T U R E I N I B E R I A N P O P L A R S 3605
haplotypes found in the IP in this (c. 40%) and in other
studies (e.g. Cottrell et al. 2005) does not support this
alternative hypothesis.
Similar patterns of high diversity and low differentiation have been observed in the more cold-tolerant species of other European tree genera, such as the six
native Iberian pine species (Soto et al. 2010), or in the
thermophilous Fraxinus angustifolia and the more coldtolerant F. excelsior (Heuertz et al. 2006). The bases of
these patterns are likely to be better survival of the
cold-tolerant species during the cold stages of past glaciations and early colonization of new territory, compared to thermophilous tree species. Our findings are
relevant because they extend these observations to
riparian trees that are normally not considered to be
dependent on regional climatic patterns and, thus, are
excluded from models of future species distributions
based on climate predictions (e.g. Benito-Garzón et al.
2008 for Iberian trees). Moreover, our findings suggest
that near-future predicted climatic change may affect
Iberian poplar species differentially, giving a competitive advantage to the more drought- and salt-tolerant
white poplar compared to black poplar. Competitive
exclusion from the already scarce riparian habitat
would possibly drive this already threatened species
(Lefèvre et al. 1998 and references therein) to lower
effective population numbers and, eventually, to local
extinctions.
Genetic signatures of ancient events in white poplar
The genus Populus appeared during the transition from
the Secondary to the Tertiary era and diversified into
different sections and species during the warm Paleogene period (Eckenwalder 1996). Modern species are
believed to have evolved during the global cooling in
the beginning of the Neogene (c. 23 Ma). During this
period, still warmer and wetter than today, and before
the beginning of the Quaternary, modern poplars
would have spread across the IP and northern Africa.
The North African and Iberian lineages of white poplar
would have diverged after their last possible contact at
the end of the Messinian Salinity Crisis c. 5.33 Ma,
when the Mediterranean Sea was desiccated (Krijgsman
et al. 1999; Duggen et al. 2003). The subsequent flooding of the Mediterranean basin has been associated to a
genetic discontinuity at the level of the Strait of Gibraltar in various organisms (Rodrı́guez-Sánchez et al. 2008;
see Jaramillo-Correa et al. 2010 for some forest trees).
Within the IP, a marked differentiation between the
Atlantic and Mediterranean drainage basins was found
in white poplar. This pattern has also been found in
other Iberian tree species (Rodrı́guez-Sánchez et al.
2010). This disjunction probably reflects a genetic
� 2012 Blackwell Publishing Ltd
signature of ancient geological events, considering that
the main Iberian mountain systems attained their
current configuration during the late Miocene. The fact
that F-statistics using the UEP data indicated stronger
differentiation (0.374 vs. 0.082) than using the complete
polymorphism set (assumed to be affected by recent
mutation) also pointed at ancient phylogeographic processes. Consistent with its lower sensitivity to mutation,
Jost’s D statistic did not reflect these differences.
The reasons for the significant differentiation between
drainage basins (Atlantic vs. Mediterranean) are not
obvious, considering that major Iberian mountain systems run from west to east, thus mostly preventing latitudinal migration (i.e. among river basins but not
between drainage areas). One explanation that can
apply to plants, and more specifically to riparian trees,
is related to the vegetation altitudinal shifts produced
by glacial climatic oscillations (Hewitt 1996; Rodrı́guezSánchez et al. 2010). The relatively benign climate
before the Pleistocene should have favoured extensive
gene exchange across drainage basins, even for lowland
species. Then, during the Pleistocene cold periods, altitudinal limits for plant species lowered and riparian
trees probably became confined to the lower river
courses. This process resulted in distributions close to
the western and eastern coastal fringes of the IP where
the main Iberian rivers flow into the sea. In this way,
the Atlantic and Mediterranean drainage basins would
have become effectively separated while migration
along the coastlines (where mountain ranges are lower)
would have connected river basins. Our results in white
poplar suggest that increasing isolation between Atlantic and Mediterranean drainage basins occurred c.
1.12 Ma (lower bound of 3.11 Ma), in agreement with
the proposed scenario related to Pleistocene cooling.
Regional and population effects of glacial times in
white poplar
The patterns of genetic diversity and structure in white
poplar reflect the effects of Pleistocene climatic oscillations in several ways. First, regional genetic diversity
was higher and private haplotypes were four times
more abundant in the southern Iberian river basins,
which were warmer than the northern basins. Secondly,
genetic structure among populations was much more
pronounced in the southern Guadalquivir and Levante
basins than in the northern Duero and Catalonia basins.
Thirdly, in the formerly tundra-like Duero basin, significant IBD was found only when considering Euclidean
geographical distances, but not ‘resistance’ distances.
This IBD pattern is more consistent with a rapid isotropic postglacial spread than with a long-term build-up
of SGS along linear favourable environments. Fourthly,
�3606 D . M A C A Y A - S A N Z E T A L .
clonal assemblies were apparently larger (with some
clones extending up to c. 15 km) in the colder Duero
basin than in the southern basins. Asexual propagation
could have helped Iberian poplars to survive in harsh
glacial environments and to colonize new territory rapidly once ecological conditions improved (Silvertown
2008).
Pleistocene glacial oscillations lowered temperature
and humidity globally. Palaeoecological inferences indicate that during the glacial maxima, areas in the westernand northernmost IP (like the Duero basin) were barely
habitable by arboreal vegetation (González-Sampériz
et al. 2010). Northern populations of the thermophilous
white poplar show a genetic depauperation that seems to
reflect these past events. The hostile climatic conditions
suffered during Pleistocene glacial periods in these areas
could have pushed white poplar populations towards
one of two fates: (i) an important population size reduction, but persistence in sheltered ‘cryptic refugia’ (sensu
Stewart & Lister 2001); or (ii) local extinction followed by
postglacial recolonization. The first scenario would have
resulted in reduced genetic diversity but would have
maintained common local haplotypes in surviving populations (Provan & Bennett 2008). In the second situation,
diversity would have been reduced due to founder
effects, and the region would have been replenished with
(non-local) haplotypes from the colonizing populations.
Our data support the first scenario, showing significant
genetic differentiation among northern and southern
river basins and presence of private haplotypes in both
latitudes. The existence of cryptic local refugia and recent
spread of surviving genotypes is also a plausible explanation for the high haplotypic diversity observed in
white poplar populations from Austria (Fussi et al. 2010)
and the discovery of huge clonal assemblies of the species in Sardinia and Malta (Brundu et al. 2008; Fussi et al.
2012). Signals of glacial survivorship in scattered populations situated beyond the estimated persistence limit
have been widely observed in boreal and alpine latitudes
(Hewitt 2004; Opgenoorth et al. 2010), including for
some Salicaceae (e.g. Palmé et al. 2003 for Salix sp.).
Evidence for local adaptation in white poplar
Several decades of common garden experiments have
revealed the widespread occurrence of locally adapted
populations in forest trees (see reviews in McKay & Latta
2002; Latta 2004; Savolainen et al. 2007), including some
Populus species (see Fig. 4 in Savolainen et al. 2007 for
Populus balsamifera and Populus tremuloides). The higher
quantitative (QST) than molecular (FST) genetic differentiation found across river basins, albeit not within river
basins, for some growth traits in white poplar suggests
that this species is also locally adapted, but at wider spa-
tial scales (i.e. river basins that can span hundreds of
kilometres) than in other temperate trees. White poplar
populations have typically low population sizes, given
their dependence on phreatic water and the high anthropization of Iberian riparian habitats, which breaks
the continuity of riparian forests. Human impact is most
noteworthy in the low- and medium water courses
where white poplar is more abundant (Ruiz de la Torre
2006). Our findings suggest the role of gene flow over
mesoscale distances, replenishing genetic variation and
counteracting local genetic drift. Lack of IBD patterns
also suggests frequent gene exchange along river courses
within basins, at least for those Iberian rivers where glacial impact was low (see above). In this scenario, the relative homogeneity of riparian habitats would have
counteracted the arrival of maladapted genotypes, preventing the development of ‘migration meltdown’ processes (i.e. self-reinforced processes in which
immigration of maladapted genotypes decreases local
density, which in turn increases immigration rates bringing in more maladapted genotypes; Lenormand 2002),
which can eventually result in population extinction.
Theoretical models have shown the potential beneficial
effects of gene flow for small peripheral populations (Alleaume-Benharira et al. 2006), and experimental evidence
is accumulating (e.g. Sexton et al. 2011).
The existence of local adaptation and specialized phenotypes has direct consequences for the adaptive
response of white poplar to future environments, such
as those predicted by the Intergovernmental Panel on
Climatic Change (IPCC, http://www.ipcc.ch, accessed
on May, 2012). Indeed, past adaptation processes have
most likely generated a wide array of standing genetic
variation that may prove of utility beyond the current
range of the species. This expectation highlights the
need for a wider exploration of genetic resources in this
species as well as for the establishment of large multisite common gardens.
Conclusions
Past climate conditions have left genetic signatures in
riparian tree species, such as the Iberian poplars. Some
of these signatures reflect early Pleistocene events that
led to differentiation of gene pools in the Mediterranean
and Atlantic drainage basins. Genetic diversity is higher
and genetic differentiation lower in cold-tolerant black
poplar than in thermophilous white poplar, and we
speculate that cold-tolerance resulted in better survival
and higher gene exchange across geographical barriers
of this species during past glaciations, as shown elsewhere for other cold-tolerant trees. Patterns of IBD in
white poplar reflect its dependence on phreatic water,
resulting in higher IBD among river basins than within.
� 2012 Blackwell Publishing Ltd
�G E N E T I C S T R U C T U R E I N I B E R I A N P O P L A R S 3607
At the local scale, SGS is greatly influenced by the
widespread existence of clonal assemblies extending, in
a few cases, up to several kilometres. Nevertheless, the
presence of numerous genets of small clone size points
out to asexual propagation as a means for maintaining
genetic diversity under harsh environments (rather than
reducing the effective population size) and for colonizing new territory rapidly. Asexual propagation did not
seem to prevent local adaptation in white poplar. Gene
flow at mesoscale distances seems sufficient to counteract genetic drift and to promote local adaptation at the
river-basin scale. Riparian trees occupy very specialized
niches surrounded by large inhospitable areas. The existence of locally adapted phenotypes, even in highly
structured species such as the Iberian poplars, is
remarkable and suggests some resilience of poplar populations to environmental change and a capacity to
adapt when confronted with new environments.
Acknowledgements
We are indebted to José Antonio Mancha, Santiago de Blas and
Fernando del Caño for help in sample collection, and Carmen
Garcı́a Barriga and Marı́a Teresa Cervera for lab assistance and
advice. We are also grateful to P. C. Grant for reviewing the English language. This work was supported by project REPROFOR
(AGL2005-07440-C02-01, Ministry of Education and Science).
The contribution of the EU EVOLTREE Network of Excellence
and the Collaborative Project on ‘Conservation of Forest
Genetic Resources’ between the MARM and the National Institute for Agriculture and Food Research and Technology, INIA
(AEG06-054) is also acknowledged. We want to specially
acknowledge the contribution of Nuria Alba to this study. She
contributed to the collection of the samples of Populus alba, the
isozyme analysis and the quantitative evaluation. She passed
away on January 2nd, 2012.
References
Alba N (2000) Variabilidad genética de Populus alba L. mediante
caracteres isoenzimáticos y fenotı́picos. PhD Dissertation,
Polytechnic University of Madrid, Madrid.
Alleaume-Benharira M, Pen IR, Ronce O (2006) Geographical
patterns of adaptation within a species’ range: interactions
between drift and gene flow. Journal of Evolutionary Biology,
19, 203–215.
Anderson LL, Hu FS, Nelson DM, Petit RJ, Paige KN (2006)
Ice-age endurance: DNA evidence of a white spruce
refugium in Alaska. Proceedings of the National Academy of
Sciences of the United States of America, 103, 12447–12450.
Benito-Garzón M, Sánchez de Dios R, Sáinz Ollero H (2008)
Effects of climate change on the distribution of Iberian tree
species. Applied Vegetation Science, 11, 169–178.
Brundu G, Lupi R, Zapelli I et al. (2008) The origin of clonal
diversity and structure of Populus alba in Sardinia: evidence
from nuclear and plastid microsatellite markers. Annals of
Botany, 102, 997–1006.
� 2012 Blackwell Publishing Ltd
Bryan GJ, McNicoll J, Ramsay G, Meyer RC, De Jong WS
(1999) Polymorphic simple sequence repeat markers in
chloroplast genomes of Solanaceous plants. Theoretical and
Applied Genetics, 99, 859–867.
Cervera MT, Storme V, Soto A et al. (2005) Intraspecific and
interspecific genetic and phylogenetic relationships in the
genus Populus based on AFLP markers. Theoretical and
Applied Genetics, 111, 1440–1456.
Cheddadi R, Vendramin GG, Litt T et al. (2006) Imprints of
glacial refugia in the modern genetic diversity of Pinus
sylvestris. Global Ecology and Biogeography, 15, 271–282.
Chenault N, Arnaud-Haond S, Juteau M et al. (2011) SSRbased analysis of clonality, spatial genetic structure and
introgression from the Lombardy poplar into a natural
population of Populus nigra L. along the Loire River. Tree
Genetics & Genomes, 7, 1249–1262.
Clement M, Posada D, Crandall KA (2000) TCS: a computer
program to estimate gene genealogies. Molecular Ecology, 9,
1657–1659.
Cottrell JE, Krystufek V, Tabbener HE et al. (2005) Postglacial
migration of Populus nigra L.: lessons learnt from chloroplast
DNA. Forest Ecology and Management, 206, 71–90.
Dorman CE, Beardsley RC, Limeburner R (1995) Winds in the
Strait of Gibraltar. Quarterly Journal of the Royal Meteorological
Society, 121, 1903–1921.
Doyle JJ, Doyle JL (1990) Isolation of plant DNA from fresh
tissue. Focus, 12, 13–15.
Duggen S, Hoernle K, van den Bogaard P, Rüpke L, Morgan JP
(2003) Deep roots of the Messinian salinity crisis. Nature, 422,
602–606.
Eckenwalder JE (1996) Systematics and evolution of Populus.
In: Biology of Populus and Its Implications for Management and
Conservation (eds Stettler RF, Bradshaw HD, Heilman PE,
Hinckley TM), pp. 7–32. NRC Research Press, Ottawa,
Ontario.
Excoffier L, Laval G, Schneider S (2005) Arlequin (version 3.0):
an integrated software package for population genetics data
analysis. Evolutionary Bioinformatics, 1, 47–50.
Fussi B, Lexer C, Heinze B (2010) Phylogeography of Populus
alba L. and Populus tremula L. in Central Europe: secondary
contact and hybridisation during recolonisation from
disconnected refugia. Tree Genetics & Genomes, 6, 439–450.
Fussi B, Bonello J, Calleja E, Heinze B (2012) Combining the
use of molecular techniques and archival documentary
evidence to trace the origin of Populus alba in a Central
Mediterranean archipelago. European Journal of Forest
Research, 131, 347–354.
Galán-Cela P, Gamarra-Gamarra R, Garcı́a-Viñas JI (2003)
Árboles y arbustos de la Penı́nsula Ibérica e Islas Baleares, 4th
edn. Eds Jaguar, Madrid.
Gerlach G, Jueterbock A, Kraemer P, Deppermann J, Harmand
P (2010) Calculations of population differentiation based on
GST and D: forget GST but not all of statistics!. Molecular
Ecology, 19, 3845–3852.
Gómez A, Lunt DH (2007) Refugia within refugia: patterns of
phylogeographic concordance in the Iberian Peninsula. In:
Phylogeography of Southern European Refugia: Evolutionary
Perspectives on the Origins and Conservation of European
Biodiversity (eds Weiss S, Ferrand N), pp. 155–188. Springer,
Dordrecht, The Netherlands.
�3608 D . M A C A Y A - S A N Z E T A L .
González-Martı́nez SC, Dubreuil M, Riba M et al. (2010)
Spatial genetic structure of Taxus baccata L. in the western
Mediterranean Basin: past and present limits to gene
movement over a broad geographic scale. Molecular
Phylogenetics and Evolution, 55, 805–815.
González-Sampériz P, Leroy SAG, Carrión JS et al. (2010)
Steppes, savannahs, forests and phytodiversity reservoirs
during the Pleistocene in the Iberian Peninsula. Review of
Palaeobotany and Palynology, 162, 427–457.
Guillot G, Leblois R, Coulon A, Frantz AC (2009) Statistical
methods in spatial genetics. Molecular Ecology, 18, 4734–4756.
Hampe A, Petit RJ (2005) Conserving biodiversity under
climate change: the rear edge matters. Ecology Letters, 8, 461–
467.
Hamzeh M, Dayanandan S (2004) Phylogeny of Populus
(Salicaceae) based on nucleotide sequences of chloroplast
trnT-trnF region and nuclear rDNA. American Journal of
Botany, 91, 1398–1408.
Hardy OJ, Vekemans X (2002) SPAGEDi: a versatile computer
program to analyse spatial genetic structure at the individual
or population levels. Molecular Ecology Notes, 2, 618–620.
Heinze B, Lickl E (2002) Rare, but steady, introgression in
Austrian black poplar as a long-term risk? In: Genetic
Diversity in River Populations of European Black Poplar (eds
Van Dam B, Bordacs S), pp. 169–175. Csiszár Nyomda Ltd,
Budapest.
Heuertz M, Carnevale S, Fineschi S et al. (2006) Chloroplast
DNA phylogeography of European ashes, Fraxinus sp.
(Oleaceae): roles of hybridization and life history traits.
Molecular Ecology, 15, 2131–2140.
Hewitt GM (1996) Some genetic consequences of ice ages, and
their role in divergence and speciation. Biological Journal of
the Linnean Society, 58, 247–276.
Hewitt GM (2004) Genetic consequences of climatic oscillations
in the Quaternary. Philosophical Transactions of the Royal
Society of London. Series B, Biological Sciences, 359, 183–195.
Huntley B, Birks H (1983) An Atlas of Past and Present Pollen
Maps for Europe: 0–13000 Years Ago. Cambridge University
Press, Cambridge.
Ingvarsson PK (2008) Multilocus patterns of nucleotide
polymorphism and the demographic history of Populus
tremula. Genetics, 180, 329–340.
Jaramillo-Correa JP, Grivet D, Terrab A et al. (2010) The Strait
of Gibraltar as a major biogeographic barrier in
Mediterranean conifers: a comparative phylogeographic
survey. Molecular Ecology, 19, 5452–5468.
Jost L (2008) GST and its relatives do not measure
differentiation. Molecular Ecology, 17, 4015–4026.
Krijgsman W, Hilgen FJ, Raffi I, Sierro FJ, Wilson DS (1999)
Chronology, causes and progression of the Messinian
salinity crisis. Nature, 400, 652–655.
Latta RG (2004) Gene flow, adaptive population divergence
and comparative population structure across loci. New
Phytologist, 161, 51–58.
Lefèvre F, Legionnet A, Vries S, Turok J (1998) Strategies for
the conservation of a pioneer tree species, Populus nigra L.,
in Europe. Genetics Selection Evolution, 30, S181–S196.
Lenormand T (2002) Gene flow and the limits to natural
selection. Trends in Ecology & Evolution, 17, 183–189.
Lexer C, Fay MF, Joseph JA, Nica MS, Heinze B (2005) Barrier
to gene flow between two ecologically divergent Populus
species, P. alba (white poplar) and P. tremula (European
aspen): the role of ecology and life history in gene
introgression. Molecular Ecology, 14, 1045–1057.
Lexer C, Kremer A, Petit RJ (2006) Shared alleles in sympatric
oaks: recurrent gene flow is a more parsimonious
explanation than ancestral polymorphism. Molecular Ecology,
15, 2007–2012.
Loiselle BA, Sork VL, Nason J, Graham C (1995) Spatial genetic
structure of a tropical understory shrub, Psychotria officinalis
(Rubiaceae). American Journal of Botany, 82, 1420–1425.
Magri D, Fineschi S, Bellarosa R et al. (2007) The distribution
of Quercus suber chloroplast haplotypes matches the
palaeogeographical history of the western Mediterranean.
Molecular Ecology, 16, 5259–5266.
McKay JK, Latta RG (2002) Adaptive population divergence:
markers, QTL and traits. Trends in Ecology & Evolution, 17,
285–291.
Medail F, Diadema K (2009) Glacial refugia influence plant
diversity patterns in the Mediterranean Basin. Journal of
Biogeography, 36, 1333–1345.
Nei M (1978) Estimation of average heterozygosity and genetic
distance from a small number of individuals. Genetics, 89,
583–590.
Nichols RA, Hewitt GM (1994) The genetic consequences of
long-distance dispersal colonization. Heredity, 72, 312–317.
Nieto-Feliner G (2011) Southern European glacial refugia: a tale
of tales. Taxon, 60, 365–372.
Opgenoorth L, Vendramin GG, Mao K et al. (2010) Tree
endurance on the Tibetan Plateau marks the world’s highest
known tree line of the Last Glacial Maximum. New
Phytologist, 185, 332–342.
Palmé AE, Semerikov V, Lascoux M (2003) Absence of
geographical structure of chloroplast DNA variation in
sallow, Salix caprea L. Heredity, 91, 465–474.
Petit RJ, El Mousadik A, Pons O (1998) Identifying populations
for conservation on the basis of genetic markers. Conservation
Biology, 12, 844–855.
Petit RJ, Csaikl UM, Bordacs S et al. (2002) Chloroplast DNA
variation in European white oaks – phylogeography and
patterns of diversity based on data from over 2600
populations. Forest Ecology and Management, 156, 5–26.
Petit RJ, Hu FS, Dick CW (2008) Forests of the past: a window
to future changes. Science, 320, 1450–1452.
Provan J, Bennett KD (2008) Phylogeographic insights into
cryptic glacial refugia. Trends in Ecology & Evolution, 23, 564–
571.
Provan J, Powell W, Hollingsworth PM (2001) Chloroplast
microsatellites: new tools for studies in plant ecology and
evolution. Trends in Ecology & Evolution, 16, 142–147.
Rodrı́guez-Sánchez F, Perez-Barrales R, Ojeda F, Vargas P,
Arroyo J (2008) The Strait of Gibraltar as a melting pot for
plant biodiversity. Quaternary Science Reviews, 27, 2100–
2117.
Rodrı́guez-Sánchez F, Hampe A, Jordano P, Arroyo J (2010)
Past tree range dynamics in the Iberian Peninsula inferred
through phylogeography and palaeodistribution modelling:
a review. Review of Palaeobotany and Palynology, 162, 507–521.
Roiron P, Ali AA, Guendon JL, Carcaillet C, Terral JF (2004)
Evidence of the indigenous status of Populus alba L. in the
western Mediterranean Basin. Comptes Rendus Biologies, 327,
125–132.
� 2012 Blackwell Publishing Ltd
�G E N E T I C S T R U C T U R E I N I B E R I A N P O P L A R S 3609
Ruiz de la Torre J (2006) Flora Mayor. Organismo Autónomo
Parques
Nacionales,
Dirección
General
para
la
Biodiversidad, Madrid.
Savolainen O, Pyhajarvi T, Knurr T (2007) Gene flow and local
adaptation in trees. Annual Review of Ecology Evolution and
Systematics, 38, 595–619.
Sexton JP, Strauss SY, Rice KJ (2011) Gene flow increases
fitness at the warm edge of a species’ range. Proceedings of
the National Academy of Sciences of the United States of America,
108, 11704–11709.
Silvertown J (2008) The evolutionary maintenance of sexual
reproduction: evidence from the ecological distribution of
asexual reproduction in clonal plants. International Journal of
Plant Sciences, 169, 157–168.
Slavov GT, Zhelev P (2010) Salient biological features,
systematics and genetic variation of Populus. In: Genetic and
Genomics of Populus (eds Jansson S, Bhalerao RP, Groover
AT), pp. 15–38. Springer, Dordrecht, The Netherlands.
Smith RL, Sytsma KJ (1990) Evolution of Populus nigra (sect
Aigeiros) – introgressive hybridization and the chloroplast
contribution of Populus alba (sect Populus). American Journal of
Botany, 77, 1176–1187.
Smulders MJM, Beringen R, Volosyanchuk R et al. (2008a)
Natural hybridisation between Populus nigra L. and P. x
canadensis Moench: hybrid offspring competes for niches
along the Rhine river in the Netherlands. Tree Genetics &
Genomes, 4, 663–675.
Smulders MJM, Cottrell J, Lefèvre F et al. (2008b) Structure of
the genetic diversity in black poplar (Populus nigra L.)
populations across European river systems: consequences for
conservation and nature development. Forest Ecology and
Management, 255, 1388–1399.
Soto A, Robledo-Arnuncio JJ, González-Martı́nez SC, Smouse
PE, Alia R (2010) Climatic niche and neutral genetic
diversity of the six Iberian pine species: a retrospective and
prospective view. Molecular Ecology, 19, 1396–1409.
Stewart JR, Lister AM (2001) Cryptic northern refugia and the
origins of the modern biota. Trends in Ecology & Evolution,
16, 608–613.
Stuefer JF, Erschbamer B, Huber H, Suzuki J-I (2002) Ecology
and Evolutionary Biology of Clonal Plants. Kluwer Academic
Pub. Group, Dordrecht, The Netherlands.
Valière N (2002) GIMLET: a computer program for analysing
genetic individual identification data. Molecular Ecology
Notes, 2, 377–379.
Vanden Broeck A, Cottrell J, Quataert P et al. (2006) Paternity
analysis of Populus nigra L. offspring in a Belgian plantation
of native and exotic poplars. Annals of Forest Science, 63, 783–
790.
Weising K, Gardner RC (1999) A set of conserved PCR primers
for the analysis of simple sequence repeat polymorphisms in
chloroplast genomes of dicotyledonous angiosperms.
Genome, 42, 9–19.
Whitlock MC (2008) Evolutionary inference from QST. Molecular
Ecology, 17, 1885–1896.
Wilson IJ, Weale ME, Balding DJ (2003) Inferences from DNA
data: population histories, evolutionary processes and
forensic match probabilities. Journal of the Royal Statistical
Society: Series A (Statistics in Society), 166, 155–188.
Ziegenhagen B, Gneuss S, Rathmacher G et al. (2008) A fast
and simple genetic survey reveals the spread of poplar
� 2012 Blackwell Publishing Ltd
hybrids at a natural Elbe river site. Conservation Genetics, 9,
373–379.
D.M.S. develops a PhD on genetic structure, including clonal
structure, and hybridization of Iberian poplars. M.H. is interested in population and evolutionary genetics of plant species
from biodiversity hotspots at temperate and tropical latitudes.
U.L.H. has broad interests in phylogeography and ecological
genetics of forest trees. A.I.L. and E.H’s research focuses on
the study of genetic diversity and population structure, and
the molecular characterization of commercial woody plants.
C.M. and A.P. are interested in conservation and use of plant
genetic resources, in particular those of poplars and other
trees. R.A. and S.C.G.M. have broad interests in population
genetics and genomics of forest trees, ecological genetics and
the evolution of Mediterranean plants, using quantitative and
molecular genetics approaches.
Data accessibility
GenBank accessions for cpDNA haplotypes: JQ782847–
JQ782883 (see Table S3, Supporting information for correspondence between accession numbers and haplotypes and
Table S4, Supporting information for haplotype counts per
population).
Chloroplast microsatellite data deposited in the Dryad repository doi:10.5061/dryad.9hd71135.
Supporting information
Additional supporting information may be found in the online
version of this article.
Table S1 Population names, location and basic description,
including expected heterozygosity estimates (HE).
Table S2 Annealing temperatures, number of PCR cycles and
source of nuclear microsatellites.
Table S3 Haplotype definition.
Table S4 Haplotype counts per population. Full haplotypes are
coded with ‘h’ and UEP haplotypes with ‘H’.
Table S5 Test for QST > FST following Whitlock (2008) for total
height (HT3) and stem form (FOR3) at age 3.
Fig. S1 Distribution of haplotypic diversity in Iberian poplars
calculated as Nei’s unbiased expected heterozygosity (HE) for
the full data set of cpSSRs and cpDNA sequences.
Fig. S2 Scatter plots of pairwise genetic distances expressed as
FST ⁄ (1 ) FST) against the logarithm of the Euclidean distance
within and among river basins of white poplar from the Iberian Peninsula.
Please note: Wiley-Blackwell are not responsible for the content
or functionality of any supporting information supplied by the
authors. Any queries (other than missing material) should be
directed to the corresponding author for the article.
�
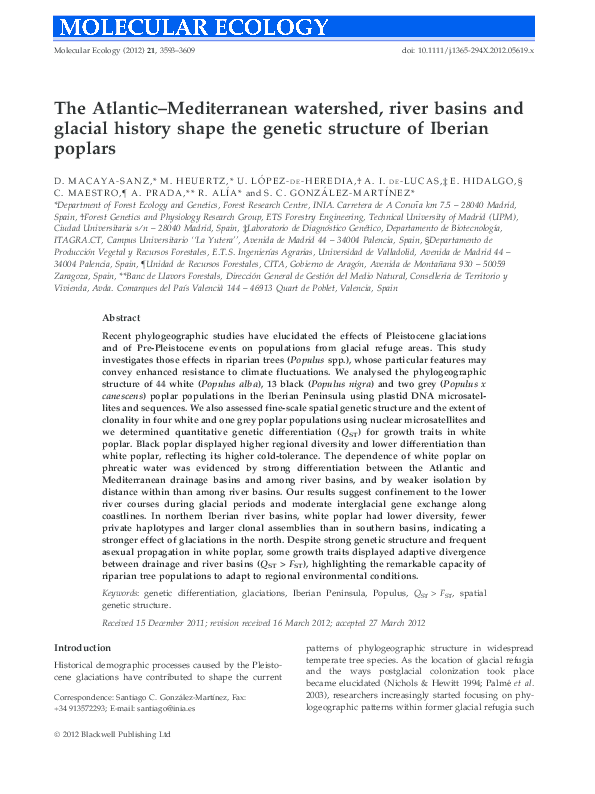
 Ana I de Lucas