Article
pubs.acs.org/est
Multivariate Statistical Methods for the Environmental Forensic
Classification of Coal Tars from Former Manufactured Gas Plants
Laura A. McGregor,*,† Caroline Gauchotte-Lindsay,† Niamh Nic Daéid,‡ Russell Thomas,§
and Robert M. Kalin†
†
David Livingstone Centre for Sustainability, Department of Civil and Environmental Engineering, University of Strathclyde, Graham
Hills Building, 50 Richmond Street, Glasgow, United Kingdom
‡
Centre for Forensic Science, Department of Pure and Applied Chemistry, University of Strathclyde, Royal College Building, 204
George Street, Glasgow, United Kingdom
§
Parsons Brinckerhoff, Queen Victoria House, Redland Hill, Bristol, United Kingdom
S Supporting Information
*
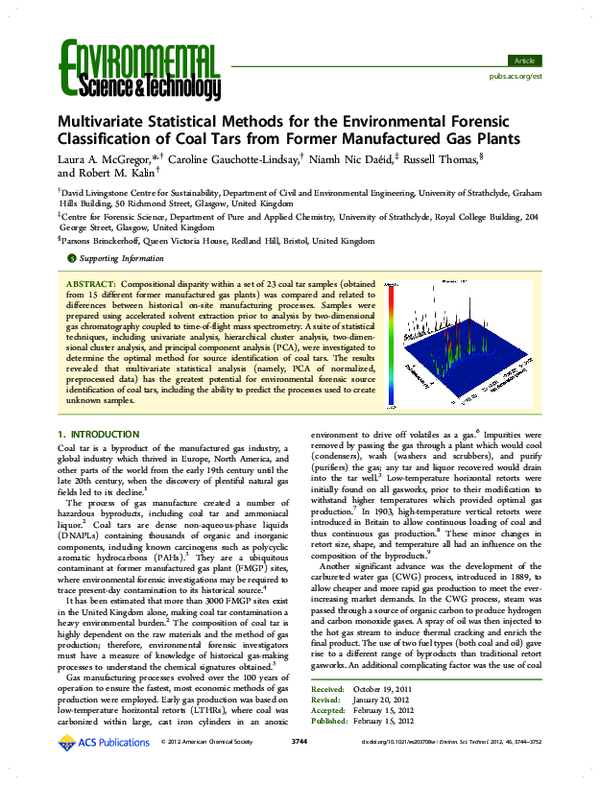
ABSTRACT: Compositional disparity within a set of 23 coal tar samples (obtained
from 15 different former manufactured gas plants) was compared and related to
differences between historical on-site manufacturing processes. Samples were
prepared using accelerated solvent extraction prior to analysis by two-dimensional
gas chromatography coupled to time-of-flight mass spectrometry. A suite of statistical
techniques, including univariate analysis, hierarchical cluster analysis, two-dimensional cluster analysis, and principal component analysis (PCA), were investigated to
determine the optimal method for source identification of coal tars. The results
revealed that multivariate statistical analysis (namely, PCA of normalized,
preprocessed data) has the greatest potential for environmental forensic source
identification of coal tars, including the ability to predict the processes used to create
unknown samples.
environment to drive off volatiles as a gas.6 Impurities were
removed by passing the gas through a plant which would cool
(condensers), wash (washers and scrubbers), and purify
(purifiers) the gas; any tar and liquor recovered would drain
into the tar well.3 Low-temperature horizontal retorts were
initially found on all gasworks, prior to their modification to
withstand higher temperatures which provided optimal gas
production.7 In 1903, high-temperature vertical retorts were
introduced in Britain to allow continuous loading of coal and
thus continuous gas production.8 These minor changes in
retort size, shape, and temperature all had an influence on the
composition of the byproducts.9
Another significant advance was the development of the
carbureted water gas (CWG) process, introduced in 1889, to
allow cheaper and more rapid gas production to meet the everincreasing market demands. In the CWG process, steam was
passed through a source of organic carbon to produce hydrogen
and carbon monoxide gases. A spray of oil was then injected to
the hot gas stream to induce thermal cracking and enrich the
final product. The use of two fuel types (both coal and oil) gave
rise to a different range of byproducts than traditional retort
gasworks. An additional complicating factor was the use of coal
1. INTRODUCTION
Coal tar is a byproduct of the manufactured gas industry, a
global industry which thrived in Europe, North America, and
other parts of the world from the early 19th century until the
late 20th century, when the discovery of plentiful natural gas
fields led to its decline.1
The process of gas manufacture created a number of
hazardous byproducts, including coal tar and ammoniacal
liquor.2 Coal tars are dense non-aqueous-phase liquids
(DNAPLs) containing thousands of organic and inorganic
components, including known carcinogens such as polycyclic
aromatic hydrocarbons (PAHs).3 They are a ubiquitous
contaminant at former manufactured gas plant (FMGP) sites,
where environmental forensic investigations may be required to
trace present-day contamination to its historical source.4
It has been estimated that more than 3000 FMGP sites exist
in the United Kingdom alone, making coal tar contamination a
heavy environmental burden.2 The composition of coal tar is
highly dependent on the raw materials and the method of gas
production; therefore, environmental forensic investigators
must have a measure of knowledge of historical gas-making
processes to understand the chemical signatures obtained.5
Gas manufacturing processes evolved over the 100 years of
operation to ensure the fastest, most economic methods of gas
production were employed. Early gas production was based on
low-temperature horizontal retorts (LTHRs), where coal was
carbonized within large, cast iron cylinders in an anoxic
© 2012 American Chemical Society
Received:
Revised:
Accepted:
Published:
3744
October 19, 2011
January 20, 2012
February 15, 2012
February 15, 2012
dx.doi.org/10.1021/es203708w | Environ. Sci. Technol. 2012, 46, 3744−3752
�Environmental Science & Technology
Article
Table 1. Summary of Manufacturing Processes Employed at FMGP Sites Investigated in This Studya
site
name
DNAPL
label
site classb
manufacturing process(es)d
years of operation
vertical retorts, potential traces of CWG, oil reforming, and early horizontal retort tar
horizontal retorts
horizontal retorts
horizontal (early, low-temperature) and vertical retorts plus CWG plant
horizontal retorts
wood preservation sitedistillation of coal tar for creosote oil
complex mixture, including CWG plant, horizontal and vertical retorts, tar distillation, and oil
gas
CWG plant
horizontal retorts, potential traces of CWG and coke oven tar
tully gas plant, combination of vertical retorts and water gas
horizontal retorts (early, low-temperature)
coke ovens (at a steelworks)
coke ovens (at a steelworks)
vertical retorts, potential traces of CWG tar
horizontal retorts (early, low-temperature)
vertical retorts
1836−1971
1856−1969
1856−1971
ceased production by 1953
1849−1981
unknown
1854 to unknown
S1
S2
S3
S4
S5
S6
S7
1−6
7
8
9
10
11
12
VR
HR
HR
VR/CWG
HR
CR
CWG
S8
S9
S10
S11
S12
S12
S13
S14
S15
13
14 and 17
15
16
18
19
20c
21 and 22
23c
CWG
HR
VR
LTHR
CO
CO
VR
HR
VR
1885 to unknown
unknown
1841−1961
1854−1946
1970s to present day
1930s to present day
1885 to unknown
ceased production by 1870
1896−1979
a
FMGP sites have been anonymized for confidentiality reasons. bThe probable site classes (VR = vertical retort, HR = horizontal retort, LTHR =
low-temperature horizontal retort, CR = creosote, CWG = carbureted water gas, and CO = coke oven) were assigned on the basis of historical site
data which indicated the periods of operation for each process. Labels correspond with those given in Figures 2−5. cSample used as part of a blind
study, site details only disclosed after analysis and data processing were completed. dAdditional site details are provided in the Supporting
Information.
tar as a feedstock for the chemical industry, such as the
production of dyes or creosote for wood treatment. Therefore,
it is possible to find coal tar contamination at sites other than
FMGPs.10
Environmental forensic based chemical fingerprinting of
different coal tar types has not been thoroughly reported in the
literature, and analytical techniques have previously limited the
information that could be obtained from such complex
samples.3 The early literature focused on the presence/absence
of certain chemical classes rather than individual constituents,
as this would have required extensive distillation and
fractionation processes.9,11 For example, it has been reported
that CWG tars contain a high abundance of alkanes (due to the
carburetion oil) but low quantities of naphthalenes and phenols
compared to retort tars,9 while differences in tar composition
due to retort shape are mainly thought to have been caused by
differences in the surface area and contact time of evolved gases
with the heated retort walls.12 More recent studies have
investigated the possibility of using diagnostic ratios to
differentiate between major coal tar types.4,13 However, simple
ratios focus on a very small portion of the overall coal tar
signature, thereby limiting the source identification capability.
The enhanced separation capacity of comprehensive twodimensional gas chromatography (GC×GC) can provide a
wealth of information on coal tar composition without the need
for rigorous, time-consuming sample fractionation.14 Previous
coal tar research by McGregor et al.14 has focused on the
optimization of extraction and analysis procedures to provide
the entire coal tar signature in a single-step process.
Consequently, this study aims to refine the statistical methods
which are essential to elucidate the compositional differences
between coal tars from the large volumes of chemical data
produced by GC×GC analyses.15 This study investigates a
number of univariate and multivariate statistical methods for
source-specific correlation of the chemical signatures of various
types of coal tar DNAPLs.
2. EXPERIMENTAL SECTION
The analytical approach employed in this study consists of four
separate steps: sample preparation, GC×GC−time-of-flight
mass spectrometry (TOFMS) analysis, data preprocessing, and
statistical data analysis, based on methodology previously
applied by Christensen et al.16 and a continuation of coal tar
research by McGregor et al.14
2.1. Samples and Standards. Twenty-three coal tar
samples (labeled 1−23) were obtained from 15 different
FMGP sites (labeled S1−S15) across the United Kingdom. All
samples were obtained as free phase coal tar DNAPLs which
were sealed and stored at 4 °C prior to analysis. The gas
manufacturing processes used at each site are summarized in
Table 1. At sites where multiple samples were obtained (sites
S1, S9, S12, and S14), different sampling locations were used;
further details of these can be found in the Supporting
Information. At sites where a single sample was obtained, the
tar generally represents the sole area of DNAPL discovered at
that site, e.g., from within a former tar tank during excavation.
The closure of the last coal gasworks in Britain occurred in
1981;17 thus, all tar samples have been exposed to environmental processes for at least 30 years (excluding fresh tar
samples 18 and 19 obtained from a present-day steelworks).
All solvents were of analytical grade, purchased from Fisher
Scientific (Loughborough, U.K.). All deuterated PAHs were
obtained from Isotec, Sigma-Aldrich (Gillingham, U.K.).
2.2. Sample Preparation. Extraction was performed using
an ASE 350 accelerated solvent extraction system (Dionex,
Camberley, U.K.) equipped with 10 mL stainless steel
extraction cells, using hexane as the extraction solvent. Sample
extraction and cleanup were performed simultaneously by the
addition of a layer of silica gel to each extraction cell. The
extraction procedure has been previously described in detail.14
Four deuterated surrogates (d8-naphthalene, d10-fluorene,
d10-fluoranthene, and d12-chrysene) were used to monitor the
extraction efficiency. The extraction efficiency was within the
U.S. Environmental Protection Agency (USEPA) recommen3745
dx.doi.org/10.1021/es203708w | Environ. Sci. Technol. 2012, 46, 3744−3752
�Environmental Science & Technology
Article
ded limits of 70−120%.18 All coal tars were extracted in
duplicate, spiked with an internal standard (150 μg/mL d10phenanthrene), and analyzed by GC×GC−TOFMS.
2.3. GC×GC−TOFMS Analyses. All GC×GC−TOFMS
analyses were performed using a Leco (St. Joseph, MI) time-offlight mass spectrometer, model Pegasus 4D, connected to an
Agilent 7890A gas chromatograph equipped with a Leco
thermal modulator. The TOF ion source was fixed at 200 °C,
and masses between 45 and 500 u were scanned at a 200
spectra/s rate. The detector voltage was set at 1700 V with an
applied electron ionization voltage of 70 eV.
All standards and extracts were analyzed with the primary
oven temperature programmed at 10 °C/min from 55 °C (2
min isotherm) to 110 °C, 3 °C/min to 210 °C, and then 8 °C/
min to 310 °C (15 min isotherm). The secondary oven and
modulator temperatures were maintained at a 20 °C offset
relative to the primary oven. The modulation period was 6 s
with a 1.3 s hot pulse time. Helium was used as the carrier gas,
with a flow rate of 1.0 mL/min. An MPS2 twister autosampler
(Gerstel, GmbH & Co., Germany) was used to inject 1 μL of
sample per run at a split ratio of 1:50 and injection port
temperature of 250 °C.
The column set comprised of a TR-50 MS supplied by
Thermo Scientific (30 m × 0.25 mm i.d. × 0.25 μm film
thickness) as the primary column and an Rtx-5 (1.2 m × 0.18
mm i.d. × 0.2 μm film thickness) supplied by Thames Restek
(Buckinghamshire, U.K.) as the secondary column, connected
via a Thames Restek Press-tight connector.
2.4. Data Collection and Preprocessing. The chromatograms for each sample were processed using Leco ChromaTOF
software (version 4.22) to search, identify, and align peaks with
signal-to-noise values greater than 10; peaks with similar
retention times and mass spectra were selected. Initially, the 16
EPA PAHs and their alkyl homologues were selected (due to
their high concentration in coal tars), and the data set was
expanded by adding peaks which presented heightened
intensity within at least one of the coal tar samples and thus
were likely to aid source differentiation. For example, it was
discovered that n-alkanes were prevalent in CWG tars and were
therefore included in the data set. Chemical classes, such as
phenols, which had been previously shown in the literature to
vary in concentration between different tar types were also
included.9 Furthermore, highly positive or negative loadings
found during principal component analysis of the full
chromatographic data set of 3479 peaks were also included
(see the Supporting Information for score and loading plots).
In total, 156 peaks were ultimately selected, and the peak areas
were collated in an Excel (version 11.8) spreadsheet ready for
preprocessing. The number of peaks included for each
statistical data set is summarized by chemical class in Table 2.
A complete list of selected compounds can be found in Table
S1 of the Supporting Information.
The peak area response for each target analyte was
normalized against the internal standard (d10-phenanthrene)
to account for any instrumental variability, before calculation of
the average peak areas of duplicate extracts. A number of data
transformations were then performed to evaluate their effect on
source identification of coal tars, including application of square
root, fourth root, eighth root, logarithm, and reciprocal
transformations. Univariate statistical analyses were performed
using Minitab version 16 (Minitab Ltd., Coventry, U.K.).
2.5. Multivariate Statistical Analysis. Hierarchical cluster
analysis (HCA) is a statistical method of classifying samples
Table 2. Number of Compounds from Each Chemical Class
(and Class Labeling System) Used within Various Statistical
Methods
no. of peaks used for each statistical
method
class
no.a
i
ii
iii
iv
v
vi
vii
viii
ix
x
xi
xii
chemical class
n-alkanes
isoalkanes
alkylbenzenes
phenols
hydronaphthalenes
naphthalenes
parent PAHs (≥3
rings)
alkyl-PAHs (≥3 rings)
N-PAHs
O-PAHs
parent S-PAHs
alkyl-S-PAHs
total
HCA heat map
1b
HCA heat
map 2b
PCAb
18
5
11
7
3
22
24
15
5
11
7
3
5
24
18
5
11
7
3
22
24
22
1
5
5
34
156
8
1
5
5
10
99
22
1
5
5
34
156
a
Corresponds to chemical class numbering within Figures 3 and 4. bAs
illustrated by Figures 3−5, respectively.
into clusters within a dendrogram by using a similarity criterion
and a clustering rule. The similarity criterion is a measure of the
distance between samples; for the purpose of this study the
Euclidean distance was used. A number of different clustering
rules are available that describe the way in which samples are
linked in the dendrogram; single, average, and complete linkage
methods were all evaluated in this study to allow the method
with optimal clustering to be selected.
The use of two-dimensional HCA to form a heat map (or
clustergram) was also investigated. In this technique HCA is
performed twice, on the observations (samples) within the data
set as well as on the variables (chromatographic peak areas).
The results are represented by a heat map, two dendrograms
linked by a color-shaded mosaic representing the intensity of
each variable within each sample.
Principal component analysis (PCA) is another standard
technique for reducing data dimensionality and visualizing
trends within a data set. In this method, large data sets can be
converted into a small number of principal components (PCs),
which are weighted sums of the original variables. The PCs
describe the variation within a data set. Generally, 2−3 PCs are
sufficient to describe the variability between samples, allowing
the data to be viewed as a simple two- or three-dimensional
plot of PCA scores. The variance explained by each PC is given
in terms of a percentage of the total variance; a large percentage
(70−100%) of the variance should be explained by the first 2−
3 PCs. HCA, PCA, and two-dimensional HCA were all
performed using the Statistical Toolbox in Matlab (R2011a,
version 7.12, Mathworks Inc.).
3. RESULTS AND DISCUSSION
3.1. Chromatographic Analysis. GC×GC chromatograms were compared by pattern recognition and grouped by
general sample relationships. A number of samples were very
similar in nature. For example, a comparison of two similar tars
(samples 13 and 14) is shown in Figure 1a,b. The same
components were present in each sample (with PAHs
comprising the greatest portion) but in varying concentrations.
3746
dx.doi.org/10.1021/es203708w | Environ. Sci. Technol. 2012, 46, 3744−3752
�Environmental Science & Technology
Article
Figure 1. Comparison of total ion current (TIC) GC×GC contour plots of (a, b) CWG tars representing samples 13 and 14, respectively, (c)
creosote oil (sample 11), and (d) a fresh coke oven tar (sample 18).
Certain samples, however, showed clear compositional
differences. Sample 11 contains a high aliphatic content
compared to most tars investigated in this study, and these
major differences can be easily seen by comparing the GC×GC
contour plot to that of a fresh coke oven tar (Figure 1c,d).
Nevertheless, with over 1000 peaks per sample identified by the
software (ChromaTOF, Leco), it is difficult to get an accurate
comparison of the results on a visual basis. Thus, a number of
statistical methods were studied to develop a robust method of
sample comparison as described in the following sections.
3.2. Univariate Statistical Analysis. Initial processing of
the chromatographic data focused on a traditional univariate
study by investigation of a variety of diagnostic ratios. Many
univariate methods have been reported in the literature for the
analysis of crude oils, including a range of PAH and biomarker
diagnostic ratios.19,20 However, there has been very little
published data on chemical fingerprinting of coal tars. Saber et
al.4 state that a plot of the fluoranthene/pyrene ratio against the
dibenzofuran/fluorene ratio has the capacity to differentiate
between major coal tar types. However, the double ratio plot
did not distinguish any major clusters between the coal tar
samples examined in this work, as shown in Figure 2a.
In this study, fluoranthene/pyrene plotted against the
acenaphthene/acenaphthylene ratio (Figure 2b) was found to
produce the best clustering of all the diagnostic ratios
investigated (which included various combinations using the
16 EPA priority pollutant PAHs and a range of heterocyclic
PAHs). However, the plot is unable to distinguish between
retort tar subtypes, as well as considerable overlap between
CWG and retort tars, and as such univariate methods are not
recommended for environmental forensic interpretation of coal
tar DNAPLs. A multivariate approach is therefore deemed
necessary for full environmental forensic differentiation of tar
types.
3.3. Hierarchical Cluster Analysis. Preliminary trials
involving HCA showed that optimal clustering could be
achieved using a normalized eighth root data set with Euclidean
distance and complete linkage.
A two-dimensional HCA heat map was prepared for the full
data set of 23 coal tars and is given in Figure 3. Four main
sample clusters were identified, and the approximate groupings
by manufacturing process are highlighted (based on the site
classes listed in Table 1). The CWG tars and creosote cluster
together; however, the coke oven and retort tars do not fully
separate and are spread out among the remaining three clusters.
The second dendrogram associated with clustering of the
variables (in rows) can provide extra information at a glance on
the way in which the sample clusters have been formed. The
shading of the heat map mosaic indicates the differences
between variables within each cluster. The chemical classes in
Table 2 are identified within the heat map by numbering next
to the variable clusters. In an attempt to improve the
classification power of the heat map, the variables with poor
differentiation samples were removed. In general, alkylsubstituted PAH isomers showed similar responses in the
heat map and were deemed unnecessary for differentiation of
3747
dx.doi.org/10.1021/es203708w | Environ. Sci. Technol. 2012, 46, 3744−3752
�Environmental Science & Technology
Article
Figure 2. Diagnostic ratio plot of (a) fluoranthene/pyrene (FLT/PYR) against (b) acenaphthylene/acenaphthene (ACY/ACE). Labeling
corresponds to site classes given in Table 1, where VR = vertical retort, HR = horizontal retort, LTHR = low-temperature horiziontal retort, CO =
coke oven, CR = creosote, and CWG = carbureted water gas.
the tar sources. The reduced data set is indicated in Table S1 of
the Supporting Information. In total, 57 data points were
removed, and the HCA evaluation was repeated; the resulting
heat map is given in Figure 4. The removal of unnecessary data
points resulted in improved clustering for both samples and
variables.
Four main sample clusters were once again identified in
Figure 4 and labeled according to the site class labels given in
Table 1. The CWG/creosote tars are again grouped within a
single cluster; while the coke oven and vertical and horizontal
retort tars can now all be separated. However, samples 21 and
22, the low-temperature horizontal retort tars, were still
misclassified with the vertical retort tars. These rare samples
were obtained from an FMGP which closed in 1870, meaning
they were released into the environment over 140 years ago. It
is possible that environmental degradation processes have
altered the coal tar signature and interfered with source
identification.
Sample 20 also exhibited unexpected clustering. The vertical
retort tar was located within the main retort cluster; however, it
is represented by a single branch rather than as part of the
vertical retort group. The heat map mosaic of the reduced data
set now shows defined sections resulting in the process-specific
clusters, allowing easy interpretation of the results. By
examination of the shading intensity, the main differences in
coal tar composition can be found.
The main chemical classes within each cluster are again
labeled corresponding to the numbering system for chemical
classes shown in Table 2. Sample 20 and, to a lesser extent,
sample 15 have a high content of C27−C33 alkanes compared
to the other retort tars. This deviation in alkane content is
sufficient to cause sample 20 to branch outside of the vertical
retort cluster. It is possible that these samples have resulted
from multiple contamination sources (such as mixing with an
aliphatic-rich petrogenic source) or may simply have been
exposed to less degradation than the other retort tars studied.
The main distinction between coke oven tars and other
samples is the high parent PAH content (Figure 4). The higher
proportion of parent PAHs present within the coke oven tars is
indicated by the highly positive (dark red) shading for that
cluster in the heat map mosaic. The coke oven samples (18 and
19) were obtained fresh from a present-day coke oven; thus,
high levels of parent PAHs were anticipated. Parent PAHs
degrade faster than their alkylated homologues; therefore,
weathered pyrogenic samples generally have a characteristic
3748
dx.doi.org/10.1021/es203708w | Environ. Sci. Technol. 2012, 46, 3744−3752
�Environmental Science & Technology
Article
Figure 3. Heat map of the coal tar data set of 156 peaks. The red-blue color gradient represents values of highest to lowest intensity (abbreviations
correspond to the site classes identified in Table 1, while numbering corresponds to chemical classes shown in Table 2).
Figure 4. Heat map of a reduced coal tar data set (using 99 peak areas). The red-blue color gradient represents values of highest to lowest intensity
(abbreviations correspond to the site classes identified in Table 1, while numbering corresponds to chemical classes shown in Table 2).
PAH pattern of C0 < C1 < C2 < C3, while parent PAHs are
dominant in fresh, pyrogenic samples.21
The heat map also depicts the main variation between
horizontal and vertical retort tars. Unlike the initial heat map
(Figure 3), the two retort types are now clearly separated into
two main clusters, with the exception of low-temperature retort
samples 21 and 22. This is due to significant differences in the
production of phenol/alkylphenol compounds between the two
major retort types (Figure 4), and as such, cluster analysis
separates horizontal retorts (which generally have a high
content of phenols) from vertical retorts (which have little or
no phenols present). This variation is likely a result of the
length of time in which hot gases evolving in the retort are kept
in contact with the hot retort walls. In horizontal retorts, the
gaseous compounds have a greater opportunity for further
degradation and higher degree of oxygen and water vapor
availability, thus explaining the presence of phenols.
The CWG tars exhibit a far greater concentration of low
molecular weight alkanes, alkylated benzenes, and sulfurcontaining heterocycles than other tars. As previously
mentioned, during the CWG process a spray of oil is
introduced to enrich the gas by thermal cracking. The addition
of oil could easily account for the high levels of low molecular
weight aliphatics and aromatics in tar samples originating from
CWG plants, as they are abundant within petroleum products.
Furthermore, the enhanced levels of sulfur-containing hetero3749
dx.doi.org/10.1021/es203708w | Environ. Sci. Technol. 2012, 46, 3744−3752
�Environmental Science & Technology
Article
Figure 5. PCA score plot of the full coal tar data set including blind study samples. Labeling corresponds to the site classes indicated in Table 1.
The additional cluster of LTHRs comprises samples 9, 16,
21, and 22. On the basis of historical data of site processes, it
was anticipated that tar samples 6, 21, and 22 were produced by
low-temperature horizontal retorts; however, sample 9 was
expected to have been formed by later vertical retorts or CWG
processes on site. This alone indicates how powerful the
technique can be for source identification of DNAPL plumes.
The creosote oil sample is interestingly grouped within the
CWG cluster, as with both HCA heat maps. There are two
possible explanations for this: (a) the tar used to produce the
creosote oil via distillation was produced by a CWG plant or
(b) the high aliphatic content of the medium distillate creosote
oil is simply most similar to that of CWG tar and is thus
grouped accordingly. On the other hand, the creosote tar is
clustered most closely to sample 12, a tar acquired from a
complex FMGP where on-site distillation of tar was most likely
performed. Nevertheless, the abundance of higher molecular
weight PAHs in sample 12 suggests it is not a distilled tar. The
inclusion of a greater number of creosote samples in the score
plot is required to determine which analytes uniquely define
this DNAPL.
The basic site details for all coal tar samples are summarized
in Table 1, where it can be seen that samples 1−6 were
obtained from the same FMGP. The samples cluster closely in
the PCA plot, despite small differences in the GC×GC
chromatograms thought to be due to weathering. This shows
that the model employs an accurate source fingerprint. Samples
14 and 17 were also obtained from different sampling locations
within a single site, and as Figure 5 illustrates, this has a
significant effect on the PCA score plot. Sample 14 clusters
with the CWG tars, while sample 17 is clearly grouped with the
horizontal retort tars. Historical site data show that the
sampling site of sample 14 was located near a CWG structure,
whereas the location of sample 17 was close to the horizontal
retort house. This demonstrates that GC×GC analysis coupled
with PCA has the capability to differentiate between tar
signatures, not only from different sites, but within a single site
also. The technique has the potential to allocate tar plumes to a
specific time period when the identified process was in
operation. The high degree of contamination present at most
FMGP sites results in such sites being blamed immediately for
cyclic PAHs, such as benzothiophenes and dibenzothiophenes,
may also be explained by the addition of oil. Heavy oil or lighter
petroleum products could be used in the CWG process and
were generally chosen on the basis of availability and cost;
therefore, the sulfur content may be a useful way of
distinguishing different CWG sources. On the other hand,
low-quality, inexpensive coals (with higher sulfur contents) may
have been used to form the coke used within CWG systems.
3.4. Principal Component Analysis. PCA score plots
were prepared for the chromatographic data set (as shown in
Table S1 of the Supporting Information) using a variety of
preprocessing transformations. The normalized, fourth root
data set was found to produce the greatest differentiation
between tar types, with the first two PCs describing 82% of the
total variance (Figure 5). It is hypothesized that, without
preprocessing transformations, the large range of peak
intensities within the data set results in small peaks contributing
less toward the principal components, regardless of their
chemical importance. This was evident in PCA score plots
using normalized only data and normalized square root data;
thus, higher root transformations were performed. Moreover,
the samples have been in the environment for decades, if not
centuries in some cases (as indicated by the FMGP dates of
operation in Table 1); therefore, environmental processes may
have changed the contaminant ratios due to evaporation or
dilution into groundwater. Taking the fourth root of the data
allows the focus to be on the presence/absence of contaminants
rather than their concentrations and as such relates to the
primary production method instead of changes which may have
occurred due to environmental factors.
Two data sets were analyzed by PCA, an initial data set of 21
coal tars (samples 1−19 and 21−22) to establish source
identifications and a blind study data set including a further two
“unknown” samples (labeled 20 and 23) to validate the PCA
model. PCA allowed separation of the coal tars into five groups
according to historical manufacturing processes, as shown in
Figure 5 (labeling corresponds to site classes identified by
Table 1). The retort tars are now well separated from the CWG
tars and further split into three subtypes; vertical (VR),
horizontal (HR), and low-temperature horizontal (LTHR)
retorts.
3750
dx.doi.org/10.1021/es203708w | Environ. Sci. Technol. 2012, 46, 3744−3752
�Environmental Science & Technology
Article
separation of two tar types (samples 14 and 17) from the same
FMGP site.
Multivariate statistical analysis should be used for effective
environmental forensic source identification of coal tar, as
univariate methods were shown to be inadequate as an
environmental forensic statistical approach. Multivariate
methods, such as PCA, were shown to have a higher
discriminatory power for the classification of coal tars collected
from the environment (when a normalized, fourth root
preprocessing transformation was employed), with blind
study samples correctly identified according to the manufacturing process by which they were formed.
any PAH contamination found in the vicinity. The level of
knowledge on coal tar composition obtainable by GC×GC with
PCA has the potential to easily settle any debates over liability
at FMGP sites and the surrounding area.
The separation of retort tars and coke oven tars appears to be
described most by PC2. The loadings were investigated,
showing that the phenols and toluene (positive loadings) and
high molecular weight alkanes (C24−C29; negative loadings)
were the most relevant variables for PC2 and were thus the
peak areas with most variation between the retort tar subtypes
and the coke oven tars. PC1 was mainly defined by
acenaphthene, alkylbenzenes, biphenyls, numerous sulfur
heterocycles, and C1-methylnaphthalenes (all positive loadings) and C30−C33 alkanes (negative loadings) and explained
the distinction between CWG/creosote tars and the other tar
types. These observations were consistent with the composition
of the samples; for example, CWG scores fell in the positive
areas of PC1, and such tars exhibited a noticeably high
methylnaphthalene and acenaphthene content when compared
to the other tar types. Loading plots are provided in the
Supporting Information.
With the initial PCA model established, the blind study
samples were analyzed and added to the data set for a new PCA
model to be developed. The blind study samples are
highlighted by the arrows in the PCA score plot shown in
Figure 5. The site details for blind study samples 20 and 23
were not disclosed by Parsons Brinkerhoff, who provided the
samples, until the PCA model had been created and evaluated.
The unknown samples were both classified by the PCA as
vertical retort tars, the correct source identification for both
samples.
The PCA model allows source identification of all five tar
types investigated in this study, with the potential for sitespecific differences within each cluster to be identified. The
model could prove invaluable for source allocation of FMGP
wastes, by identifying the specific process(es) used to produce
tar plumes across a site and thus the operator(s) responsible for
the contamination.
Expansion of the data set of MGP coal tars in the
environment will allow further validation of the groupings
and could potentially allow additional industrial processes to be
classified. For example, tars produced by a number of additional
MGP processes (such as producer gas and Mond gas plants)
could provide further clusters in the score plots. Additionally, it
was not uncommon for wood or heavy oil to be used as the
primary fuel source at FMGPs in certain parts of the world
when the coal supply was limited. Therefore, PCA score plots
of a range of global FMGP tar samples could potentially
indicate differences in the raw materials used in gas production.
The results of this study have shown that coal tar samples can
be classified according to the processes by which they were
formed over 100 years ago. The enhanced analytical power of
GC×GC−TOFMS allows additional chemical information to
be gained per sample compared to conventional GC
techniques, allowing for more robust source identification.
Traditional GC analyses coupled with statistical methods may
overlook the compositional data vital for robust source
identification (see Figure S6 in the Supporting Information
for further details). The combination of the powerful
GC×GC−TOFMS technique and the evaluation of historical
site data allows for source identification of multiple tar samples
in a simple and timely manner, as illustrated by the clear
■
ASSOCIATED CONTENT
S Supporting Information
*
Additional site information, table giving the data set used for
statistical classification of coal tars, and figures showing PCA
score and loading plots for the full GC×GC data set of 3479
peaks, a Scree plot of the percent variability explained by each
PC, a PCA score plot using PC1 and PC3 for GC×GC data
(156 peaks), a PCA loading plot for PC1 and PC2 for GC×GC
data (156 peaks), and a PCA score plot using only 16 U.S. EPA
PAHs and alkyl PAH peaks. This material is available free of
charge via the Internet at http://pubs.acs.org.
■
AUTHOR INFORMATION
Corresponding Author
*Phone: +44 141 548 3902; fax: +44 141 553 2066; e-mail: l.a.
mcgregor@strath.ac.uk.
Notes
The authors declare no competing financial interest.
ACKNOWLEDGMENTS
We thank the Scottish Funding Council (SFC) Glasgow
Research Partnership in Engineering, the SFC-funded WestCHEM Partnership, and the Engineering and Physical Sciences
Research Council (EPSRC; Grant EP/D013739/2) for funding
support. Parsons Brinckerhoff and National Grid are also
gratefully acknowledged for providing all coal tar samples
investigated.
■
■
REFERENCES
(1) Tarr, J. A. History of Manufactured Gas; Academic Press: New
York, 2004; Vol. 4, pp 733−742.
(2) Thomas, A. O.; Lester, J. N. The reclamation of disused gasworks
sites: New solutions to an old problem. Sci. Total Environ. 1994, 152,
239−260.
(3) Birak, P. S.; Miller, C. T. Dense non-aqueous phase liquids at
former manufactured gas plants: Challenges to modeling and
remediation. J. Contam. Hydrol. 2009, 105, 81−98.
(4) Saber, D. L.; Mauro, D.; Sirivedhin, T. Applications of forensic
chemistry to environmental work. J. Ind. Microbiol. Biotechnol. 2005,
32, 665−668.
(5) Hamper, M. J. Manufactured gas history and processes. Environ.
Forensics 2006, 7, 55−64.
(6) Murphy, B. L.; Sparacio, T.; Shields, W. J. Manufactured gas
plantsProcesses, historical development, and key issues in insurance
coverage disputes. Environ. Forensics 2005, 6, 161−173.
(7) Williams, R. A Practical Treatise on the Manufacture and
Distribution of Coal Gas; E. and F. Spons: London, 1877.
(8) Lewes, V. B. The Carbonisation of Coal; John Allan and Co.:
London, 1912.
3751
dx.doi.org/10.1021/es203708w | Environ. Sci. Technol. 2012, 46, 3744−3752
�Environmental Science & Technology
Article
(9) Butler, T. H. Fractional distillation in the coal tar industry. In
Distillation Principles and Processes; Young, S., Ed.; Macmillan and Co.:
London, 1922; pp 359−366.
(10) Murphy, B. L.; Brown, J. Environmental forensics aspects of
PAHs from wood treatment with creosote compounds. Environ.
Forensics 2005, 6, 151−159.
(11) Findlay, A. The Treasures of Coal Tar; Turnbull and Spears: U.
K., 1917; pp 1−31.
(12) Young, S. Distillation Principles and Processes; MacMillan and
Co.: London, 1922.
(13) Brown, D. G.; Gupta, L.; Kim, T. H.; Moo-Young, H. K.;
Coleman, A. J. Comparative assessment of coal tars obtained from 10
former manufactured gas plant sites in the eastern United States.
Chemosphere 2006, 65, 1562−1569.
(14) McGregor, L. A.; Gauchotte-Lindsay, C.; Nic Daeid, N.;
Thomas, R.; Daly, P.; Kalin, R. M. Ultra resolution chemical
fingerprinting of dense non-aqueous phase liquids from manufactured
gas plants by reversed phase comprehensive two-dimensional gas
chromatography. J. Chromatogr., A 2011, 1218, 4755−4763.
(15) Reichenbach, S. E.; Tian, X.; Tao, Q.; Ledford, E. B. Jr.; Wu, Z.;
Fiehn, O. Informatics for cross-sample analysis with comprehensive
two-dimensional gas chromatography and high-resolution mass
spectrometry (GC×GC−HRMS). Talanta 2011, 83, 1279−1288.
(16) Christensen, J. H.; Tomasi, G. Practical aspects of chemometrics
for oil spill fingerprinting. J. Chromatogr., A 2007, 1169, 1−22.
(17) Thomas, R. Forensic Investigation of Coal Tar; Technical Report
FSE97140C; Parsons Brinckerhoff: Bristol, U.K., 2011.
(18) U.S. Environmental Protection Agency. Test methods for
evaluating solid wastes, SW-846 Method 8000B, 1997. http://www.
epa.gov/waste/hazard/testmethods/sw846/online/8_series.htm (accessed Sep. 20, 2011).
(19) Douglas, G. S.; Emsbo-Mattingly, S.; Stout, S. A.; Uhler, A. D.;
McCarthy, K. J. Chemical fingerprinting methods. In Introduction to
Environmental Forensics, 2nd ed.; Murphy, B. L., Morrison, R. D., Eds.;
Elsevier: London, 2007; pp 312−439.
(20) Wang, Z.; Fingas, M. Development of oil hydrocarbon
fingerprinting and identification techniques. Mar. Pollut. Bull. 2003,
47, 423−452.
(21) Malmquist, L. M. V.; Olsen, R. R.; Hansen, A. B.; Andersen, O.;
Christensen, J. H. Assessment of oil weathering by gas chromatography−mass spectrometry, time warping and principal component
analysis. J. Chromatogr., A 2007, 1164, 262−270.
3752
dx.doi.org/10.1021/es203708w | Environ. Sci. Technol. 2012, 46, 3744−3752
�
 Laura McGregor