558
C.H.G. Hernandez-Garcia et al. / Proceedings of the 2004 FEL Conference, 558-561
PERFORMANCE AND MODELING OF THE JLAB IR FEL UPGRADE
INJECTOR
C. Hernandez-Garcia*, K. Beard, S. Benson, G. Biallas, D. Bullard, D. Douglas, H. F. Dylla, R.
Evans, A. Grippo, J. Gubeli, K. Jordan, G. Neil, M. Shinn, T. Siggins, R. Walker, B. Yunn, S.
Zhang, TJNAF, Newport News, VA 23606, USA
Abstract
The JLab IR Upgrade Injector has delivered up to 9.1
mA of CW electron beam current at 9 MeV. The injector
is driven by a 350 kV DC Photocathode Gun. Injector
behavior and beam-based measurements are in good
agreement with PARMELA simulations. The injected
beam envelopes were established by measuring beam spot
sizes and comparing them with those predicted by a
transport matrix based model. The emittances were
measured by fitting an initial trial beam matrix to the
measured data. The injected bunch length was established
by measuring the energy spread downstream of the Linac
while operating at either side of crest.
INTRODUCTION
The injector for the Jefferson Lab 10kW Upgrade IR
FEL is very similar to the 1kW IR Demo FEL [1]. The IR
Demo injector has been described elsewhere [2,3]. A
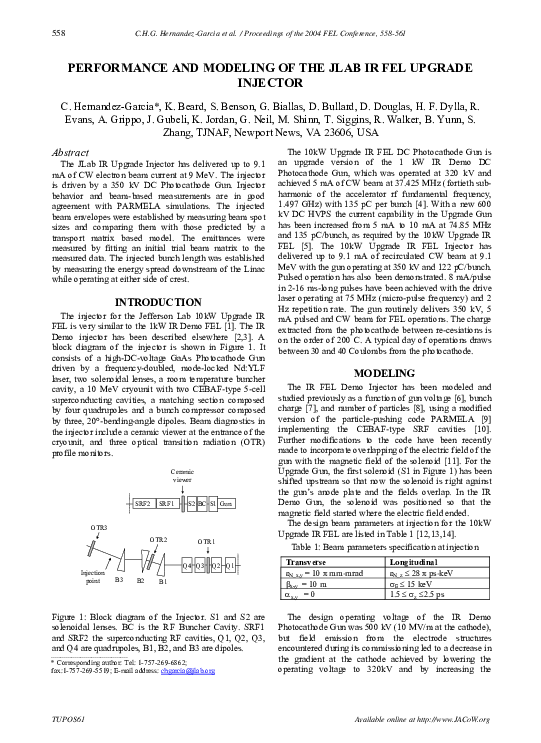
block diagram of the injector is shown in Figure 1. It
consists of a high-DC-voltage GaAs Photocathode Gun
driven by a frequency-doubled, mode-locked Nd:YLF
laser, two solenoidal lenses, a room temperature buncher
cavity, a 10 MeV cryounit with two CEBAF-type 5-cell
superconducting cavities, a matching section composed
by four quadrupoles and a bunch compressor composed
by three, 20°-bending-angle dipoles. Beam diagnostics in
the injector include a ceramic viewer at the entrance of the
cryounit, and three optical transition radiation (OTR)
profile monitors.
Ceramic
viewer
SRF2
SRF1
S2 BC S1 Gun
OTR3
OTR2
OTR1
Q4 Q3
Injection
point
B3
B2
Q2 Q1
B1
Figure 1: Block diagram of the Injector. S1 and S2 are
solenoidal lenses. BC is the RF Buncher Cavity. SRF1
and SRF2 the superconducting RF cavities, Q1, Q2, Q3,
and Q4 are quadrupoles, B1, B2, and B3 are dipoles.
__________________________________________
* Corresponding author: Tel: 1-757-269-6862;
fax:1-757-269-5519; E-mail address: chgarcia@jlab.org
TUPOS61
The 10kW Upgrade IR FEL DC Photocathode Gun is
an upgrade version of the 1 kW IR Demo DC
Photocathode Gun, which was operated at 320 kV and
achieved 5 mA of CW beam at 37.425 MHz (fortieth subharmonic of the accelerator rf fundamental frequency,
1.497 GHz) with 135 pC per bunch [4]. With a new 600
kV DC HVPS the current capability in the Upgrade Gun
has been increased from 5 mA to 10 mA at 74.85 MHz
and 135 pC/bunch, as required by the 10kW Upgrade IR
FEL [5]. The 10kW Upgrade IR FEL Injector has
delivered up to 9.1 mA of recirculated CW beam at 9.1
MeV with the gun operating at 350 kV and 122 pC/bunch.
Pulsed operation has also been demonstrated. 8 mA/pulse
in 2-16 ms-long pulses have been achieved with the drive
laser operating at 75 MHz (micro-pulse frequency) and 2
Hz repetition rate. The gun routinely delivers 350 kV, 5
mA pulsed and CW beam for FEL operations. The charge
extracted from the photocathode between re-cesiations is
on the order of 200 C. A typical day of operations draws
between 30 and 40 Coulombs from the photocathode.
MODELING
The IR FEL Demo Injector has been modeled and
studied previously as a function of gun voltage [6], bunch
charge [7], and number of particles [8], using a modified
version of the particle-pushing code PARMELA [9]
implementing the CEBAF-type SRF cavities [10].
Further modifications to the code have been recently
made to incorporate overlapping of the electric field of the
gun with the magnetic field of the solenoid [11]. For the
Upgrade Gun, the first solenoid (S1 in Figure 1) has been
shifted upstream so that now the solenoid is right against
the gun’s anode plate and the fields overlap. In the IR
Demo Gun, the solenoid was positioned so that the
magnetic field started where the electric field ended.
The design beam parameters at injection for the 10kW
Upgrade IR FEL are listed in Table 1 [12,13,14].
Table 1: Beam parameters specification at injection
Transverse
εN_x,y = 10 π mm-mrad
βx,y = 10 m
αx,y = 0
Longitudinal
εN_z ≤ 28 π ps-keV
σE ≤ 15 keV
1.5 ≤ σz ≤2.5 ps
The design operating voltage of the IR Demo
Photocathode Gun was 500 kV (10 MV/m at the cathode),
but field emission from the electrode structures
encountered during its commissioning led to a decrease in
the gradient at the cathode achieved by lowering the
operating voltage to 320kV and by increasing the
Available online at http://www.JACoW.org
�559
C.H.G. Hernandez-Garcia et al. / Proceedings of the 2004 FEL Conference, 558-561
Injector setup
The Injector modeling starts at the photocathode.
Transversely, the distribution is a Gaussian truncated at
2σr, with σr=2 mm. Longitudinally the distribution is
Gaussian as well with σt =23 ps and truncated at 3σt. The
first solenoidal lens (S1 in Figure 1) strength is adjusted
to focus the highly divergent electron beam following the
3σx,y=beampipe-radius criterion. The buncher (BC) is a
1.497 GHz copper cavity operated at zero-crossing phase.
Its gradient is set to minimize the longitudinal emittance
at injection by finding the minimum energy spread at
OTR2 (see Figure 1). A second solenoidal lens (S2)
matches the beam transversely into the cryounit.
The cryounit accelerates the 350 keV beam to 9.1 MeV.
Ideally, the solenoid (S2) strength is adjusted to position
the beam waist at the middle of the first cell of the
upstream (SRF1) cavity. However, this is not possible for
this particular geometry due to transverse space charge
effects, so the solenoid strength is set to position the beam
waist as close as possible to the entrance of the SRF1
cavity. The upstream cavity (SRF1) is operated on crest,
while the downstream (SRF2) cavity is operated at 20°
ahead of crest for proper longitudinal beam match to the
achromatic compression chicane (B1, B2, and B3).
Downstream of the cryounit, four quadrupoles (Q1, Q2,
Q3, and Q4) transversely match the beam to the injection
point, located 1.0 m upstream of the first accelerator
cryomodule (see Figure 1).
There are only two parameters that can be set in the
injector and be stated as accurate, the gun voltage and the
drive laser pulse length. All the rest have to be set and
verified using beam-based measurements in concert with
modeling results.
Code calibration
Dependencies of downstream beam parameters on a
given parameter can be used to calibrate just about all the
parameters. Beam-based measurements have been used to
calibrate almost all of the injector parameters.
To calibrate S1, the field that produced a waist at the
ceramic viewer (see Figure 1) was found by running
PARMELA with the space charge option turned off. Then
the same procedure was followed in the actual injector
and the two field setpoints compared. It was found that
the actual solenoid field is 2.24% larger than that
predicted by the model.
It is difficult to calibrate the gradient value for the SRF
cavities in the model against the actual setpoints, since
even in EPICS there is an uncertainty of about 10%.
However, the gradient ratio SRF1/SRF2 was measured by
operating both cavities on crest [16]. The model was then
adjusted to match the measured ratio.
There is a big discrepancy in the buncher gradient
between model and the actual value reported in EPICS.
The buncher setting for smallest energy spread at OTR2
corresponds in PARMELA to 0.41 MV/m, while for the
actual injector is 2.5 MV/m. Therefore, the buncher
gradient is set in both, model and machine, to produce the
smallest energy spread at OTR2. Variations from this
setpoint in the machine are translated to the model by
taking the percentile increase or decrease. A careful
measurement of the actual buncher gradient will be
conducted later.
INJECTOR PERFORMANCE AND
MODEL PREDICTIONS
Continuous feedback between PARMELA modeling
and machine behavior observations proved to be an
important tool during the FEL commissioning.
Longitudinal dynamics
The longitudinal match is achieved with the buncher
cavity (BC), the downstream cryounit cavity (SRF2), and
the downstream solenoid (S2). The buncher gradient is
adjusted to minimize the energy spread at injection. The
injected bunch length is adjusted with the off-crest phase
on the downstream cryounit cavity (the injected bunch
length is also controlled with the buncher gradient, but the
energy spread grows if the buncher is not at the optimum
for smallest energy spread). The downstream solenoid
controls the longitudinal space charge force at the
entrance of the cryounit by adjusting the beam spot size.
Figure 2 shows the normalized longitudinal emittance
from the cathode to the injection point.
35.00
30.00
εNz (π-ps-keV)
cathode-anode gap (6 MV/m at 500 kV [15]). Simulations
showed that operating the gun at lower gradient would
still keep the transverse emittance within specifications
[6], as measurements later proved [4].
Buncher
25.00
20.00
Compression
chicane
15.00
Cryounit
10.00
Injection
5.00
0.00
0
200
400
600
800
1000
1200
z (cm)
Figure 2: Normalized longitudinal emittance as a function
of distance from the cathode to the injection point.
The IR Upgrade design requires an injector setup with
the smallest injector energy spread. The energy spread is
set using the buncher gradient, which in turn determines
the injected bunch length. According to PARMELA, such
a setup provides the smallest longitudinal emittance at
injection (buncher gradient at 2.5 MV/m). Although the
FEL lased with those settings (with the linac operating at
15° off crest), it lased better with a lower buncher gradient
(2.0 MV/m) that minimized the injected bunch length.
FEL Technology
�560
C.H.G. Hernandez-Garcia et al. / Proceedings of the 2004 FEL Conference, 558-561
Furthermore, the maximum Happek signal was not
produced for the design buncher gradient. The optimum
was a compromise between producing a small injected
energy spread and a long injected bunch.
PARMELA predicts that this configuration occurs for a
buncher setting 20% lower than the one that minimized
the energy spread at injection. In fact this is what was
observed. Measurements of the full-energy momentum
spread after acceleration can be back propagated to
evaluate the bunch length at injection [17]. A comparison
of longitudinal phase space parameters predicted by
PARMELA and those inferred via back-propagation is
shown in Table 2.
Table 2: Model predictions at injection for two buncher
settings compared to measurements inferred via backpropagation of energy spread measured at 80 MeV to
injected energy of 9.2 MeV.
PARMELA
Inferred via
back-propagation
Buncher at 2.5
MV/m
σz =1.85 ps
σE =13.2 keV
εz =22.4 ps-keV
σz =1.65 ps
Buncher at 2.0
MV/m
σz =0.74 ps
σE =50 keV
εz=36.5 ps-keV
σz =0.55 ps
Note that the longitudinal emittance is much larger for
the lower buncher gradient setup. The predicted
longitudinal distributions at injection for the buncher
gradient settings listed in Table 2 are shown in Figure 2.
The energy distribution becomes the temporal distribution
at the FEL and the phase distribution becomes the energy
distribution. Note the large energy spread seen on the
PARMELA distribution for the lower buncher gradient.
This may be one of the causes for the lower FEL gain at
the lower buncher setting [18].
(a)
(b)
Figure 2: PARMELA longitudinal phase space at
injection for: a) Buncher gradient (2.5 MV/m) optimized
for smallest energy spread, and b) buncher gradient (2.0
MV/m) optimized for shortest bunch length.
For the lower buncher setting, the injected energy
spread is too large and the bunch is too short. Although
the injector setting with the buncher gradient that
minimized the energy spread provided the design phase
space at injection -a long bunch with small energy spread,
it was not the best setup for lasing.
TUPOS61
While modeling in search for an alternative injector
setting, an asymmetry in the energy spread vs. linac phase
and its apparent relation to bunch length were observed
during the FEL commissioning. To confirm those
observations, the PARMELA model was extended
through the first accelerator module. The simulations
confirmed the observations, indicating that the
longitudinal space charge will induce what appears to be a
phase-dependent asymmetry in the beam momentum
spread during and after acceleration [19].
To alleviate the longitudinal space charge problem, a
new injector setup was modeled to produce a longer
bunch while maintaining a small energy spread. This is
achieved by running the cryounit downstream cavity
(SRF2) closer to crest, at 10° ahead of crest instead of the
design value (20° ahead of crest). PARMELA predicts for
this configuration (with the buncher gradient optimized
for minimum injected energy spread) σz=2.4 ps, σE=10
keV, and εz =19.5 ps-keV. When the new injector
configuration was implemented the injected rms bunch
length inferred via back-propagation was 2.3 ps, in
excellent agreement with PARMELA. Laser gain with
this configuration was about as strong as the previous
configuration but the peak efficiency in the detuning
curve was much higher (1.25%).
Transverse Dynamics
To meet the design transverse beam envelopes at
injection (see Table 1), the quadrupoles (see Figure 1) are
adjusted in the model. Once a solution is found, the
quadrupoles in the injector are set to the value specified
by PARMELA. Then the beam transverse spot size is
measured at each OTR monitor and compared to values
predicted by PARMELA. The quadrupoles have not been
calibrated yet against the model, but it was found that
beam spots in all three OTR monitors agree with those
predicted by PARMELA within 10% if the field for each
quadrupole is shifted by –10 Gauss with respect to the
PARMELA setpoint.
However, there is a discrepancy between the injected
beam envelopes predicted by PARMELA and those
established in the injector. The injected beam envelopes
were established by measuring beam spot sizes after
acceleration and comparing them with those predicted by
a transport matrix based model. The transverse beam
emittance, however agrees well with the model and it is
within design specifications. The transverse emittances
were measured by fitting an initial trial beam matrix to the
measured data. Table 3 shows PARMELA and measured
transverse beam parameters at injection with the buncher
gradient set for minimum injected energy spread.
�C.H.G. Hernandez-Garcia et al. / Proceedings of the 2004 FEL Conference, 558-561
Table 3: Transverse beam parameters at injection with
SRF2 cavity operating at –10 degrees off crest, buncher
gradient at 2.6 MV/m, Q1=-30.5, Q2=-5, Q3=240,Q4=248 Gauss.
PARMELA
εN_x/εN_x π mm-mrad
βx/βy m
αx/αy
11.2 / 7.6
14.1 / 8.4
-3.7 / 0.3
Established at
injection
10.0 / 10.0
10.7 / 6.1
-0.3 / 0.4
CONCLUSIONS
The 10 kW Upgrade IR FEL Injector has demonstrated
operation at 9.1 mA CW, 9.2 MeV and 122 pC/bunch.
Routinely the injector delivers 5 mA pulsed and CW at
135 pC/bunch for FEL operations. In general there is
good agreement between PARMELA predictions and
machine behavior. The measured performance matches de
model in detail.
The operational experience gained during the injector
commissioning process and the constant feedback
between model and machine will be very valuable for
modeling and operation of future 100 mA class injectors.
ACKNOWLEDGMENTS
This work supported by The Office of Naval Research,
the Joint Technology Office, NAVSEA PMS-405, the Air
Force Research Laboratory, U.S. Army Night Vision Lab,
the Commonwealth of Virginia, and by DOE Contract
DE- AC05-84ER40150.
561
11 K. B. Beard, B. C. Yunn, and C. Hernandez-Garcia,
“FEL Injector Simulation”, JLAB-TN-03-28, October
2003.
12 D. Douglas, “IR Upgrade Driver Design, Rev 1.1.2”,
JLAB-TN-01-051, October 26, 2001.
13 D. Douglas, “Longitudinal Phase Space Management
in the IR Upgrade FEL Driver”, JLAB-TN-00-020,
September 2000.
14 B. C. Yunn, private communication.
15 D. Engwall et al., “A high-dc-voltage GaAs
photoemission gun: transverse emittance and
momentum spread measurements” PAC’99, pp.
2693-5, Vancouver, May 1997.
16 S. Benson, FEL electronic logbook, entry#1193708,
Feb 2, 2004.
17 D. X. Wang, et al., “Measurement of femtosecond
electron buncher using rf zero-phasing method”, PR
E, 57, 2, 1998.
18 C. Hernandez-Garcia, S. Benson, and D. Douglas,
“Qualitative behavior of the 10 kW IR Upgrade FEL
Injector vs. PARMELA modeling”, JLAB-TN-03040, October 2003.
19 C. Hernandez-Garcia, et al., “Longitudinal Space
Charge effects in the JLAB IR FEL SRF Linac”,
these proceedings.
REFERENCES
1 S. Benson, et al., “First lasing of the Jefferson Lab IR
Demo FEL”, Nucl. Inst. Meth. A 429 (1999) 27-32.
2 P. Piot, et al., “Experimental results from an injector for
an IR FEL”, EPAC’98, pp. 1447-49, Stockholm,
Sweden, June 1998.
3 B. C. Yunn, “Physics of the JLab FEL injector”,
PAC’99, pp. 2453-5, New York, April 1999.
4 T. Siggins et al., “Performance of a GaAs DC
photocathode gun for the Jefferson Lab FEL”, Nucl.
Inst. Meth. A 475 (2001) 549-553.
5 D. Douglas et al., “A 10kW IR FEL Design for
Jefferson Lab”, PAC2001, pp. 249-52,Chicago, June
2001.
6 B. C. Yunn, “Alternative FEL Injector Setup”, JLABTN-99-010, April 21, 1999.
7 B. C. Yunn, “High Brightness Injectors Based on
Photocathode DC Gun”, PAC2001, pp. 2254-6,
Chicago, June 2001.
8 H. Liu, and B. C. Yunn, “A new nominal setting for the
FEL injector”, TJNAF TN#96-071, December 9,
1996.
9 K. Crandall and L. Young, Los Alamos National
Laboratory.
10 H. Liu, et al., Nucl. Instr. And Meth., A358 475 (1995)
FEL Technology
�
 Steven Zhang