Hindawi
Geofluids
Volume 2018, Article ID 5854829, 9 pages
https://doi.org/10.1155/2018/5854829
Research Article
Origins of Chalcocite Defined by Copper Isotope Values
R. Mathur
,1 H. Falck,2 E. Belogub,3 J. Milton,2 M. Wilson,4 A. Rose,5 and W. Powell6
1
Department of Geology, Juniata College, Huntingdon, PA, USA
Northwest Territories Geological Survey, Yellowknife, NT, Canada
3
Institute of Mineralogy UB RAS, Miass, Russia
4
Carnegie Museum of Natural History, Pittsburgh, PA, USA
5
Pennsylvania State University, State College, PA, USA
6
CUNY Brooklyn College, New York City, NY, USA
2
Correspondence should be addressed to R. Mathur; mathur@juniata.edu
Received 30 August 2017; Accepted 25 December 2017; Published 28 January 2018
Academic Editor: Xing Ding
Copyright © 2018 R. Mathur et al. This is an open access article distributed under the Creative Commons Attribution License,
which permits unrestricted use, distribution, and reproduction in any medium, provided the original work is properly cited.
The origin of chalcocite is explored through a comparison of the copper isotope values of this mineral from supergene enrichment,
sedimentary copper/red bed, and high-temperature hypogene mineralization around the world. Data from the literature and the
data presented here (𝑛 = 361) reveal that chalcocite from high-temperature mineralization has the tightest cluster of values of
𝛿65 Cu = 0 ± 0.6 in comparison to sedimentary copper/red bed 𝛿65 Cu = −0.9 ± 1.0 and supergene enrichment 𝛿65 Cu = +1.9 ±
1.8. Although the errors of the means overlap, large portions of the data lie in different values, allowing for distinguishing ranges
for 𝛿65 Cu of <−1‰ for sedimentary copper/red bed, between −1 and +1 for high-temperature hypogene, and >+1 for supergene
enrichment chalcocite. The copper isotope values of sedimentary copper/red bed and supergene enrichment chalcocite are caused
by redox reactions associated with the dissolution and transport of copper, whereas the tighter range of copper isotope values for
hypogene minerals is associated with processes active with equilibrium conditions.
1. The Importance of Chalcocite
Chalcocite is an economically important mineral of copper.
Crystallographic, trace element, mineral assemblage, and
textural observations and measurements have been used to
understand the origin of this mineral [1–3]. Models regarding
the genesis of chalcocite vary substantially, with conditions
ranging from the highest temperature hydrothermal systems
to ambient temperature weathering solutions, and no single
model can be used to constrain how all of the occurrences of
this mineral formed.
To contribute to the understanding of how chalcocite
forms and what geologic processes lead to its concentration,
this study analyzes copper isotope values from the literature
and from new data presented here. The data are used to
distinguish different types of mineral deposits ultimately
related to the geological processes that lead to the generation
of this essential economically significant mineral.
2. Types of Chalcocite Considered and
Deposits Analyzed
The genesis of chalcocite can be categorized into three general
models: (1) hypogene hypothermal ores that precipitate from
hydrothermal fluids (>150∘ C), (2) red bed and stratiform
“sedimentary” ores that precipitate from fluids that circulate
through sedimentary basins at temperatures <150∘ C, and
(3) supergene enrichment ores that precipitate from low to
ambient temperature oxidative fluids in near-surface environments.
The copper isotope composition of chalcocite in these
deposits varies due to several factors. In general, the primary source of most copper deposits is a large body of
magmatic rock with an isotopic composition of approximately 𝛿65 Cu‰ = 0‰ (where 𝛿65 Cu‰ = ((65Cu/
63Cu) sample/(65Cu/63Cu) Nist 976 − 1) ∗ 1000) [4–6].
However, the relatively minor variations in the isotopic composition of Cu of the dominantly magmatic source material
�2
Geofluids
Table 1: Summary of deposits analyzed and sources of data considered.
Deposit
Butte, Montana
Canarico, Peru
Rippoldsau, Germany
Coates Lake, Canada
Coppermine, Canada
Dikulushi, DRC
Kupferschiefer, Germany
Cu, Michigan
Timna, Israel
Udokan, Russia
Bayugo, Philippines
Chuquicamata, Chile
Collahuasi, Chile
El Salvador, Chile
Inca de Oro, Chile
PCDs, Iran
Morenci, Arizona
Ray, Arizona
Silver Bell, Arizona
Spence, Chile
Type of chalcocite
Hypogene
Hypogene
Hypogene
Sedimentary Cu
Sedimentary Cu
Sedimentary Cu
Sedimentary Cu
Sedimentary Cu
Sedimentary Cu
Sedimentary Cu
Supergene
Supergene
Supergene
Supergene
Supergene
Supergene
Supergene
Supergene
Supergene
Supergene
will influence the possible values of Cu within the ore solution
and the associated chalcocite. More importantly, the initial
isotopic composition can be affected by fractionation during
leaching of Cu from the source, as well as during precipitation
of secondary chalcocite. The nature of the fractionation is
dependent upon the specific dissolution and precipitation
processes (e.g., bonding within the solid or in solution)
and the physical and chemical conditions (e.g., temperature,
redox), with redox processes leading to stronger bonding
environments for 65 Cu in oxidized products and 63 Cu in
reduced products. In addition, the extent of extraction of
copper from the source and the fraction of copper that is
reprecipitated in the ore-forming processes affect fractionation. If 100% of the Cu is extracted and precipitated, then
no evidence of fractionation will be preserved. However, if
the chemical transfer is incomplete, then the various phases
(primary mineral, solution, and secondary mineral) may
have differing isotopic compositions based on the degree of
fractionation.
Copper in chalcocite that is associated with hypogene
hydrothermal ores is derived from a magmatic hydrothermal
fluid or is extracted from country rocks at high temperatures. Moreover, extensive studies showed that hypogene
hydrothermal copper minerals such as chalcopyrite and
bornite do not display appreciable fractionation (>±1‰) [7–
11]. Similarly, chalcocite that precipitated from these hightemperature fluids is not anticipated to contain copper that
has undergone significant copper isotope fractionation. This
study includes 18 chalcocite samples from three hypogene
deposits (Table 1), including an archetypal example of hypogene chalcocite at Butte, Montana [12].
Data source
Mathur et al. 2009, Wall et al. 2011
Mathur et al. 2010
Markl et al. 2006
This document
This document
Haest et al. 2009
Asael et al. 2009
This document, Larson et al. 2003, Mathur et al. 2014
Asael et al. 2007, Asael et al. 2009, Asael et al. 2012
This document
Braxton et al. 2012
Mathur et al. 2009
Mathur et al. 2009
Mathur et al. 2009
Mathur et al. 2014
Mirenjad et al. 2010, Asadi et al. 2012
Mathur et al. 2010
Mathur et al. 2010, Larson et al. 2003
Mathur et al. 2010
Palacios et al. 2010
In contrast to hypogene chalcocite, the copper associated
with red bed and stratiform types of chalcocite is derived
from leaching of sandstones and shales at low temperatures
by residual brines. The source rocks contain Cu2+ that is
hosted within detrital mafic minerals or is absorbed onto
Fe hydroxides which are formed as products of weathering
and diagenesis. A redox shift is thought to occur during
transport of copper in these formational waters because the
initial state of copper in the weathered source material is Cu2+
but the copper is mobilized in the Cu+ state as CuCl0 , or
similar aqueous species [13, 14]. Thus, the reaction required to
mobilize copper for sedimentary deposits involves the reduction of copper, which would be expected to induce isotopic
fractionation favoring 63 Cu, assuming that copper extraction
from the source material was incomplete. Dissolved copper
remains unchanged until it encounters organic material or
other reductants within the sediment, where Cu1+ is fixed by
sulfide or by reaction with preexisting pyrite [15].
Six locations at which chalcocite occurs within “sedimentary” copper deposits (a total of 161 samples) are considered
herein (Table 1). Literature sources that reported chalcocite as
the major phase present in the copper isotope analyses were
used [16–19] along with new data from Coates Lake, Copper
Mine, Michigan, and Udokan. Data from Kupferschiefer
[20], Michigan [21, 22], and Coates Lake [23] provide classic
examples of sedimentary copper deposits along with the
prospect, Coppermine [24]. Data from each of these deposits
is compiled in Table 2.
The copper for supergene-type chalcocite is derived by
oxidative weathering of rocks or ores containing Cu sulfide
�Geofluids
3
Table 2: Copper isotope data from sedimentary copper type deposits where cc means chalcocite and some samples reported trace bn (bornite).
Sample
1
2
3
4
5
6
7
8
9
10
11
12
13
14
15
16
17
18
19
20
21
22
23
24
9098
9110
9430
NWT 743 B1/5
JP77 7X1 2122 R2 #42
JP77 36984-4 3381.5 #38
NWT JP77 74121225 #45 R8
JP77 COATES 36984-1 1638 #36
NWT 7371
NWT 7Y3 B1/11
NWT JP77 644 3379 #39
JP77 781 422 #43 R4
9097 cc
7371
#41
45 r8
43 r4
7352
7358 A
#38
NWT 7356
NWT 7361A
JP77 36984.2 2289 #37
NWT 9410
9410
NWT KQ 74-11964
CM32619
Location
Udokan, Russia
Udokan, Russia
Udokan, Russia
Udokan, Russia
Udokan, Russia
Udokan, Russia
Udokan, Russia
Udokan, Russia
Udokan, Russia
Udokan, Russia
Udokan, Russia
Udokan, Russia
Udokan, Russia
Udokan, Russia
Udokan, Russia
Udokan, Russia
Udokan, Russia
Udokan, Russia
Udokan, Russia
Udokan, Russia
Udokan, Russia
Udokan, Russia
Udokan, Russia
Udokan, Russia
Coates Lake, Canada
Coates Lake, Canada
Coates Lake, Canada
Coates Lake, Canada
Coates Lake, Canada
Coates Lake, Canada
Coates Lake, Canada
Coates Lake, Canada
Coates Lake, Canada
Coates Lake, Canada
Coates Lake, Canada
Coates Lake, Canada
Coates Lake, Canada
Coates Lake, Canada
Coates Lake, Canada
Coates Lake, Canada
Coates Lake, Canada
Coates Lake, Canada
Coates Lake, Canada
Coates Lake, Canada
Coates Lake, Canada
Coates Lake, Canada
Coates Lake, Canada
Coates Lake, Canada
Coates Lake, Canada
Coates Lake, Canada
Baltic Mine, Michigan, USA
Phase
cc
cc
cc-bn
bn-cc
bn-cc
cc-bn
cc
cc
cc
cc
cc
cc
cc
cc
cc
cc
cc
cc
cc
cc
cc
cc
cc
cc
cc
cc
cc
cc
cc
cc
cc
cc
cc
cc
cc
cc
cc
cc
cc
cc
cc
cc
cc
cc
cc
cc
cc
cc
cc
cc
cc
𝛿65 Cu (per mil)
−0.32
−0.04
0.4
−0.34
−1.33
−0.61
−0.18
−1.82
−0.13
−1.61
−1.07
−0.57
−0.68
−1.27
−0.53
−0.77
−0.04
−0.07
−1.07
−0.66
−0.74
−0.16
−0.66
−0.41
−3.67
−0.40
−1.22
−0.28
0.08
−0.31
−0.27
−0.72
−0.26
−0.49
−0.20
−0.38
−2.01
0.43
0.96
0.62
0.90
0.70
0.14
0.36
−0.24
−0.78
−0.54
−0.60
0.28
−0.78
0.47
�4
Geofluids
Table 2: Continued.
Sample
CM32620
CM32621
CM32622
jk 10 h12
cool rock
ly 03 h16
dn 04
nr 02
h13
dt 02 h8
rd 04
rd 04-2
h23
ct 02 h3
ly03
h16
jk01
Location
Baltic Mine, Michigan, USA
Baltic Mine, Michigan, USA
Baltic Mine, Michigan, USA
Coppermine, Canada
Coppermine, Canada
Coppermine, Canada
Coppermine, Canada
Coppermine, Canada
Coppermine, Canada
Coppermine, Canada
Coppermine, Canada
Coppermine, Canada
Coppermine, Canada
Coppermine, Canada
Coppermine, Canada
Coppermine, Canada
Coppermine, Canada
(e.g., chalcopyrite CuFeS2 ). The oxidized copper is transported downward toward the water table, where it is reprecipitated [25]. Near-surface oxidation zones in porphyry copper
deposits are a classic example of this process. Commonly,
some Cu remains in the leached capping. This incomplete
oxidation reaction results in fractionated copper through the
weathered profile. A reduction reaction of copper at the water
table where fresh metallic surfaces of pyrite and other sulfides
are present results in the precipitation of the reduced copper.
Due to the increased pH at the water table and effective
removal of copper via precipitation onto sulfide minerals, a
majority of the copper is thought to be recovered from the
oxidative solutions [26]. Late stage covellite (CuS) normally
accompanies supergene chalcocite, further demonstrating
the reductive nature of the reaction. Since reduction at the
water table is essentially complete, fractionation preserved
in the chalcocite from supergene enrichment will be due to
the oxidation stage weathering and so would be expected to
favor 65 Cu. Continual reworking of the previous supergene
enrichment layers due to uplift and erosion has been modeled
[27, 28] to illustrate how larger degrees of fractionation would
evolve.
A total of 182 samples from 10 locations are considered
(Table 1). Any data from the following sources that had listed
chalcocite as an analyzed phase was included [27, 29–36].
Data from Morenci, Ray, Chuquicamata, and Spence provide
type examples of supergene enrichment in classic porphyry
copper deposits.
3. The Behavior of Copper Isotopes and
Predicted Differences for Redox Reactions
While many reactions can result in a shift in copper isotope
values, redox reactions have been documented to produce
the most substantial changes; redox reactions that result in
Phase
cc
cc
cc
cc
cc
cc
cc
cc
cc
cc
cc
cc
cc
cc
cc
cc
cc
𝛿65 Cu (per mil)
−0.18
0.03
−0.05
−0.69
−1.35
0.07
−1.11
−0.51
−0.55
−0.07
−1.23
−1.24
−0.01
−1.49
−0.10
−0.25
−0.02
oxidized copper favor the 65 Cu isotope, whereas reactions
that result in reduced copper favor the 63 Cu isotope due to
stronger bonding environments for each isotope [33, 37–39].
Experimental and empirical data support the magnitude and
direction of copper isotope fractionation during the redox
reactions [33, 38, 39].
In the case of oxidative reactions, the weathering of
copper sulfide in supergene enrichment environments has
been studied in the greatest detail. Solutions that leach
copper during oxidation from the copper sulfide mineral
become enriched in the 65 Cu isotope due to a stronger
bonding environment [33, 38, 39]. Although the degree of
enrichment (fractionation factor) is different for a variety
of copper sulfides (chalcopyrite, chalcocite, bornite, and
enargite), in each case, the reactions produce cupric copper
(Cu+2 ) in solution which always has greater 𝛿65 Cu‰ than
the starting mineral. This phenomenon has been traced in
natural aqueous solutions such as rivers, lakes, groundwater,
and seawater [28, 40–43].
Reduction reactions involving copper have not been
as thoroughly studied. Laboratory experiments that reduce
copper from oxidized solutions have resulted in precipitated
solids that have lower 𝛿65 Cu‰ values than the starting
solutions [38]. Modeling of copper isotopes in sedimentary
copper deposits by Asael et al. [16] showed that the reduction of copper during transfer to solution should favor the
lighter copper isotope. Thus, the available data indicate that
reduction reactions favor the lighter copper isotope and that
the products of the reduction have lower 𝛿65 Cu‰ values
than the starting materials. Furthermore, current models
of copper behavior during redox reactions would predict
that supergene enrichment copper mineralization would be
associated with higher copper isotope values than that of
sedimentary copper deposits.
�Count
Geofluids
5
80
Hypogene chalcocite
70
2
60
50
Reductive
Oxidative
40
transport of Cu
transport of Cu
30
1
20
3
10
0
2
4
6
8 10
−10 −8 −6 −4 −2 0
1
2
3
Sedimentary Cu
Hypogene ore
Supergene enrichment
�훿 65 Cu
3
2
Fractures
Leach cap:
�훿65 Cu depleted
∇
Enrichment:
�훿65 Cu enriched
Evaporites
1
Red beds
Basement rock
Bimodal volcanic rocks
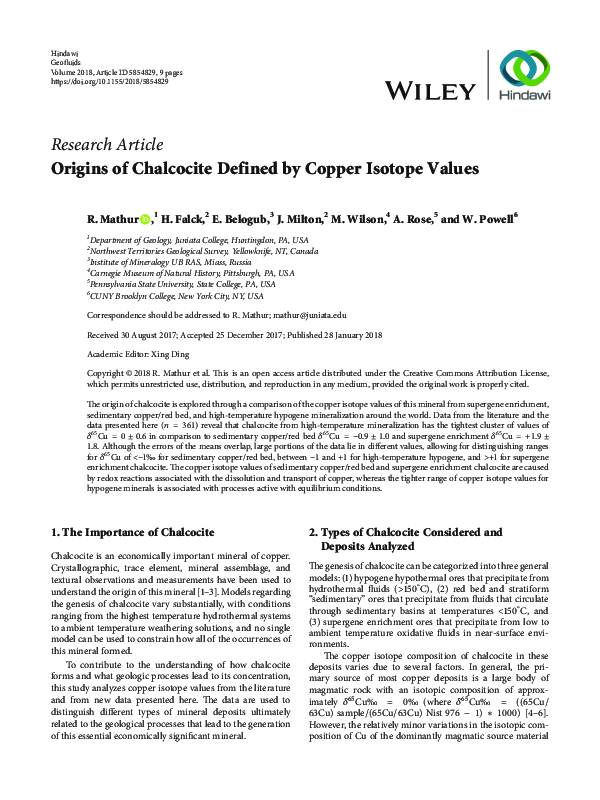
Figure 1: Histogram plot combined with a cartoon model of copper isotope values of chalcocite formed in three different environments. Data
from the supergene group show the largest range and overlap the ranges of the other two deposit types.
4. Methods for Cu Isotope Data Presented
A total of 68 new Cu isotope measurements from chalcocite
are presented. The chalcocite samples were handpicked from
veins or disseminations. X-ray diffraction techniques were
used to identify mineral species present and those methods
are described by Mathur et al. (2005). Approximately 30–40
milligrams of powdered chalcocite was dissolved in 15 ml
Teflon jars containing 4 ml of heated aqua regia for 12 hours.
Complete dissolution was visually confirmed. The solutions
were dried and copper was separated using ion exchange
chromatography described by Mathur et al. (2009).
Isotope measurements were conducted on ICP-MS multicollectors at the University of Arizona and the Pennsylvania
State University. Solutions were measured at 100 ppb and
mass bias was corrected for by standard-sample-standard
bracketing using the NIST 976 standard. Instrumentation
setup and run conditions are described in detail by Mathur
et al. (2005). Errors for the analyses presented are 0.1‰ and
2𝜎 and error calculation is described by Mathur et al. (2005).
Internal cent standards were measured at both locations
during the analytical sessions and the 1838 cent 𝛿65 Cu =
0.02 ± 0.1 (2𝜎, 𝑛 = 14).
5. Data and Its Implications
The histogram in Figure 1 compares the distribution of
copper isotope values of 361 chalcocite samples from three
distinct environments of formation: supergene enrichment
(182 samples), sedimentary copper deposits (161 samples),
and hypogene ores (18 samples). Each datum has an error on
the order of ±0.1‰ and data are binned at 0.5‰ increments.
All data reported here were compared to the NIST 976
standard with mass bias controlled by standard bracketing.
The mean values and 1-sigma variations for supergene
enrichment chalcocite are 𝛿65 Cu = +1.9 ± 1.8‰ (𝑛 = 182),
for sedimentary copper chalcocite are 𝛿65 Cu = −0.9 ± 1.0‰
(𝑛 = 161), and for hypogene chalcocite is 𝛿65 Cu = −0.001 ±
0.6‰ (𝑛 = 18). Although the three populations show considerable overlap in the weakly fractionated range, 64% of the
sedimentary copper measurements are less than −0.8‰, and
�6
Geofluids
Morenci, AZ
Udokan
PCD, Iran
Michigan
Inca de Oro, Chile
Coates Lake
Bayugo, Philippines
Kupferschiefer
Silver Bell, AZ
Dikulushi, DRC
Ray, AZ
Timna, Israel
−10
−8
−6
−4
0
2
−2
�훿65 Cu (per mil)
4
6
8
10
Figure 2: Mean and 1𝜎 error plot of specific deposit types comparing
the supergene and sedimentary chalcocite from the presented data.
65% of the chalcocite from supergene enrichment has 𝛿65 Cu
values greater than +1‰. The data portrayed in this manner
indicates that the copper isotopic composition of chalcocite
can be related to deposit types, with values less than −1‰
most likely related to sedimentary copper deposits, whereas
values greater than +1‰ are most likely formed under
supergene processes. To further detail variations in copper
isotope compositions between the two genetically distinct,
lower temperature deposits, a deposit specific comparison
is presented in Figure 2, with 1𝜎 variations calculated by
the standard deviations of all presented data. It is significant
that the deposit types have little overlap and lie completely
within the ranges suggested above. Despite the fact that
range boundaries are approximate and that none of the
limiting values define sharp divide, this approach provides
a statistically valid means for differentiating chalcocite from
sedimentary and supergene processes based on copper isotope composition.
Note that the variation associated with the supergene
enrichment deposits is significantly larger than that for the
other environments of mineralization and almost twice that
of sedimentary copper deposits. This most likely reflects the
fact that these supergene systems are still active, with continued mobilization and migration of copper with associated
evolution of copper isotopic compositions; that is, the active
supergene enrichment blanket is continuing to weather and
lose 65 Cu during oxidation as is evident at Morenci where the
top of the enrichment blanket contains chalcocite with lower
copper isotope values than that found at deeper levels [30].
It is interesting to note that the 𝛿65 Cu range of hightemperature hypogene chalcocite directly overlaps the 0±1‰
range in 𝛿65 Cu that has been documented in other copperrich sulfide minerals (bornite, chalcopyrite) from hightemperature hypogene mineralization, as compiled by Wall
et al. (2011) and Saunders et al. (2015). The overlap in isotopic
composition of high-temperature hypogene chalcocite with
that of high-temperature hypogene chalcopyrite and bornite
suggests that the processes that lead to copper isotope variations at elevated temperature are broadly similar regardless
of the resulting copper mineral assemblage. Several studies
[44–46] suggest that the range of copper isotope values may
be related to changes in pH or Eh or the partitioning of
Cu between liquid and vapor phases as the hydrothermal
solution cools. Overprinting high-temperature events could
potentially lead to greater degrees of fractionation; however,
none of the samples here have petrographic evidence to
suggest this. Additional experimental work is needed to
resolve the roles of different mechanisms that lead to these
small but measurable copper isotope variations and to decide
whether they vary systematically throughout a deposit as
suggested by Mathur et al. (2012) and Li et al. [10].
6. Transportation of Copper and
Precipitation of Chalcocite in Lower
Temperature Solutions
The hydrothermal systems being considered involve metal
migration at <150∘ C in mixtures of brine, diagenetic, and
meteoric fluids associated with typical sedimentary copper
and supergene enrichment processes [15, 25]. Geochemical modeling of reaction kinetics and equilibrium of the
observed mineral assemblages greatly enhanced our understanding of how and why metals move in these environments.
In general, these studies identify the controls of copper
transfer and precipitation in these systems as complicated
and impacted by many interrelated variables such as pH, Eh,
salinity, temperature, bulk chemistry of the solution, and bulk
chemistry of the substrate that initiates precipitation [47–50].
Coupled with isotopic studies of these ores and host rocks, the
reaction sources and pathways can be identified.
The copper in chalcocite (Cu2 S) from supergene enrichment and sedimentary copper deposits is hypothesized to
be mobilized and transported by two different redox reactions. For supergene enrichment, copper is oxidized from
preexisting copper minerals, which are exposed to meteoric
fluids during uplift and erosion. These fluids are dominantly
strongly acidic due to oxidation of pyrite accompanying the
Cu sulfides. The acid allows ready transport of Cu2+ . As all of
the deposits examined are still in the process of developing,
the reaction has not been completed and some Cu is left
behind in the leached zone. Thus, the source of the copper
is well understood.
In contrast, copper sources in sedimentary copper
deposits are much debated [13, 15]. However, it is agreed that
a likely source of the metal is Cu2+ adsorbed onto Fe oxides
within sandstones. The following two reactions (Davies, 1978)
describe how copper adheres to the adsorption of sites of Feoxide surfaces (see (1)) and how it is transported (see (2))
from adsorption sites:
𝑆OH + Cu+2 (aq) → 𝑆O-Cu+2 + H+
(1)
where 𝑆 is the surface of the Fe oxide or other minerals
H+ + 𝑆O-Cu+2 + 2Cl− + e− → CuCl2 − (aq) + 𝑆OH.
(2)
�Geofluids
With regard to the associated fractionation of copper isotopes, it is important to note that copper is transported in two
different redox states. In these near-neutral solutions, Cu2+ is
soluble, and transport is as CuCl0 or related complex ions [13].
Although many different copper molecules are likely formed
in association with carbonates, sulfates, and organic ligands, it
is the isotopic proportioning potential of the two redox reactions and the likelihood of partial extraction that will control
the measured variations in the copper isotopes. As shown
in Figures 1 and 2, the supergene enrichment chalcocite
preserves a heavier copper isotope value, which most likely
represents the transportation and concentration of oxidized
copper in the supergene. In contrast, the reduction reactions
that led to the transport of copper in the sedimentary copper
resulted in chalcocite that has significantly lower copper
isotope values.
The data presented here indicate that redox reactions
associated with copper transport are the primary means by
which copper fractionates in low-temperature systems. At
the deposition site, precipitation processes appear to have a
negligible contribution to the degree of isotopic differentiation through fractionation. For supergene enrichment copper
deposits, the oxidized copper molecule is reduced during the
formation of chalcocite when the oxidized waters interact
with the water table and hypogene sulfide minerals. This
reduction process is highly effective in removing copper from
solution [47], and the essentially complete precipitation of
dissolved copper results erases the record of redox fractionation in this process. In sedimentary copper deposits, copper
that is transported via CuCl complexes (such as CuCl2 − and
CuCl3 2− ) does not change redox state upon precipitation.
Thus, fractionation due to electron transfer during precipitation is not thought to occur in the sedimentary copper
chalcocite.
7. Conclusions
Despite the chemical complexity of the systems from which
chalcocite is produced, copper isotope values in chalcocite
provide a means by which the three major sources of
chalcocite may be differentiated: (1) 𝛿65 Cu values less than
−1.0 are most likely associated with sedimentary copper
deposits; (2) 𝛿65 Cu values greater than −1.0 are most likely
associated with supergene enrichment; and (3) a tightly
clustered population of 𝛿65 Cu at 0.0 is most consistent with
hypogene ores. These distinct variations in 𝛿65 Cu values in
chalcocite are controlled predominantly by redox reactions
at low temperature and equilibrium type reactions at high
temperatures. Therefore, copper isotope values in chalcocite
can provide insights into the genesis of chalcocite and can be
used to develop improved mineralization models.
Conflicts of Interest
The authors declare that they have no conflicts of interest.
Acknowledgments
The authors would like to thank J. Ruiz and M. Baker from the
University of Arizona for access and instrumentation setup
7
on the ISOPROBE and M. Gonzalez at the Pennsylvania State
University for the use of Neptune.
References
[1] D. A. Crerar and H. L. Barnes, “Ore solution chemistry
v solubilities of chalcopyrite and chalcocite assemblages in
hydrothermal solution at 200∘C to 350∘C,” Economic Geology,
vol. 71, no. 4, pp. 772–794, 1976.
[2] H. T. Evans, “Crystal Structure of Low Chalcocite,” Nature
Physical Science, vol. 232, no. 29, pp. 69-70, 1971.
[3] D. J. Vaughan, “Sulfide mineralogy and geochemistry: Introduction and overview,” Reviews in Mineralogy and Geochemistry,
vol. 61, pp. 1–5, 2006.
[4] W. Li, S. E. Jackson, N. J. Pearson, O. Alard, and B. W. Chappell,
“The Cu isotopic signature of granites from the Lachlan Fold
Belt, SE Australia,” Chemical Geology, vol. 258, no. 1-2, pp. 38–
49, 2009.
[5] S. A. Liu, J. Huang, J. Liu et al., “Copper isotopic composition of
the silicate Earth,” Earth and Planetary Science Letters, vol. 427,
pp. 95–103, 2015.
[6] E. M. Ripley, S. Dong, C. Li, and L. E. Wasylenki, “Cu
isotope variations between conduit and sheet-style Ni-Cu-PGE
sulfide mineralization in the Midcontinent Rift System, North
America,” Chemical Geology, vol. 414, pp. 59–68, 2015.
[7] S. Graham, N. Pearson, S. Jackson, W. Griffin, and S. Y.
O’Reilly, “Tracing Cu and Fe from source to porphyry: In situ
determination of Cu and Fe isotope ratios in sulfides from the
Grasberg Cu-Au deposit,” Chemical Geology, vol. 207, no. 3-4,
pp. 147–169, 2004.
[8] K. Ikehata and T. Hirata, “Copper isotope characteristics of
copper-rich minerals from the horoman peridotite complex,
Hokkaido, Northern Japan,” Economic Geology, vol. 107, no. 7,
pp. 1489–1497, 2012.
[9] P. B. Larson, K. Maher, F. C. Ramos, Z. Chang, M. Gaspar,
and L. D. Meinert, “Copper isotope ratios in magmatic and
hydrothermal ore-forming environments,” Chemical Geology,
vol. 201, no. 3-4, pp. 337–350, 2003.
[10] W. Li, S. E. Jackson, N. J. Pearson, and S. Graham, “Copper
isotopic zonation in the Northparkes porphyry Cu-Au deposit,
SE Australia,” Geochimica et Cosmochimica Acta, vol. 74, no. 14,
pp. 4078–4096, 2010.
[11] G. Markl, Y. Lahaye, and G. Schwinn, “Copper isotopes as
monitors of redox processes in hydrothermal mineralization,”
Geochimica et Cosmochimica Acta, vol. 70, no. 16, pp. 4215–4228,
2006.
[12] C. Meyer et al., “Ore deposits at Butte, Montana,” in Ore deposits
of the United States, 1967, pp. 1373–1416, 1968.
[13] A. W. Rose, “The effect of cuprous chloride complexes in
the origin of red-bed copper and related deposits,” Economic
Geology, vol. 71, no. 6, pp. 1036–1048, 1976.
[14] A. C. Brown, “Close linkage of copper (and uranium) transport
to diagenetic reddening of “upstream” basin sediments for
sediment-hosted stratiform copper (and roll-type uranium)
mineralization,” Journal of Geochemical Exploration, vol. 89, no.
1-3, pp. 23–26, 2006a.
[15] M. W. Hitzman, D. Selley, and S. Bull, “Formation of sedimentary rock-hosted stratiform copper deposits through earth
history,” Economic Geology, vol. 105, no. 3, pp. 627–639, 2010.
[16] D. Asael, A. Matthews, M. Bar-Matthews, and L. Halicz, “Copper isotope fractionation in sedimentary copper mineralization
�8
[17]
[18]
[19]
[20]
[21]
[22]
[23]
[24]
[25]
[26]
[27]
[28]
[29]
[30]
[31]
Geofluids
(Timna Valley, Israel),” Chemical Geology, vol. 243, no. 3-4, pp.
238–254, 2007.
D. Asael, A. Matthews, M. Bar-Matthews, Y. Harlavan, and I.
Segal, “Tracking redox controls and sources of sedimentary
mineralization using copper and lead isotopes,” Chemical Geology, vol. 310-311, pp. 23–35, 2012.
D. Asael, A. Matthews, S. Oszczepalski, M. Bar-Matthews, and
L. Halicz, “Fluid speciation controls of low temperature copper
isotope fractionation applied to the Kupferschiefer and Timna
ore deposits,” Chemical Geology, vol. 262, no. 3-4, pp. 147–158,
2009.
M. Haest, P. Muchez, J. C. J. Petit, and F. Vanhaecke, “Cu
isotope ratio variations in the Dikulushi Cu-Ag deposit, DRC: of
primary origin or induced by supergene reworking?” Economic
Geology, vol. 104, no. 7, pp. 1055–1064, 2009.
E. C. Jowett, “Genesis of kupferschiefer cu-ag deposits by
convective flow of rotliegende brines during triassic rifting,”
Economic geology Lancaster, Pa, vol. 81, no. 8, pp. 1823–1837,
1986.
A. C. Brown, “Genesis of native copper lodes in the Keweenaw
District, Northern Michigan: A hybrid evolved meteoric and
metamophogenic model,” Economic Geology, vol. 101, no. 7, pp.
1437–1444, 2006.
T. J. Bornhorst, J. B. Paces, N. K. Grant, J. D. Obradovich, and
N. K. Huber, “Age of native copper mineralization, Keweenaw
Peninsula, Michigan,” Economic Geology, vol. 83, no. 3, pp. 619–
625, 1988.
F. M. Chartrand and A. C. Brown, “The diagenetic origin
of stratiform copper mineralization, Coates Lake, Redstone
copper belt, N. W. T., Canada.,” Economic Geology, vol. 80, no.
2, pp. 325–343, 1985.
E. D. Kindle, “Classification and description of copper Deposits,
Coppermine River area, District of Mackenzie,” Tech. Rep. 214,
1972.
S. R. Titley and D. C. Marozas, “Processes and products
of supergene copper enrichment,” Arizona Geological Society
Digest, vol. 20, pp. 156–168, 1995.
W. X. Chavez, “Supergene oxidation of copper deposits; zoning
and distribution of copper oxide minerals,” SEG Newsletter, vol.
41: 1, pp. 10–21, 2000.
D. Braxton and R. Mathur, “Exploration applications of copper
isotopes in the supergene environment: A case study of the
bayugo porphyry copper-gold deposit, Southern Philippines,”
Economic Geology, vol. 106, no. 8, pp. 1447–1463, 2011.
R. Mathur and M. S. Fantle, “Copper isotopic perspectives
on supergene processes: Implications for the global Cu cycle,”
Elements, vol. 11, no. 5, pp. 323–329, 2015.
S. Asadi, R. Mathur, F. Moore, and A. Zarasvandi, “Copper
isotope fractionation in the Meiduk porphyry copper deposit,
Northwest of Kerman Cenozoic magmatic arc, Iran,” Terra
Nova, vol. 27, no. 1, pp. 36–41, 2015.
R. Mathur, M. Dendas, S. Titley, and A. Phillips, “Patterns in
the copper isotope composition of minerals in porphyry copper
deposits in Southwestern United States,” Economic Geology, vol.
105, no. 8, pp. 1457–1467, 2010.
R. Mathur, L. Munk, M. Nguyen, M. Gregory, H. Annell, and J.
Lang, “Modern and paleofluid pathways revealed by Cu isotope
compositions in surface waters and ores of the Pebble porphyry
Cu-Au-Mo deposit, Alaska,” Economic Geology, vol. 108, no. 3,
pp. 529–541, 2013.
[32] R. Mathur, L. A. Munk, B. Townley et al., “Tracing lowtemperature aqueous metal migration in mineralized watersheds with Cu isotope fractionation,” Applied Geochemistry, vol.
51, pp. 109–115, 2014.
[33] R. Mathur, J. Ruiz, S. Titley, L. Liermann, H. Buss, and S. Brantley, “Cu isotopic fractionation in the supergene environment
with and without bacteria,” Geochimica et Cosmochimica Acta,
vol. 69, no. 22, pp. 5233–5246, 2005.
[34] R. Mathur, S. Titley, F. Barra et al., “Exploration potential of Cu
isotope fractionation in porphyry copper deposits,” Journal of
Geochemical Exploration, vol. 102, no. 1, pp. 1–6, 2009.
[35] H. Mirnejad, R. Mathur, M. Einali, M. Dendas, and S. Alirezaei,
“A comparative copper isotope study of porphyry copper
deposits in Iran,” Geochemistry: Exploration, Environment,
Analysis, vol. 10, no. 4, pp. 413–418, 2010.
[36] C. Palacios, O. Rouxel, M. Reich, E. M. Cameron, and M. I.
Leybourne, “Pleistocene recycling of copper at a porphyry system, Atacama Desert, Chile: Cu isotope evidence,” Mineralium
Deposita, vol. 46, no. 1, pp. 1–7, 2011.
[37] D. M. Borrok, D. A. Nimick, R. B. Wanty, and W. I. Ridley, “Isotopic variations of dissolved copper and zinc in stream waters
affected by historical mining,” Geochimica et Cosmochimica
Acta, vol. 72, no. 2, pp. 329–344, 2008.
[38] S. Ehrlich, I. Butler, L. Halicz, D. Rickard, A. Oldroyd, and
A. Matthews, “Experimental study of the copper isotope fractionation between aqueous Cu(II) and covellite, CuS,” Chemical
Geology, vol. 209, no. 3-4, pp. 259–269, 2004.
[39] X. K. Zhu, Y. Guo, R. J. P. Williams et al., “Mass fractionation
processes of transition metal isotopes,” Earth and Planetary
Science Letters, vol. 200, no. 1-2, pp. 47–62, 2002.
[40] J. Bermin, D. Vance, C. Archer, and P. J. Statham, “The
determination of the isotopic composition of Cu and Zn in
seawater,” Chemical Geology, vol. 226, no. 3-4, pp. 280–297,
2006.
[41] S. M. Ilina, J. Viers, S. A. Lapitsky et al., “Stable (Cu, Mg) and
radiogenic (Sr, Nd) isotope fractionation in colloids of boreal
organic-rich waters,” Chemical Geology, vol. 342, pp. 63–75,
2013.
[42] S. H. Little, D. Vance, C. Walker-Brown, and W. M. Landing,
“The oceanic mass balance of copper and zinc isotopes, investigated by analysis of their inputs, and outputs to ferromanganese
oxide sediments,” Geochimica et Cosmochimica Acta, vol. 125,
pp. 673–693, 2014.
[43] D. Vance, C. Archer, J. Bermin et al., “The copper isotope
geochemistry of rivers and the oceans,” Earth and Planetary
Science Letters, vol. 274, no. 1-2, pp. 204–213, 2008.
[44] T. Fujii, F. Moynier, M. Abe, K. Nemoto, and F. Albarède, “Copper isotope fractionation between aqueous compounds relevant
to low temperature geochemistry and biology,” Geochimica et
Cosmochimica Acta, vol. 110, pp. 29–44, 2013.
[45] M. Pękala, D. Asael, I. B. Butler, A. Matthews, D. Rickard, and
M. Pękala, “Experimental study of Cu isotope fractionation
during the reaction of aqueous Cu(II) with Fe(II) sulphides at
temperatures between 40 and 200#xa0;∘C,” Chemical Geology,
vol. 289, no. 1-2, pp. 31–38, 2011.
[46] J. H. Seo, S. K. Lee, and I. Lee, “Quantum chemical calculations
of equilibrium copper (I) isotope fractionations in ore-forming
fluids,” Chemical Geology, vol. 243, no. 3-4, pp. 225–237, 2007.
[47] M. S. Enders, C. Knickerbocker, S. R. Titley, and G. Southam,
“The role of bacteria in the supergene environment of the
Morenci porphyry copper deposit, Greenlee County, Arizona,”
Economic Geology, vol. 101, no. 1, pp. 59–70, 2006.
�Geofluids
[48] A. J. Hartley and C. M. Rice, “Controls on supergene enrichment of porphyry copper deposits in the Central Andes: A
review and discussion,” Mineralium Deposita, vol. 40, no. 5, pp.
515–525, 2005.
[49] R. H. Sillitoe, “Supergene oxidized and enriched porphyry copper and related deposits,” in Economic Geology, 100 Anniversary
Volume, pp. 723–768, 2005.
[50] E. V. Belogub, K. A. Novoselov, V. A. Yakovleva, and B. Spiro,
“Supergene sulphides and related minerals in the supergene
profiles of VHMS deposits from the South Urals,” Ore Geology
Reviews, vol. 33, no. 3-4, pp. 239–254, 2008.
9
�International Journal of
Chemistry
Geophysics
Scientifica
Hindawi
www.hindawi.com
Volume 2018
Hindawi
www.hindawi.com
Volume 2018
The Scientific
World Journal
Hindawi Publishing Corporation
http://www.hindawi.com
www.hindawi.com
2013
Volume 2018
Advances in
Public Health
Hindawi
www.hindawi.com
Volume 2018
Journal of
Environmental and
Public Health
Advances in
Meteorology
Hindawi
www.hindawi.com
Hindawi
www.hindawi.com
Volume 2018
Volume 2018
Submit your manuscripts at
www.hindawi.com
Applied &
Environmental
Soil Science
Hindawi
www.hindawi.com
Journal of
Geological Research
Volume 2018
Hindawi
www.hindawi.com
International Journal of
International Journal of
Ecology
Agronomy
International Journal of
Forestry Research
Hindawi
www.hindawi.com
Volume 2018
Hindawi
www.hindawi.com
Volume 2018
International Journal of
Biodiversity
Hindawi
www.hindawi.com
Hindawi
www.hindawi.com
International Journal of
Advances in
Microbiology
Agriculture
Hindawi
www.hindawi.com
Volume 2018
International Journal of
Archaea
Volume 2018
Volume 2018
Analytical Chemistry
Volume 2018
Hindawi
www.hindawi.com
Volume 2018
Hindawi
www.hindawi.com
Journal of
Journal of
Chemistry
Marine Biology
Hindawi
www.hindawi.com
Volume 2018
Hindawi
www.hindawi.com
Volume 2018
Volume 2018
�
 ryan mathur