Available online at www.sciencedirect.com
Advances in Space Research 45 (2010) 1393–1406
www.elsevier.com/locate/asr
Total solar irradiance absolute level from DIARAD/SOVIM
on the International Space Station
Sabri Mekaoui a,b,*, Steven Dewitte a, Christian Conscience a, André Chevalier a
a
Royal Meteorological Institute of Belgium, Ringlaan 3, 1180 Brussel, Belgium
b
Vrije Universiteit Brussel, Pleinlaan 2, 1050 Brussel, Belgium
Received 27 February 2009; received in revised form 8 February 2010; accepted 10 February 2010
Abstract
Current measurements from DIARAD/VIRGO, PMO6V/VIRGO and ACRIM3 radiometers are of the same order of magnitude,
but differ from TIM/SORCE by about 4.5 W m�2. This difference is higher than the sum of the claimed individual absolute uncertainties
of the instruments. In this context, the SOLAR payload on the International Space Station embarks the SOVIM package. We give the
results of the differential absolute radiometer DIARAD/SOVIM and discuss its associated uncertainties. Compared to DIARAD/
VIRGO, all possible efforts have been made to improve the absolute accuracy. Substantial progress has been made in the aperture area
and electrical power measurements. The measured TSI value from the left channel of DIARAD/SOVIM during three days of June 2008
is 1364.50 ± 1.38 W m�2 (Total) or ±0.49 W m�2 (if we combine the individual contributions in quadrature). The right channel gives
1364.75 W m�2 with the same uncertainties. These values are about 1.2 W m�2 lower than DIARAD/VIRGO and about 4 W m�2 higher
than TIM/SORCE. The difference between the left and right channels measurements is as low as 0.25 W m�2 which is within the
improved uncertainty limits.
Ó 2010 Published by Elsevier Ltd. on behalf of COSPAR.
Keywords: Total solar irradiance; Absolute level; Instrumentation; TSI accuracy
1. Introduction
The early spaceborne measurements of Total Solar Irradiance (TSI) were suffering from a high level of noise and,
more problematically, from poor absolute accuracy. With
time, improvements in instrumentation allowed to converge towards the 1365 W m�2 value (Crommelynck
et al., 1995). The efforts were then concentrated on the
long-term TSI stability (Willson, 1999; Fröhlich, 2003;
Dewitte et al., 2004) and periodicities (Crommelynck and
Dewitte, 1997; Willson and Mordvinov, 1999). For the
determination of the Earth Radiation Budget (ERB),
efforts have then been focused on the measurements of
*
Corresponding author. Address: Royal Meteorological Institute of
Belgium, Ringlaan 3, 1180 Brussel, Belgium. Tel.: +32 23730607.
E-mail address: sabri.mekaoui@oma.be (S. Mekaoui).
URL: http://remotesensing.oma.be/TSI/ (S. Mekaoui).
0273-1177/$36.00 Ó 2010 Published by Elsevier Ltd. on behalf of COSPAR.
doi:10.1016/j.asr.2010.02.014
the outgoing energy (reflected solar and emitted thermal).
Recently, the quantification of the increase of ocean heat
storage indicated a theoretical global imbalance of the
ERB of 0.85 ± 0.15 W m�2 (Hansen et al., 2005). However,
observation of the ERB with the Clouds and Earth Radiant Energy System (CERES) (Wielicki et al., 1996) edition
2 data by Loeb et al. (2008) indicates an imbalance of
6.5 W m�2 which is larger than the 0.85 W m�2 theoretical
value. This initiated discussions on whether CERES outgoing energies have been underestimated and/or the
1365 W m�2 TSI absolute level has been overestimated.
The last assumption has been triggered by the recent
TIM/SORCE observations (Kopp et al., 2005) which are
4.5 W m�2 lower than the commonly measured value. This
new TSI value reduces the imbalance by 1.125 W m�2 (taking into account the geometrical factor of four for the sphericity of the Earth). This renews the interest for accurate
TSI measurements from space. The SOVIM package
�1394
S. Mekaoui et al. / Advances in Space Research 45 (2010) 1393–1406
onboard the International Space Station (ISS) has been
recently launched to address this question. Inside SOVIM,
a Differential Absolute Radiometer (DIARAD) has been
integrated. In this paper, we describe the DIARAD/
SOVIM TSI results and their associated uncertainties.
We describe the instrument in Section 2. The orbit and
attitude of the ISS constraints the observation strategy
(Section 3). Therefore, a new observation sequence is
adopted: the extended open sequence (Section 4). Different
steps of data processing (Section 5) are used to identify the
parameters determining the absolute accuracy. The electrical calibrations (Section 6) allow the determination of the
electrical powers in different configurations of the instrument (Section 7). These powers are the main component
of the instrument equation. Their uncertainties are discussed and verified by a check of the heating resistor values
(Section 8). The final TSI equation (Section 9) combines
the measured powers with onground measured instrumental parameters. Results are described and comparisons with
TIM/SORCE are made in Section 10.
2. Description
The SOVIM package is composed of three PMO6 absolute radiometers, two sunphotometers, one pointing sensor
(TASS) and one DIARAD radiometer. SOVIM is mounted
in the SOLAR payload of the International Space Station
(ISS) together with the SOLSPEC (Thuillier et al., 2008)
and SOLACE (Brunner et al., 2008) instruments. The DIARAD instrument is developed at the Royal Meteorological
Institute of Belgium. DIARAD is composed of two cylindrical cavities coated inside with diffuse black paint and
mounted next to each other on the same heat sink (Fig. 1
top). The flat bottoms of the cavities are in fact heat flux
transducers on which heating resistors have been mounted.
Every heating resistor has been mounted in series with a
current measuring resistor (Fig. 1 bottom). The voltage
over the four resistors is digitized through four independent electrical measurement channels. Two other channels
are dedicated to temperature measurements. Each of the
measuring channels is composed of a multiplexer, an
amplifier, a voltage to frequency converter (VFC) and a
counter. The data from the VFC’s are integrated in frames
of 10 s. A packet of data are composed of nine frames.
3. Solar periods
The SOLAR orbital period is around 90 min. Only some
orbits are dedicated to Solar observations. They are scheduled when the Beta angle (the angle between the plane of
the ISS’s orbit and the line connecting the centers of the
Earth and the Sun) is within ±23°. During solar observations the SOLAR payload tracks the Sun during 45 min.
Once in Sun acquisition mode, DIARAD/SOVIM uses
the data from a two-axis Sun sensor (TASS) to apply a
pointing correction. This correction takes into account
the offpointing of DIARAD with regards to the satellite-
Fig. 1. DIARAD detectors description and the four main measuring
channels �(the multiplexers
are not represented). The left and right heating
�
resistors Rheating are mounted in series with measuring resistors ðRmeas Þ.
Channels 1 and 2 (V/F1 and V/F 2) are dedicated to current measurements
while channels 3 and 4 are dedicated to voltage measurements. Two other
channels (channels 5 and 6) acquire the temperature in different part of the
instrument. These channels are not represented.
Sun direction. The classical working principle of DIARAD/SOVIM allows to have one acquisition every
3 min. Therefore, 15 measurements are possible if the Sun
is tracked during the 45 min of solar visibility. To increase
the number of acquisitions per orbit a new working principle of DIARAD is used: the extended open mode. This principle is described in the following section.
4. Measurement sequence
4.1. Classical sequence
In its classical working principle, DIARAD is operated
using successive open and closed states (Crommelynck,
1982; Mekaoui et al., 2004). Fig. 2 introduces the principle
using the left channel of DIARAD/VIRGO on SOHO.
During the first closed state both shutters are closed. The
servo system dissipates a power P left;closed in the left cavity
equal to the power dissipated in the right cavity by a reference voltage. Ninety seconds are necessary to have thermal
equilibrium between the two cavities. Only the last acquisition made at second 90 is used. During the next state only
the left shutter opens. A part proportional to the Solar
radiation (SI) is absorbed by the left cavity. The
� servo�
reduces the dissipated power in the left cavity P left;open
to maintain equilibrium between the cavities. Only the last
acquisition at second 90 is used. The comparison between
�S. Mekaoui et al. / Advances in Space Research 45 (2010) 1393–1406
1395
Fig. 2. Three consecutive states of DIARAD/VIRGO during a left side measurement cycle. Every state lasts 90 s during which the servo system regulates
the left power until it reaches the level of the right power. Top left, the left shutter is closed from time t � 90 s to t. The servo system dissipates a power
P left;closed until it reaches the level of P right;ref . Equilibrium is reached at second 90. Top middle, the left shutter closes from t to t + 90 s. The servo lowers the
dissipated power P left;open since the radiative power from the Sun is added to equal P right;ref . Top right: a closed state is repeated. Bottom: time evolution of
the different powers. Data are integrated every 10 s. For each cycle of 90 s, acquisition is made at seconds: 20, 50, 60, 80 and 90. For a better visualization,
the acquired data are linearly interpolated and an arbitrary offset is applied to the powers of the second closed state.
the regulated powers of both states gives a rough approximation of the Solar Irradiance (SI) each 3 min (90 s for the
open states and 90 s for the closed state) according to:
A � SIleft ðtÞ � P left;closed ðtÞ � P left;open ðtÞ
ð1Þ
where A is the area of the precision aperture of the active
channel. The detailed equation is discussed in Section 9.
Since both the open and closed states do not occur simultaneously,
� P left;closed ðtÞ
� in Eq. (1) is replaced by the average
powers P left;closed ðtÞ of the two closed states surrounding
the open state (see Fig. 2 bottom). During each of the
closed and open states, nine acquisitions are made. Only
five of them are dedicated to powers’ acquisitions. These
acquisitions are made at seconds 20, 50, 60, 80 and 90.
The four other acquisitions are associated to reference voltages and temperature measurements. The evolution of the
five acquired powers during a nominal sequence of measurements is represented in Fig. 2 (bottom).
4.2. Extended open measurement sequence
The extended open sequence is used to increase the number of acquisition points. In this sequence, the active channel has its shutter closed for 90 s. It is maintained
afterwards opened during 270 (3 � 90) s instead of 90 s.
This corresponds to a succession of one closed state and
three open states. This sequence is illustrated in Fig. 3.
During the first open state following a closed state, the
servo system reduces the regulated power to reach the equilibrium as during the classical operating mode. During the
following two open states, the servo system starts from an
equilibrium state. As a consequence all the power acquisitions made at seconds 20, 50, 60, 80 and 90 of the second
and third open states can be exploited as equilibrium measurement points. In total the succession of extended
sequences during Solar measurements gives 11 acquisitions
of the TSI every 6 min (the last acquisition of the first open
�1396
S. Mekaoui et al. / Advances in Space Research 45 (2010) 1393–1406
Fig. 3. Top: the extended open sequence is composed of one closed state and three open states. The localizations of the acquired temperatures are also
displayed. Bottom: the ‘�’ are the acquired dissipated power in the regulated cavity (left) during the different states. The data are linearly interpolated for a
better visualization. The ‘+’ are the weighted average of the regulated power of the two closed states surrounding the three open states.
state and each of the five acquisitions of the following two
open states). Compared to the classical operating mode,
this multiplies by a factor of 5.5 the number of acquisitions
during an orbit. In the next Section, we describe the applied
data processing to obtain the TSI and we discuss the associated uncertainties.
5. Data processing
The general processing is represented in Fig. 4. In the
demultiplexing step, the measured counts from each channel are attributed to a measured parameter. These counts
are then transformed in physical units during the calibration process. The power and their associated uncertainties
are calculated in the next step. The TSI calculation is finally
applied using the instrument parameters. The power and
TSI calculations as well as their associated uncertainties
are detailed in what follows.
6. Electrical calibrations
The calibration process aims at determining the count to
voltage relation for each channel. Two sets of reference
voltages are used. The current channels (channels 1 and
2) are calibrated using six level of a highly accurate temper-
Fig. 4. The main steps in the TSI data processing.
�1397
S. Mekaoui et al. / Advances in Space Research 45 (2010) 1393–1406
ature-stabilized reference voltage. Six other levels are used
for the calibration of the voltage channels (channels 3 and
4). These reference voltages have been measured on ground
in air and in vacuum. They showed no significant dependence to temperature variations (Conscience, 2005). The
calibration process is made every 90 s. A second-order least
square fit is then calculated using the six measurements of
counts and their corresponding reference voltages.
tor Rmeasurement (Fig. 1). We have Rmeasurement left ¼
Rmeasurement right ¼ 100:001 X. These resistors are measured
with 70 ppm uncertainty (Conscience, 2002). The calibration error is at maximum 40 ppm for currents in open
radiometric states and 5 ppm for currents in closed radiometric states (Fig. 6). The uncertainty of the current measurements is obtained by summing the calibration error,
the uncertainty of the reference voltages measurements
(15 ppm) and the uncertainty of the measurement of the
measuring resistor. This gives 125 ppm for currents in open
radiometric states and 90 ppm for currents in closed radiometric states.
6.1. Voltage measurements accuracy
The fitted calibration functions of the voltages channels
during a day of measurements are represented in Fig. 5
(top). Depending on the measured voltage, the residual
error is at maximum 15 ppm if the shutter is open and
7 ppm if closed (Fig. 5 bottom). The error on the voltage
measurements is obtained by summing the fitting errors
and the accuracy of the voltmeters used to obtain the reference voltages. The reference voltages are measured with
15 ppm uncertainty. As a consequence, the voltages corresponding to open states are measured with 30 ppm uncertainty and the voltages corresponding to closed states are
measured with 22 ppm uncertainty.
6.3. Temperature measurements
Eight temperatures are acquired: five in the radiometer
(T1–T5) and three in the electronics (T6–T8). T1 and T5
are located under the left and right shutters, T2 and T4
measure the temperature of the precision apertures while
T3 acquire the temperature of the heat sink (see Fig. 3).
The temperature T6 is acquired on the amplifier of channel
4, T7 on the multiplexer of channel 1 and T8 on the VFC of
channel 6. The location of T6, T7 and T8 is intended to
give a good spatial coverage of the temperature in the electronic. Fig. 7 displays the temperature evolution of DIARAD/SOVIM during six orbits. During the first three
orbits DIARAD/SOVIM is in standby mode. In this mode,
the instrument keep its shutters closed while the regulated
6.2. Current measurements accuracy
Volts
To find the currents, the voltage measurements of channels 1 and 2 are divided by the value of the measuring resis9
8.5
8
7.5
7
6.5
6
5.5
5
4.5
4
3.5
3
Left voltage
Right voltage
1e+06
1.5e+06
2e+06
2.5e+06
(V meas - V ref ) / V ref
Counts
5e-06
0
-5e-06
-1e-05
-1.5e-05
-2e-05
3
3.5
4
4.5
5
5.5
6
Volts
6.5
7
7.5
8
8.5
9
Fig. 5. Top: black “+”: daily measured counts corresponding to the reference voltages (V1–V6) from the left channel. Red “�”: counts from the right
channels. Curves: estimated second-order calibration functions for the voltages channels (red: right, black: left) during a day of measurements. Two bands
(red and green) indicate the operational working voltages for DIARAD/SOVIM: when one of the cavities has an open shutter, less power has to be applied
to cavity to maintain the equilibrium (see Section 3). The corresponding voltage is indicated by the horizontal green band. The red band indicates the
voltage level for a cavity with a closed shutter. Bottom: black “+”: relative error on the reference voltages for the left channel. Red “�”: relative error on
the reference voltages for the right channel. The relative error due to the use of the calibration functions can be deduced by comparing the vertical bands
and the neighborhood residual errors on the reference voltages. This error is of the order of 15 ppm for a cavity with an open shutter (green band) and
7 ppm for a cavity with a closed shutter (red band). (For interpretation of the references to color in this figure legend, the reader is referred to the web
version of this paper.)
�1398
Volts
S. Mekaoui et al. / Advances in Space Research 45 (2010) 1393–1406
2.4
2.2
2
1.8
1.6
1.4
1.2
1
0.8
Left current
Right current
1e+06
1.5e+06
2e+06
2.5e+06
(V meas - V ref ) / V ref
Counts
4e-05
2e-05
0
-2e-05
0.8
0.9
1
1.1
1.2
1.3
1.4
1.5 1.6
Volts
1.7
1.8
1.9
2
2.1
2.2
2.3
Fig. 6. Calibration functions (top) and residual errors (bottom) for the current channels (see also legend of Fig. 5).
and reference powers are inverted every 180 s. During
the last three orbits, the Sun is acquired by the left
channel.
plays the right and left powers during six orbits. During
the last three orbits, DIARAD is measuring with its left
cavity. The right power is the reference power and the left
power is the regulated one.
7. Power calculation
7.1. Reference power
The instrument’s working principle is based on the comparison of heat fluxes. For each of the cavities, the powers
are calculated using the equation (in the case of the right
power):
�
�
Rc þRd
Rc þRd
is the
, where Rheating
P right ¼ V right � I right � 1 þ Rheating
right
right
parasitic effect due to the heating resistor wires (Conscience, 2002).1 The error due to calibration can be estimated by summing the calibration errors on the current
6.1
measurements, voltage measurements
� (see Sections
�
Rc þRd
and 6.2) and the 15 ppm of the term 1 þ Rheating
induced
right
by the parasitic resistor determination. In addition to the
calibration errors, 50 ppm is added due to the noise level
of the servo system in the case of the regulated powers.
In total, the regulated open powers are measured with
220 ppm uncertainty. The regulated closed powers are measured with 177 ppm uncertainty and the reference powers
are measured with 127 ppm uncertainty (Table 1). These
uncertainties reduce to 139 ppm, 106 ppm and 94 ppm if
we compute the root of the sum of squares.2
The different powers as well as their dynamic range and
periodicities are shown from Fig. 8 to Fig. 12. Fig. 8 dis1
The power is determined by simultaneous measurements of the heater
current and voltage. Nevertheless, the connecting wires of the heating
resistor contributes to some parasitic effect due to their small resistance
values Rc and Rd .
2
We further use the acronym (RSS) to designate the root of the sum of
squares.
A constant reference power is dissipated in the right
cavity through its heating resistor according to
P ref ¼ V 2 =Rheating . The heating resistor value Rheating is linearly dependent of the heat sink temperature. As a consequence the evolution of the reference power is in phase
opposition with the heating resistor temperature variations.
The reference power during three orbits is displayed in
Fig. 9. The reference power varies in opposition with the
temperature of the heat sink (T3).
7.2. Regulated power
The left power (Fig. 8) depends on the status of the
shutter (open or closed). When there is no solar pointing
(Fig. 10), the difference between the powers in closed and
open states is due to the internal thermal emission of the
shutter. When the instrument points to the Sun, less electrical power is dissipated in the left cavity if its shutter is
open. Fig. 11 shows three sequences of the regulated
open power for each of the three orbits with solar acquisitions. They all display an upward trend due to the
increase of the instrument’s temperature during the day
part of the orbit. A magnification of the regulated open
power during the triple open sequence is shown in
Fig. 12. All acquisition points follow the upward trend
except the acquisition made at time t = 10 s where equilibrium has not been reached yet.
�1399
S. Mekaoui et al. / Advances in Space Research 45 (2010) 1393–1406
Celcius
66
T8
65
64
Celcius
58
96.5
96.56 2
96.62 5
96.68 8
96.75
57
T6
T7
56
55
17
Celcius
96.43 8
96.43 8
96.5
96.56 2
96.62 5
96.68 8
96.75
T1
T2
T3
T4
T5
16
15
14
96.43 8
96.5
96.56 2
96.62 5
96.68 8
96.75
Time (days of 2008)
Fig. 7. Temperature evolutions during six orbits. The vertical lines separate the orbits. The instrument is in standby mode during the first three orbits and
in Solar acquisition for the last three. The red hatch-marked zone on the top indicates the periods of Solar pointing. The front face temperatures T1 and T5
display the highest variation resulting from the day/night cycle. The difference between T1 and T5 is due to the lack of absolute calibration of the
temperature sensors. The unusual shape of their curve is due to the switch on and off of the thermal regulation of SOVIM’s heat shield. During the first
three orbits, the temperatures T2 and T4 of the precision apertures have the same variations. During the last three orbits, the left aperture temperature (T2)
displays some oscillation during the solar periods. These oscillations are due to the heating by the Sun when the shutter is open and due to cooling when
the shutter is closed. These oscillations are also observed with a lower amplitude in the right aperture temperature T4. The heat sink temperature (T3) is
correlated with the day/night cycle. The amplifier, multiplexer and voltage to frequency converter temperatures (T6, T7 and T8): T8 is used as reference
temperature point for the reference voltages. T6 and T7 are correlated with the day/night cycle. During Solar acquisition in orbits 4, 5 and 6, the
temperature (T7) of the multiplexer acquiring the left current shows some anomalies. These anomalies are due to grounding issues. (For interpretation of
the references to color in this figure legend, the reader is referred to the web version of this paper.)
Table 1
Electrical power measurement uncertainties. The uncertainties are
obtained by adding the individual contributions (Total), or by performing
the root of the sum of their squares (RSS).
Regulated open
state (ppm)
Regulated closed
state (ppm)
Reference
power
Error on current
Error on
voltage
Error on
parasitic
effect
Servo noise
125
30
90
22
90
22
15
15
15
50
50
0
Total (ppm)
RSS (ppm)
220
139
177
106
127
94
8. Heating resistor check
The four main measuring channels (Fig. 1) allow to have
independent measurements of the current and voltage for
each cavity. It is therefore possible to calculate the value
of the heating resistor in space according to (for the right
heating resistor):
Rheating right ¼ V right =I right
ð2Þ
These values are compared to a model determined on
ground (Conscience, 1999). The model describes the evolution of the resistor value as a function of the temperature of
the heat sink (T3). The comparison of the modeled and cal-
culated values is indicative of the absolute accuracy of the
power measurements. Figs. 13 and 14 display the calculated and modeled value for each of the left and right resistors. The model is corrected for an offset of 170 ppm. This
systematic uncertainty is within the limit of the accuracy of
the ground measurements of the resistor. Differences are
observed between the modeled and measured values when
the shutter is open compared to the period when the shutter
is closed. When the shutter is opened less power is dissipated in the cavity compared to when the shutter is closed.
Eq. (2) is then used for two value levels of I right . From Figs.
5 and 6, we see that the calibration errors are larger for the
voltage and current values in open states compared to the
calibration errors in closed states. The heating resistor value is therefore affected by the systematic calibration errors.
The variations on the heating resistors are of the order of
20 ppm; which is within the limit of the noise and fitting errors (Sections 6.1 and 6.2).
9. TSI calculation
The TSI is calculated using two closed states occurring
at time t = 0 s and t = 360 s (state 1 and state 2) surrounding three open states (Section 4.2). For each of the open
states starting at time t = 90 s, t = 180 s and t = 270 s,
the difference between the reference (right) and regulated
(left) powers is computed according to:
�1400
S. Mekaoui et al. / Advances in Space Research 45 (2010) 1393–1406
0.18
0.16
W
0.14
2
1
4
3
6
5
0.12
0.1
0.08
0.06
96.43 8
96.5
96.56 2
96.62 5
96.68 8
96.75
17
Celcius
16.5
16
T1
T5
T2
T3
T4
15.5
15
14.5
14
96.43 8
96.5
96.56 2
Days of 2008
96.62 5
96.68 8
96.75
Fig. 8. Top: left power (black curve) and right power (red curve) during six orbits. The data are linearly interpolated. During the first three orbits, the
instrument is in standby mode. During this sequence both shutters are closed. The reference power is dissipated in the right cavity while the servo regulates
the left cavity for 180 s. The process is then inverted for an other 180 s. During the last three orbits the instrument acquires the Sun with its left cavity. The
left power is regulated and the right power is the reference power. The vertical lines indicate the duration of an orbit. The reference power is magnified in
Fig. 9. The higher dashed square highlights the regulated power levels when the shutter is closed. These powers are magnified for the last three orbits in
Fig. 10. The lower dashed square highlights the level of the powers when the shutter is open during Solar acquisition. Theses powers are magnified in Figs.
11 and 12. Bottom: temperature evolution during the six orbits. (For interpretation of the references to color in this figure legend, the reader is referred to
the web version of this paper.)
0.1776
0.177599
4
5
6
W
0.177598
0.177597
0.177596
0.177595
0.177594
96.562
96.625
96.688
96.75
17
Celcius
16.5
16
T1
T5
T2
T3
T4
15.5
15
14.5
14
96.562
96.625
96.688
96.75
Days of 2008
Fig. 9. Top: reference power in the right cavity during the last three orbits with solar acquisition. The red hatched zone indicates the periods of solar
pointing. Bottom: the temperatures are represented to show the correlation with the reference power. The reference power varies in opposition with the
evolution of the temperature of the base. (For interpretation of the references to color in this figure legend, the reader is referred to the web version of this
paper.)
DP open ðtÞ ¼ P right ðtÞ � P left open ðtÞ
ð3Þ
DP open is measured with ±25 lW uncertainty (Total3) and
±19 lW (RSS4).
3
4
We add the individual absolute uncertainties.
We compute the root sum of squares of the individual uncertainties.
The difference DP open is compared to the linear interpolation DP closed ðtÞ of DP closed 1 ðtÞ and DP closed 2 ðtÞ where:
DP closed 1 ðtÞ ¼ P right 1 ðtÞ � P left closed 1 ðtÞ
ð4Þ
DP closed 2 ðtÞ ¼ P right 2 ðtÞ � P left closed 2 ðtÞ
ð5Þ
�1401
S. Mekaoui et al. / Advances in Space Research 45 (2010) 1393–1406
0.173
4
5
6
Closed power
with Sun
W
0.1729
Open power
without Sun
0.1728
0.1727
0.1726
Closed power
without Sun
0.1725
96.562
96.625
96.688
96.75
17
Celcius
16.5
16
T1
T5
T2
T3
T4
15.5
15
14.5
14
96.562
96.625
96.688
96.75
Days of 2008
Fig. 10. Top: the regulated power in the left cavity when the shutter is open and closed, in the case of Solar pointing (red hatched zone) and without Solar
pointing (green hatched zone). The difference of power levels between the open and closed states in the absence of solar pointing is due to the shutter
internal thermal emission. During Solar pointing, the regulated power in open states of the instrument is much lower than for the closed states. This power
is out of the range of the figure. It is represented in Fig. 11. Bottom: temperature evolution during the three orbits. The regulated power is correlated with
the evolution of T3 (blue curve). (For interpretation of the references to color in this figure legend, the reader is referred to the web version of this paper.)
0.0648
W
0.0646
6
5
4
0.0644
0.0642
96.562
96.625
96.688
96.75
17
Celcius
16.5
16
T1
T5
T2
T3
T4
15.5
15
14.5
14
96.562
96.625
96.688
96.75
Days of 2008
Fig. 11. Regulated open power during the solar pointing for the three orbits of solar acquisition. The upward trend in each of the orbits is due to average
increase of the instrument’s temperature. The dashed square shows the powers for the three successive open states. These powers are magnified in Fig. 12.
where P right 1 ðtÞ and P right 2 ðtÞ are the reference powers during the two closed states. P right ðtÞ is the reference power
during the open states.
DP closed is measured with an uncertainty of ±35 lW
(Total) and ±24 lW (RSS).
The Solar Irradiance (SI) is computed according to:
�
�
SI ¼
DP open ðtÞ�DP closed ðtÞ
ðaabs �ath �servocst Þ
0
ðA � ð1:0 þ R þ R þ dÞ � cos hÞ
þ Dshutter
ð6Þ
The different parameters of Eq. (6) are described in what
follows. Their uncertainties are summarized in Table 2. Details can be found in Crommelynck (1982). The SI is finally
normalized to 1 AU and corrected for velocity effects
according to:
� �
� r �2 �
dr
c :
1þ2
TSI ¼ SI
1 AU
dt
ð7Þ
9.1. Geometrical corrections
� Precision aperture (A) at temperature T = 20 °C: The
precision apertures have been measured at NIST5 and
NPL6; we use the average of the NIST and NPL measurements. We have Aleft ¼ 0:0000794094 m2 and
Aright ¼ 0:0000794533 m2 with 150 ppm uncertainty.
5
6
National Institute of Standards and Technology.
National Physical Laboratory.
�1402
S. Mekaoui et al. / Advances in Space Research 45 (2010) 1393–1406
Ohm
Fig. 12. Regulated open power for the three successive open states. An acquisition point at time t = 10 s is made when the servo did not reach its
equilibrium. All the following points have a slight increasing trend corresponding to the overall increase of the temperatures during the solar pointing.
349.058
349.057
349.056
349.055
349.054
349.053
349.052
349.051
349.05
349.049
96.438
96.5
96.562
6
5
4
3
2
1
96.625
96.688
96.75
17
Celcius
16.5
16
T1
T5
T2
T3
T4
15.5
15
14.5
14
96.438
96.5
96.562
96.625
Days of 2008
96.688
96.75
Fig. 13. Top: calculated left resistor value when the left shutter is closed (red dots) and open (green dots) for the six orbits. A difference is observed for the
last three orbits during the solar pointing periods. These differences are due to the systematic errors of the electrical calibration. The curve in black
represents the modeled resistor value. Bottom: temperature evolution during the six orbits. (For interpretation of the references to color in this figure
legend, the reader is referred to the web version of this paper.)
The precision apertures are made of Invar. This material
has a very low coefficient of thermal expansion (CTE of
the order of 1:5 � 10�6 K�1 ). Therefore, the thermal
dilatation of the precision aperture due to the opening
and closing of the shutter is considered to be negligible.
� Distance, velocity and pointing corrections: The distance r between the radiometer and the center of the
of the satellite relatively to
Sun, the radial velocity dr
dt
the Sun and the angle between the direction of the Sun
and the radiometer (h) are used to finally compute the
TSI according to Eq. (7).
9.2. Optical corrections
� The absorption coefficient of the cavity aabs : This coefficient corresponds to the amount of light trapped by the
radiometric cavity. For DIARAD/SOVIM we have
aabs ¼ 0:999748 for both the left and right cavity with
a 45 ppm uncertainty. This coefficient is calculated on
the basis of the geometric dimension of the cavity and
the measured hemispheric absorptivity of the black
paint. This paint absorptivity is measured on the ground
using a synchronous detection setup. It is of the order of
0.972 ± 0.003 (Mekaoui, 2008). This value is measured
at only one wavelength (512 nm).
� The effect of backscattered radiation within the view
limiting volume (R): The openings below the shutters
(the front apertures) are actually larger than the surface
of the precision apertures. Part of the radiation entering
from the front aperture (when the shutter is open) is
therefore reflected by the precision aperture (see
Fig. 1). This reflected radiation is partly reflected back
by the limiting volume between the shutter and the precision aperture. R is the ratio between this backscattered
radiation falling in the active cavity after multiple reflec-
�1403
Ohm
S. Mekaoui et al. / Advances in Space Research 45 (2010) 1393–1406
349.058
349.057
349.056
349.055
349.054
349.053
349.052
349.051
349.05
349.049
96.438
96.5
96.562
6
5
4
3
2
1
96.625
96.688
96.75
17
Celcius
16.5
16
T1
T5
T2
T3
T4
15.5
15
14.5
14
96.438
96.5
96.562
Days of 2008
96.625
96.688
96.75
Fig. 14. Top: calculated right resistor value when the left shutter is closed (red dots) and open (green dots) for the six orbits. No significative difference is
observed due to systematic electrical calibration since the right shutter remains closed. The curve in black represents the modeled resistor value. Bottom:
temperature evolution during the six orbits. (For interpretation of the references to color in this figure legend, the reader is referred to the web version of
this paper.)
Table 2
Instrument parameters measurement accuracies. The uncertainty on the pointing correction (cos h) is negligible. The values, the absolute uncertainties as
well as the relative uncertainties (when needed) are provided both by adding the individual contributions in quadrature (RSS) and by computing the sum.
The uncertainty on the multiplicative terms of Eq. (6) are also provided.
Instrument parameters
Value
Relative uncertainty
aabs left, aabs right
ath left, ath right
R
R0
d
Aright
Aleft
servocst
0.999748, 0.999748
0.998490, 0.998930
0.75e�5
4.5e�5
0.0005
0.0000794533 m2
0.0000794094 m2
1.000000
±45 ppm
±120 ppm
±0.013
±0.012
±0.2
±150 ppm
±150 ppm
±15 ppm
Uncertainty on the terms of Eq. (6)
1 þ R þ R0 þ d
1.000552
DP open � DP closed
0.108000 W
Dshutter
1.24 W m�2
1361.68 W m�2
±100 ppm
±100 ppm
±289 ppm
±562 ppm
±0.024
±364 ppm
±992 ppm
DP open �DP closed
aabs �ath �servocst �A�cos h�ð1:0þRþR0 þdÞ
±0.01e�5
±0.1e�5
±0.0001
(RSS)
(Total)
(RSS)
(Total)
(RSS)
(Total)
Uncertainty on SI
RSS
Total
tions and the radiative power directly going into the cavity (SI � A). We have R ¼ 0:75 � 10�5 . This value is estimated from DIARAD/VIRGO characterization.
� The scattering of radiation by the front aperture (R0 ): R0
is the ratio between the scattered radiation by the front
aperture which enters the active cavity and SI � A. R0 is
also estimated from DIARAD/VIRGO characterization. We have R0 ¼ 4:5 � 10�5 .
� The diffraction of radiation (d = 0.0005): d is the ratio
between the diffracted radiation by the front aperture
of the active channel which falls into the active cavity
and SI � A. d is of the order of 0.0005 (NIST estimated
value).
Absolute uncertainty
±0.0001 (RSS)
±0.0001 (Total)
±0.000031 W (RSS)
±0.000060 W (Total)
±0.030 W m�2
±0.495 W m�2 (RSS)
±1.35 W m�2 (Total)
±0.496 W m�2 (RSS)
±1.38 W m�2(Total)
9.3. Thermal corrections
� The thermal efficiency or effective absorptivity of
the cavity ðath Þ: From the part of the absorbed radiation in the cavity only a proportion is effectively
detected by the heat flux sensor. The other part is
dissipated by the external wall of the cavity. The
efficiency of the cavity sensor system7 is determined in
air and vacuum. We have for DIARAD/SOVIM:
7
The system is composed of a heat flux transducer, a heating resistor
and a cylindrical cavity.
�1404
S. Mekaoui et al. / Advances in Space Research 45 (2010) 1393–1406
0¼
�
�
DP open ðtÞ�DP closed ðtÞ
ðaabs �ath �servocst Þ
0
ðA � ð1:0 þ R þ R þ dÞ � cos hÞ
1370
Solar Irradiance (W/m²)
ath left ¼ 0:998490 and ath right ¼ 0:998930 in vacuum
with 120 ppm uncertainty. In air, ath left ¼ 0:995863
and ath right ¼ 0:995842.
� The shutter correction ðDshutter Þ: This correction takes
into account the contribution of the internal thermal
emission of the active shutter. This contribution is
removed when the shutter is open. For DIARAD/
SOVIM the shutter correction is determined during deep
space pointing just after the solar period. During this
phase, the temperature of the shutter does not change
significantly. Eq. (6) becomes:
1360
1350
1340
1330
100
þ Dshutter
ð8Þ
It is therefore possible to derive Dshutter . Fig. 10 illustrates
the contribution of the internal thermal emission of the left
shutter during the deep space pointing. The contribution is
of the order of 1.24 ± 0.05 W m�2.
9.4. Electrical corrections
� The parasitic wire heating: This effect has been discussed
in Section 7.
� The value of the resistor used to measure the heating
currents: This effect is described in Section 6.2.
� The correction for the time constant of the system (servocst): During the first open sequence following a closed
sequence, the open powers acquired at seconds: 20, 50,
60 and 80 do not correspond to an equilibrium state. It
is possible to introduce a factor (servocst) to estimate the
asymptotic value of each acquisition. For DIARAD/
SOVIM the triple open sequence guarantee that equilibrium is reached during the third open state. This asymptotic value is used to compute the correction factor for
each of the previous state. We have chosen to apply a factor equal to 1 after 90 s and not to use the measurements
up to 90 s.
10. Uncertainty and TSI results
150
200
Days of 2008
250
Fig. 15. SI measurements (Eq. (7)) during the 6 months of mission for
DIARAD/SOVIM left channel. The SI decreases and then increases as the
Earth moves around the Sun. The effect of the distance is corrected in
Fig. 16. The outliers are caused by some reflections on the ISS.
We present the two approaches with their associated calculations in Table 2.
We write Eq. (6) as:
SI ¼
a�b
þe
c�d
with a ¼ DP open ðtÞ; b ¼ DP closed ðtÞ; c ¼ ð1:0 þ R þ R0 þ dÞ;
d ¼ aabs � ath � servocst � A � cos h and e ¼ Dshutter .
¼ 562
� Dða � bÞ ¼ Da þ Db ¼ 60 lW. Therefore, Dða�bÞ
a�b
ppm.Alternatively, we can consider (a � b) as the difference of two independent Gaussian distributions with
estimated
standard
deviations sa and sb .8 Therefore,
pffiffiffiffiffiffiffiffiffiffiffiffiffi
ffi
sða�bÞ ¼ s2a þ s2b which gives an uncertainty of 31 lW.
sða�bÞ
¼ 289 ppm.
As a consequence, a�b
¼ 100 ppm (Total) and
� Similarly, Dc ¼ 0:0001 and Dc
c
also 100 ppm (RSS).
Since the terms of Eq. (9) are independent,9 we have:
sffiffiffiffiffiffiffiffiffiffiffiffiffiffiffiffiffiffiffiffiffiffiffiffiffiffiffiffiffiffiffiffiffiffiffiffiffiffiffiffiffiffiffiffiffiffiffiffiffiffiffiffiffiffiffiffiffiffiffiffiffiffiffiffiffiffiffiffiffiffiffiffiffiffiffiffiffiffiffiffiffiffiffi
sa�b
s2a
s2
s2a�b
s2 s2a
s2
c�d
þ c2 þ 2abs þ 2th þ servocst2 þ A2
¼
a�b
2
c
aabs ath servocst A
ða � bÞ
c�d
¼ 364 ppm
10.1. Uncertainty
The accuracy of each channel is determined by the TSI
equation (Eqs. (6) and (7)). These equations are based on
power and instruments parameters determination. The
power relative uncertainty is of the order of 139 ppm in
open states (see Table 1). Instruments parameters are determined on ground (in air and vacuum) during the characterization phase. Two approaches can be used to compute the
uncertainty of Solar Irradiance measurements, either by
adding the individual relative uncertainties or by computing the Root of the Sum of Squares (RSS). The uncertainty
is of the order of 1.38 W m�2 (Total) and 0.496 W m�2
(RSS) (see Table 2).
ð9Þ
Alternatively, we can add the individual
uncertainties:
� �
D a�b
Dða � bÞ Dc Dd
c�d
þ
þ
¼ 992 ppm
¼
a�b
a�b
c
d
c�d
ð10Þ
relative
ð11Þ
Finally, the uncertainty on the SI given by: sSI ¼
qffiffiffiffiffiffiffiffiffiffiffiffiffiffiffiffi
s2a�b þ s2e , is equal to 0.496 W m�2.
c�d
8
We use the absolute uncertainties as estimations of the standard
deviations.
9
The uncertainty on h being very small, we neglect the uncertainty on
the pointing correction.
�S. Mekaoui et al. / Advances in Space Research 45 (2010) 1393–1406
1405
1365.3
DIARAD/VIRGO left no ageing
DIARAD/SOVIM orbit means of left channel
DIARAD/SOVIM orbit means of right channel
1365.2
TSI (W/m²)
1365.1
1365
1364.9
1364.8
1364.7
2454600
2454650
Julian day
2454700
Fig. 16. TSI orbital means from DIARAD/SOVIM left (red dots) and
right (blues crosses) channels. The dispersion of measurements is of the
order of 0.13 W m�2. The measurements during each orbit are presented
for three days of observations in Fig. 17. For comparison, DIARAD/
VIRGO 3-min left channel measurements are also displayed. These data
are not corrected for the ageing effects which are of the order of 1.2 W m�2
over 13 years. (For interpretation of the references to color in this figure
legend, the reader is referred to the web version of this paper.)
�
When adding the absolute uncertainties DSI ¼ D a�b
þ
c�d
DeÞ the value becomes 1.38 W m�2. Fig. 15 shows the SI
measurements during the entire mission. These measurements are then corrected for the distance, velocity and pointing effects in Fig. 16.
10.2. TSI results
Both the left and right channels measurements are presented. DIARAD/SOVIM is nominally operating with its
left cavity. The right cavity is used for ageing monitoring.
The dispersion of DIARAD/SOVIM is of the order of
0.13 W m�2. The difference between the channels is of the
order of 0.25 W m�2. This difference is within the individual
channel absolute uncertainties. For comparison DIARAD/
VIRGO measurements on SOHO are displayed in Fig. 16.
These data do not take into account the 1.2 W m�2 offset
due to the long-term ageing corrections. Some disagreement between DIARAD/SOVIM and DIARAD/VIRGO
appears after Julian date 2454700. After that date, DIARAD/VIRGO increases faster due to a transient effect
following a swith off. This effect is currently under
investigation.
Fig. 17 shows the left and right channels measurements for three days of the mission (13, 14 and 15 of
June 2008). All the measurements of an orbit are represented. For this period, the TSI level from DIARAD/
SOVIM was 1364.50 ± 1.38 W m�2 (Total) for the left
channel and 1364.75 ± 1.38 W m�2 (Total) for the right
channel. On the other hand, DIARAD/VIRGO has an
absolute uncertainty of the order of 1.06 W m�2
(Mekaoui et al., 2004). Therefore, the 1.2 W m�2 difference between DIARAD/VIRGO and DIARAD/SOVIM
is within the instruments absolute uncertainties.
Compared to TIM/SORCE measurements, DIARAD/
Fig. 17. TSI measurements from DIARAD/SOVIM left (black) and right
(red) channels during each orbit for three days (13, 14 and 15) of June
2008. (For interpretation of the references to color in this figure legend, the
reader is referred to the web version of this paper.)
SOVIM is 4 W m�2 higher (see Fig. 18). It is worth
noticing that the integration of DIARAD/SOVIM has
been undertaken in 2005. Therefore, it was not
possible to follow the community recommendations
issued during the TSI accuracy workshop held at NIST
(Butler et al., 2008). In particular, it was not possible
to validate DIARAD with end-to-end optical power or
irradiance tests having SI traceability to national standards laboratories.
11. Conclusion
This paper gives a rigorous description of the DIARAD/SOVIM TSI data processing and the related uncertainty analysis. A new extended open sequence has been
introduced to increase the TSI sampling rate. Compared
to previous versions of the DIARAD instruments efforts
have been done to improve the absolute uncertainty of
the electrical power measurements and the precision aperture determination. The uncertainty of the electrical power
measurements is 220 ppm.
Concerning the acquired data, the TSI value from
DIARAD/SOVIM for three days of measurements (13,
14 and 15 of June 2008) was 1364.50 ± 1.38 W m�2 for
the left channel and 1364.75 ± 1.38 W m�2 for the right
channel. The uncertainty of ±1.38 W m�2 is obtained
when the individual contributions of the instrument equation are added. If they are combined in quadrature, the
uncertainty is around ±0.497 W m�2. The difference
between the independent left and right channel measurements is as low as 0.25 W m�2, which is within the absolute uncertainty limit of ±1.38 W m�2 (Total) and
±0.497 W m�2 (RSS). Although DIARAD/SOVIM TSI
measurements are 1.2 W m�2 lower than DIARAD/
VIRGO TSI value, it is still 4 W m�2 higher than TIM/
SORCE TSI measurements.
�1406
S. Mekaoui et al. / Advances in Space Research 45 (2010) 1393–1406
TSI measurements from individual instruments
1375
1374
1373
1372
1371
1370
1369
TSI ( W/m²)
1368
1367
1366
1365
1364
1363
1362
1361
1360
1359
ACRIM 1, 2 and 3
SOVA 1
ERB
SOVA 2
DIARAD /VIRGO
TIM
DIARAD /SOVIM
ERBS
PMO6 V /VIRGO
NOAA 9
NOAA 10
SOLCON
1358
1357
1978 1980 1982 1984 1986 1988 1990 1992 1994 1996 1998 2000 2002 2004 2006 2008 2010
Years
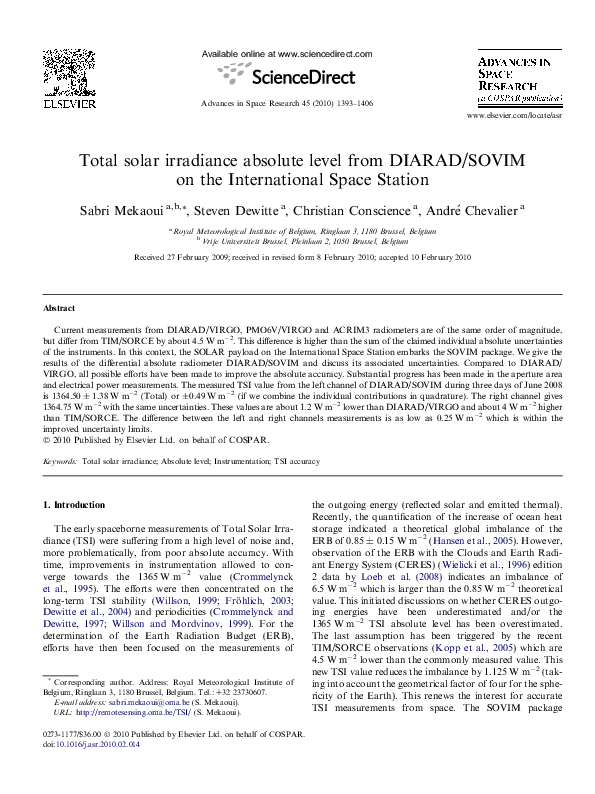
Fig. 18. TSI measurements on their native scale, DIARAD/SOVIM measurements (dark blue +) differ from TIM/SORCE by +4 W m�2. (For
interpretation of the references to color in this figure legend, the reader is referred to the web version of this paper.)
References
Brunner, R., Schmidtke, G., Brunner, R., Konz, W., Nikutowski, B.
SolACES – auto-calibrating EUV/UV spectrometers for measurements onboard the International Space Station (ISS), in: 37th
COSPAR Scientific Assembly, Montréal, Canada, 13–20 July 2008,
COSPAR, vol. 37, Plenary Meeting, p. 389, 2008.
Butler, J.J., Johnson, B.C., Rice, J.P., Shirley, E.L., Barnes, R.A. Sources
of differences in on-orbital total solar irradiance measurements and
description of a proposed laboratory intercomparison. J. Res. Natl.
Inst. Stand. Technol. 113, 187–203, 2008.
Conscience, C. Procédures de test des résistances de chauffage de la tête
radiométrique CR07, Royal Meteorological Institute of Belgium
Technical Note 145, 1999.
Conscience, C. Mesures des résistances de 100 R de SOVIM. Royal
Meteorological Institute of Belgium, 2002.
Conscience, C. Thermal Vacuum Report, Royal Meteorological Institute
of Belgium, 2005.
Crommelynck, D.A. Fundamentals of absolute pyroheliometry and
objective characterization, in: Hall Jr., J.B. (Ed.), Earth Radiation
Science Seminars, pp. 53–88, August 1982.
Crommelynck, D., Dewitte, S. Solar constant temporal and frequency
characteristics. Solar Phys. 173, 177–191, 1997.
Crommelynck, D., Fichot, A., Lee III, R.B., Romero, J. First realisation
of the Space Absolute Radiometric Reference (SARR) during the
ATLAS 2 flight period. Adv. Space Res. 16, 17, 1995.
Dewitte, S., Crommelynck, D., Mekaoui, S., Joukoff, A. Measurement
and uncertainty of the long-term total solar irradiance trend. Solar
Phys. 224, 209–216, 2004.
Fröhlich, C. Long-term behaviour of space radiometers. Metrologia 40,
60, 2003.
Hansen, J., Nazarenko, L., Ruedy, R., Sato, M., Willis, J., Del Genio, A.,
Koch, D., Lacis, A., Lo, K., Menon, S., Novakov, T., Perlwitz, J.,
Russell, G., Schmidt, G.A., Tausnev, N. Earth’s energy imbalance:
confirmation and implications. Science 308, 1431–1435, 2005.
Kopp, G., Lawrence, G., Rottman, G. The Total Irradiance Monitor
(TIM): science results. Solar Phys. 230, 129–139, 2005.
Loeb, Norman G., Wielicki, Bruce A., Doelling, David R., Smith, G.
Louis, Keyes, Dennis F., Kato, Seiji, Manalo-Smith, Natividad,
Wong, Takmeng Towards optimal closure of the Earth’s top-ofatmosphere radiation budget. J. Climate 8, 2008.
Mekaoui, S. Reflectivity measurements of SOVIM, VIRGO and SOVAP
black paints, Royal Meteorological Institute of Belgium Technical
Note, December 2008.
Mekaoui, S., Dewitte, S., Crommelynck, D., Chevalier, A., Conscience,
C., Joukoff, A. Absolute accuracy and repeatability of the RMIB
radiometers for TSI measurements. Solar Phys. 224, 237–246, 2004.
Thuillier, G., Bolsee, D., Gillotay, D., Foujols, T. SOLSPEC measurement of the solar absolute spectral irradiance from 165 to 3080 nm on
board the International Space Station, in: 37th COSPAR Scientific
Assembly, Montréal, Canada, 3–20 July 2008, COSPAR, vol. 37,
Plenary Meeting, p. 3185, 2008.
Wielicki, B.A., Barkstrom, B.R., Harrison, E.F., Lee III, R.B., Smith,
G.L., Cooper, J.E. Clouds and the Earth’s Radiant Energy System
(CERES): an Earth observing system experiment. Bull. Ame. Meteorol. Soc. 77, 853–868, 1996.
Willson, R.C. Solar irradiance variations, in: Strong, K.T. Saba, J.L.R.,
Haisch, B.M., Schmelz, J.T. (Eds.), The Many Faces of the Sun: A
Summary of the Results from NASA’s Solar Maximum Mission, p. 19,
1999.
Willson, R.C., Mordvinov, A.V. Time–frequency analysis of total solar
irradiance variations. Geophys. Res. Lett. 26, 3613–3616, 1999.
�
 Andre Chevalier