J. Dairy Sci. 95:1240–1248
http://dx.doi.org/10.3168/jds.2011-4586
© American Dairy Science Association®, 2012.
Associations of subclinical hypocalcemia at calving with milk yield,
and feeding, drinking, and standing behaviors
around parturition in Holstein cows
P. E. Jawor,*1 J. M. Huzzey,* S. J. LeBlanc,† and M. A. G. von Keyserlingk*2
*Animal Welfare Program, Faculty of Land and Food Systems, University of British Columbia, 2357 Main Mall, Vancouver,
British Columbia, V6T 1Z4, Canada
†Department of Population Medicine, Ontario Veterinary College, University of Guelph, Ontario, N1G 2W1, Canada
ABSTRACT
The objectives of this study were to describe the associations of subclinical hypocalcemia with milk yield,
and feeding, drinking, and resting behavior during the
period around calving. Blood was sampled within 24 h
of calving and analyzed for serum total calcium. Fifteen
Holstein dairy cows were classified as having subclinical hypocalcemia (serum calcium concentration ≤1.8
mmol/L, without clinical milk fever) and were matched
with 15 control cows (serum calcium concentration
>1.8 mmol/L) based on parity and presence of other
diseases. Daily feeding and drinking behavior were
monitored using an electronic feeding system (Insentec,
BV, Marknesse, the Netherlands) and summarized by
week relative to calving (wk −3, −2, −1, +1, +2, and
+3). Standing behavior was monitored from 7 d before
until 7 d after calving using dataloggers. Daily milk
yields were obtained for all cows up to 280 d in milk
(DIM). These data were summarized by week for the
first 4 wk of lactation to assess short-term differences
in milk yield, and were summarized into 4-wk periods
to assess long-term (280 DIM) differences in milk yield
between groups. Cows with subclinical hypocalcemia
produced, on average, 5.7 kg/d more milk during wk
2, 3, and 4 compared with control cows; however, only
subclinically hypocalcemic cows in their third lactation
sustained greater milk yields throughout 280 DIM.
Despite greater milk yield during the weeks following
calving, cows with subclinical hypocalcemia did not
consume more water after calving and tended to have
greater dry matter intake only during wk 2. However,
these animals made fewer visits to the water bins during the first 2 wk after calving and tended to make
fewer visits to the feed bins during wk 1 and 3, suggest-
Received May 30, 2011.
Accepted November 16, 2011.
1
Present address: Department of Immunology, Pathophysiology and
Veterinary Prevention, Wroclaw University of Environmental and Life
Sciences, C.K. Norwida 31, Wroclaw, 50-375, Poland.
2
Corresponding author: nina@mail.ubc.ca
ing that they used these resources more efficiently. Dry
matter intake was, on average, 1.7 kg/d greater during
wk −2 and −1 among cows subsequently diagnosed
with subclinical hypocalcemia compared with control
cows but neither group was lactating during this period. Cows with subclinical hypocalcemia stood for
2.6 h longer during the 24-h period before parturition,
which may suggest these animals experience increased
discomfort at calving; these cows spent 2.7 h less time
standing during d +1. Although milk yield was greater
among cows with subclinical hypocalcemia, this study
controlled for the confounding effects of disease incidence; these results do not refute previous research that
associates subclinical hypocalcemia with an increased
risk for health disorders. The mechanisms by which
subclinical hypocalcemia is associated with behavior
and production require further investigation.
Key words: subclinical hypocalcemia, behavior, milk
yield, Holstein dairy cow
INTRODUCTION
The onset of lactation requires that the dairy cow
undergo tremendous changes in calcium homeostatic
mechanisms to produce milk. During the dry period,
gastrointestinal absorption is the major calcium inflow,
whereas at the onset of lactation, calcium resorption
from bone increases and the rate of calcium outflow
to bone and feces decreases (Ramberg et al., 1970). To
produce 10 kg of colostrum on the day of calving, 23 g
of calcium is needed by the mammary gland (Goff and
Horst, 1997). Metabolic adaptation mechanisms for
calcium are not rapid enough at the onset of lactation;
cows require about 1 to 2 d to maximize calcium inflow
from the gastrointestinal tract and from bone to the
mammary gland (Ramberg et al., 1970). Consequently,
almost all cows experience some degree of hypocalcemia
during the first days after calving but plasma calcium
concentration returns to normal within 2 to 3 d (Ramberg et al., 1984; Horst et al., 1994).
Normal serum calcium concentrations in healthy
midlactation cows range from 2.1 to 2.8 mmol/L and
1240
BEHAVIOR AND MILK YIELD DURING HYPOCALCEMIA
from 1.6 to 2.6 mmol/L during the week after calving among cows with no subsequent clinical disease
(Quiroz-Rocha et al., 2009). Milk fever, which is a severe form of hypocalcemia, is diagnosed based on the
observation of clinical signs of disease, including dull
appearance, lethargy, cold ears, muscular weakness,
or recumbency. The lactational incidence risk of milk
fever ranges from 3 to 6% of cows of all parities, depending on the geographical region (DeGaris and Lean,
2008). Subclinical hypocalcemia can be more difficult
to diagnose, because it is characterized by low serum
calcium concentration in the absence of clinical milk
fever symptoms. Goff (1999) and Duffield et al. (2005)
proposed a serum calcium cutpoint of ≤1.8 mmol/L in
the first week after calving, as a suitable threshold for
the diagnosis of subclinical hypocalcemia. The prevalence of plasma calcium between 1.5 and 2.0 mmol/L
within 48 h postpartum has been reported to range
from 25 to 54%, depending on parity (Reinhardt et al.,
2011).
Cows with milk fever are at increased risk for a variety
of additional health complications including dystocia,
retained placenta, and metritis (Erb et al., 1985). Milk
fever has also been associated with immune suppression
by impairing the activity of mononuclear blood cells
(Kimura et al., 2006). The relationships between subclinical hypocalcemia and health are less consistent. As
described earlier, Duffield et al. (2005) found that cows
with subclinical hypocalcemia but not clinical milk fever, had a greater risk of culling in early lactation than
cows with calcium concentrations above the suggested
1.8 mmol/L threshold. However, studies disagree on the
association of subclinical hypocalcemia with increased
risk of displaced abomasum. Massey et al. (1993) found
that the risk of left abomasum displacement (LDA)
was almost 5 times higher among cows with subclinical
hypocalcemia. However, LeBlanc et al. (2005) reported
no relationship between serum calcium concentrations
and the subsequent incidence of LDA and hypothesized
that subclinical hypocalcemia may be symptomatic of
inadequate prepartum feed intake, which leads to other
risks for LDA, such as elevated NEFA concentration
(Reinhardt et al., 2011) and subclinical ketosis.
Reports on the relationship between hypocalcemia
and milk yield are inconsistent. Rajala-Schultz et al.
(1999) reported that although cows with milk fever
produced, on average, more milk than healthy cows,
milk fever was associated with production losses between wk 4 to 6 of lactation when using the cows’ own
milk yield during midlactation as the reference level. In
contrast, Østergaard and Larsen (2000) evaluated cows
with milk fever and with subclinical hypocalcemia and
found that low total plasma calcium at calving was not
a risk factor for decreased milk yield.
1241
Understanding behavioral characteristics of cows
that have subclinical hypocalcemia after calving may
help to facilitate improvements in treatment, transition
cow management, and ultimately health. Currently,
producers can readily identify animals with milk fever
through the observation of overt clinical signs, including dull appearance, lethargy, cold ears, or a down
cow; subclinical hypocalcemia may be associated with
more subtle changes in behavior, such as changes in
intake or resting behavior. Previous work has shown
that changes in behavior, such as time spent at the
feed bunk or changes in lying bouts, may be an early
indicator of risk for dystocia (Proudfoot et al., 2009),
subclinical ketosis (Goldhawk et al., 2009), and metritis
(Huzzey et al., 2007). The objectives of this study were
to describe the associations of subclinical hypocalcemia
at calving with 1) milk yield and 2) feeding, drinking,
and resting behavior around parturition.
MATERIALS AND METHODS
Animals, Housing, and Diet
The study was conducted at the University of British Columbia’s Dairy Education and Research Centre
(Agassiz, BC, Canada). All animals were cared for according to the guidelines of the Canadian Council on
Animal Care (1993). In total, 32 primiparous and 69
multiparous (parity = 3.2 ± 1.3, mean ± SD) Holstein dairy cows were observed from 3 wk before until
3 wk after calving. Experimental cows were housed in
pre- and postpartum group pens, each maintained at
20 cows per pen. The experimental pens provided 20
freestalls, 12 Insentec feed bins, and 2 Insentec water
troughs (Insentec BV, Marknesse, Holland). The Insentec feeding system is described in detail by Huzzey et
al. (2007). Cows entered the prepartum pen 25 ± 2 d
before their expected calving date. They were moved
to the maternity pen when they showed physical signs
of imminent calving (i.e., udder enlargement, milk letdown, and relaxation of tail ligament). The maternity
pen consisted of a sand-bedded pack with 6 Insentec
feed bins and 1 Insentec water trough. A maximum of 2
cows were kept in the maternity pen at any given time
and cows were moved to the postpartum pen within 24
h after calving where they were monitored for an additional 21 d. Cows in the postpartum pen were milked
twice daily at approximately 0700 and 1700 h. Daily
milk yields were recorded for each cow until she was
dried-off, left the herd, or reached 305 DIM, whichever
came first.
Cows had ad libitum access to feed with fresh feed
being delivered to the feed bins twice daily at approximately 0800 and 1600 h; orts were removed from the
Journal of Dairy Science Vol. 95 No. 3, 2012
1242
JAWOR ET AL.
bins each morning before fresh feed delivery and the
bins cleaned. Samples of the pre- and postpartum TMR
were collected on Monday, Wednesday, and Friday of
each week and pooled into monthly composite samples.
Samples were dried at 60°C over 2 d to determine DM
content and then sent for nutrient analysis to Cumberland Valley Analytical Services Inc. (Maugansville,
MD). Prepartum and maternity diets consisted of 21.3%
corn silage, 42.8% alfalfa hay, and 35.9% concentrate
and mineral mix on a DM basis [DM: 50.8 ± 1.2%, and
on a DM basis (mean % ± SD), CP: 14.4 ± 1.0, ADF:
35.0 ± 2.7, NDF: 45.6 ± 2.6, Ca: 0.80 ± 0.06, P: 0.30
± 0.02, Mg: 0.34 ± 0.06, K: 1.48 ± 0.08, Na: 0.20 ±
0.01, and NEL: 1.40 ± 0.1 Mcal/kg). The postpartum
TMR consisted of 21.3% grass silage, 14.7% corn silage,
12.3% alfalfa hay, and 51.7% concentrate and mineral
mix on a DM basis (DM: 51.1 ± 1.8%, and on a % DM
basis, CP: 17.7 ± 1.0, ADF: 23.7 ± 1.4, NDF: 36.1 ±
1.8, Ca: 0.93 ± 0.08, P: 0.39 ± 0.02, Mg: 0.31 ± 0.03,
K: 1.71 ± 0.22, Na: 0.22 ± 0.01, and NEL: 1.66 ± 0.02
Mcal/kg).
Serum Analysis for Determination
of Subclinical Hypocalcemia Status
A blood sample was collected for each cow within 24
h after calving. This sample was always taken before
the herd’s preventive treatment protocol for hypocalcemia that involved providing 500 mL of calcium borogluconate (23% wt/vol, Vétoquinol, Bimeda-MTC Animal
Health Inc., Cambridge, Ontario) once subcutaneously
to cows of parity 3 or higher immediately following
calving. Blood was collected from the coccygeal vessel
into a 10-mL evacuated sterile serum tube (Vacutainer,
Venous Blood Collection Red Top Tubes; BD Biosciences, Franklin Lakes, NJ), allowed to clot at room
temperature for up to 3 h, and then was centrifuged at
1,400 × g for 10 min. Serum was harvested and frozen
at −20°C for later analysis. Serum samples were sent
to the University of Guelph Animal Health Laboratory
(Ontario, Canada) and total calcium concentration
was measured (Roche diagnostics GmbH, Manheim,
Germany) using an automated wet chemistry analyzer
(Roche Hitachi 911 Chemistry Analyzer; Roche Diagnostics, Indianapolis, IN).
Subclinical Hypocalcemia Classification
and Cow Participation in Study
Of the original 101 cows enrolled in the study a
subset of animals was established based on health
status for statistical analyses. Two cows did not have
blood samples taken within 24 h after calving and
so were removed from the study. A cow was classiJournal of Dairy Science Vol. 95 No. 3, 2012
fied as having subclinical hypocalcemia when serum
calcium concentration was ≤1.8 mmol/L (Goff, 1999;
Duffield et al., 2005) and clinical milk fever was not
observed. Although cows with milk fever have a much
lower calcium concentration nadir than do healthy cows
(Kimura et al., 2006), the observed ranges of serum
calcium between calving and 2 DIM overlap between
clinically normal and cows with milk fever. However,
the chosen cut-point is at the midpoint of the range for
subclinical hypocalcemia proposed by Reinhardt et al.
(2011). Of 99 cows, 33 were identified as hypocalcemic
on the day of calving and 66 were identified as having
normal calcium concentrations (control cows: calcium
>1.8 mmol/L). Of the 33 hypocalcemic cows, 5 were
not included in the statistical analyses due to the presence of additional health complications that could have
significantly altered behavior and intake around calving
(i.e., clinical milk fever, severe vulva infection, lameness,
and damaged udder). The remaining 28 subclinically
hypocalcemic cows were pair matched with a control
cow first based on parity and then, where possible, on
the incidence of other health disorders (mild or severe
metritis, fever, or mastitis). Subclinically hypocalcemic
cows in second, third, fourth, fifth, sixth, and seventh
lactation numbered 5, 8, 6, 6, 2, and 1, respectively.
Among cows in the higher lactations (parity ≥5), 2 or
fewer pairs could be formed after balancing with control animals for parity and health. Because the effect
of parity was to be included in the statistical models,
cows of parity 5 or greater were excluded due to too few
observations to allow for meaningful statistical interpretation. After matching animals based on the criteria
outlined above, 5 pairs were available for each of the
second, third, and fourth lactations (15 subclinically
hypocalcemic cows balanced with 15 control cows) and
these animals were used for all further analyses. The
number of events of mild metritis, severe metritis, fever,
and mastitis in the subclinical hypocalcemia group was
2, 2, 1, and 2, respectively, and in the control group was
3, 2, 1, and 0, respectively.
Behavior and Intake Data Collection
An electronic feeding system (Insentec BV) validated
by Chapinal et al. (2007) was used to continuously monitor feeding and drinking behavior as well as individual
feed and water intakes for all experimental cows. Each
cow had a unique passive transponder (High Performance ISO Half Duplex Electronic ID Tag; Allflex Inc.,
St. Hyacinthe, Quebec, Canada) attached to her ear
tag. When a cow approached the bin, an antenna detected the cows’ transponder and the head gate opened,
allowing the cow access to feed or water. At the time
the gate opened, the Insentec system recorded the time
BEHAVIOR AND MILK YIELD DURING HYPOCALCEMIA
and the initial weight in the bin. When a cow exited the
bin, the head gate closed and the system again recorded
the time and the weight in the bin. These data were
used to record the duration of each visit to the bin and
the amount of feed or water consumed. Only visits during which cows consumed feed or water were included
in the analyses. Daily as-fed intakes recorded by the
Insentec system were corrected for the DM content of
the feed.
Standing behavior data were collected using modified dataloggers (Gemini Dataloggers Ltd., Chichester, UK), validated by O’Driscoll et al. (2008). The
dataloggers were fitted on the hind leg of each cow
upon entering the prepartum group and recorded leg
orientation (horizontal vs. vertical) at 1-min intervals.
Loggers were switched to the opposite hind leg weekly
to download stored data and prevent sores from developing on the leg where the logger was attached. Loggers
were removed 21 d after calving. The data collected
were used to quantify total daily standing and lying
time and the number of times cows transitioned from
standing to lying positions (i.e., standing bouts).
Statistical Analysis
Statistical analyses were performed with SAS (version 9.1; SAS Institute, 2003) using cow (n = 30) as
the experimental unit. Feeding, drinking, and standing
events were screened for normality and the presence of
outliers by visual assessment of the distributions using
PROC UNIVARIATE. Extreme outliers were defined
as observations that lay more than 3 times the interquartile range from the first or third quartile of the data
set. Of 56,795 feeding events, 2.16% were identified as
extreme outliers. Of 12,070 drinking events, 5.8% were
identified as extreme outliers and from 1,041 standing
events, 0.1% were identified as extreme outliers. These
observations were removed from the study.
Due to the well-described differences in behavior
and intake and differences in risk of disease during the
weeks leading up to and after calving, the associations
of subclinical hypocalcemia status with feeding and
drinking behavior were tested separately by period.
Six experimental periods were defined for the analyses
based on the week relative to calving: wk −3 (d −21 to
−15), wk −2 (d −14 to −8), wk −1 (d −7 to −1), wk
1 (d 0 to 7), wk 2 (d 8 to 14), and wk 3 (d 15 to 21).
Differences in DMI, water intake, number of feed and
water visits, and feeding and drinking rates between
control cows and those with subclinical hypocalcemia
were analyzed using PROC MIXED. A Type I analysis
was used for the fixed effects modeled in the following
order: parity, calcium status, and the parity × calcium
1243
status interaction. If an interaction was detected (P <
0.05), data were stratified by parity.
Previous work suggests that significant changes in
standing behavior occur during the 24-h period before
parturition as part of normal behavioral adaptations to
calving (Huzzey et al., 2005). To capture potential differences in standing behavior between the control cows
and those with subclinical hypocalcemia during the period around calving, standing time and standing bouts
were analyzed by day beginning 7 d before calving until
7 d after calving. Standing behavior data were adjusted
according to the actual time of calf delivery for each
cow (i.e., day −1 represented the 24-h period before
calving, whereas d 0 represented the 24-h period after
calf delivery). A total of 3 cows from the control group
and 4 cows from the subclinical hypocalcemic group
were removed from the standing behavior analyses
due to missing or insufficient data on standing activity around the calving period. Differences in standing
time and standing bouts between control cows (n =
12) and those with subclinical hypocalcemia (n = 11)
were analyzed using PROC MIXED with day modeled
as a repeated measure. A Type I analysis was used for
the fixed effects modeled in the following order: parity,
day, calcium status, and the day × calcium status and
parity × calcium status interaction. If an interaction
was detected (P < 0.05), data were stratified by the
relevant term.
Proc GLM was used to compare the average 305-d
milk yield from the previous lactation of each experimental group. For the current lactation, the shortest
lactation length was 281 d; therefore, to compare
long-term milk yield between groups, the yield of all
cows was censored beyond 280 DIM. Ten periods were
defined for the long-term analysis of milk yield based
on 4-wk (28 d) increments of the lactation [i.e., period
1 (2 to 28 DIM), period 2 (29 to 56 DIM), period 3
(57 to 84 DIM), . . . period 10 (253–280 DIM)]. Daily
milk yields were used to generate an average daily yield
per cow during each of these experimental periods. To
explore the short-term relationship between milk yield
(first 28 DIM) and presence of subclinical hypocalcemia
within 24-h after calving, 4 periods were defined based
on week relative to calving: wk 1 (d 2 to 7), wk 2 (d
8 to 14), wk 3 (d 15 to 21), and wk 4 (d 22 to 28).
Due to inconsistencies in the manual reporting of milk
yield during d 0 and 1 by farm staff, these days were
excluded from the milk production analyses. A Type
I analysis with PROC MIXED was used to evaluate
the fixed effects modeled in the following order: parity,
period, calcium status, and the interactions parity ×
calcium status and period × calcium status. Cow was
treated as a random effect and period as a repeated
Journal of Dairy Science Vol. 95 No. 3, 2012
1244
JAWOR ET AL.
measure. If an interaction was detected (P < 0.05),
data were stratified by the relevant term.
RESULTS
Calcium Concentration
Cows with subclinical hypocalcemia had an average
calcium concentration that was 0.51 mmol/L lower
than that of the control cows [1.54 (1.21 – 1.80) ± 0.17
vs. 2.05 (1.81 – 2.61) ± 0.25 mmol/L; mean (range) ±
SD].
Milk Production
No differences were observed between groups in their
305-d milk yield in the previous lactation (10,999 vs.
11,005 kg, for the control and subclinical hypocalcemia
groups, respectively; P = 0.99), nor a significant parity
× calcium status interaction (P = 0.11). An effect of
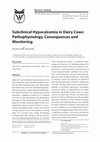
calcium status on milk yield during the first 4 wk of
lactation (P = 0.01) was observed and also a period
× calcium status interaction (P = 0.02). Subsequent
stratification by period revealed that cows with subclinical hypocalcemia produced, on average, 6 kg/d
more milk during wk 2, 3, and 4 compared with control
cows (P ≤ 0.04; Figure 1). A parity × calcium status interaction during wk 2 (P = 0.03) revealed that
milk yield was only greater among third-lactation cows
with subclinical hypocalcemia (P = 0.003). For the
long-term analysis of milk yield, a parity × calcium
status interaction was detected (P = 0.002). When the
data were stratified by parity and differences in milk
yield between experimental groups, differences were
only detected among third-lactation cows (P = 0.01)
and these differences were consistent across each of the
10 experimentally defined periods due to the lack of a
period × calcium status interaction (P = 0.17). Cows
in their third lactation with subclinical hypocalcemia
produced, on average, 6.4 kg/d more milk across the
10 periods compared with third-lactation control cows
(Figure 2).
Figure 1. Least squares means (±SE) milk yield during the first
4 wk of lactation for cows with (, n = 15) and without (, n = 15)
subclinical hypocalcemia (serum total calcium ≤1.8 mmol/L within 24
h after calving). **P ≤ 0.01; *P ≤ 0.05.
intake was greater during wk −2 and −1 (P ≤ 0.03)
in cows that subsequently had subclinical hypocalcemia and tended to be greater during wk 2 (P = 0.09)
compared with control cows (Figure 4B). For both the
analysis of water intake and DMI, no parity × calcium
status interactions were detected (P ≥ 0.48 and P ≥
0.30, respectively). No differences in feeding or drinking
rate occurred between control cows and those with subclinical hypocalcemia at any period relative to caving
(Table 1; P ≥ 0.3).
Drinking and Feeding Behavior
Cows with subclinical hypocalcemia visited the water
bins less frequently than control cows during wk 1 and
2 after calving (Figure 3A; P ≤ 0.05) and tended to
visit the feed bins fewer times during wk 1 and 3 relative to calving (Figure 3B; P ≤ 0.14) compared with
control cows.
Water intake was not different between control cows
and those with subclinical hypocalcemia at any period
relative to calving (Figure 4A; P ≥ 0.2). Dry matter
Journal of Dairy Science Vol. 95 No. 3, 2012
Figure 2. Least squares means (±SE) daily milk yield during ten
4-wk periods relative to calving for third-lactation (Lact) cows with (- -, n = 5) and without (—, n = 5) subclinical hypocalcemia (SCHC:
serum total calcium ≤1.8 mmol/L within 24 h after calving). Data for
second- and fourth-lactation cows are also shown as a reference; however, milk yield was not statistically different between experimental
groups among these parities.
1245
BEHAVIOR AND MILK YIELD DURING HYPOCALCEMIA
Figure 3. Number (LSM ± SE) of daily visits to the water (A) and
feeding (B) bins for cows with (, n = 15) and without (, n = 15)
subclinical hypocalcemia (serum total calcium ≤1.8 mmol/L within
24 h after calving) during the peripartum period. **P ≤ 0.01; *P ≤
0.05; †P ≤ 0.1.
Standing Behavior
No differences were observed in the average number
of daily standing bouts between control cows and those
with subclinical hypocalcemia during the 7 d before
and after calving (prepartum: 12.2 vs. 12.0 bouts, post-
Figure 4. Least squares means (±SE) daily water intake (A) and
DMI (B) for cows with (, n = 15) and without (, n = 15) subclinical hypocalcemia (serum total calcium ≤1.8 mmol/L within 24 h after
calving) during the peripartum period. *P ≤ 0.05; †P ≤ 0.1.
partum: 10.7 vs. 10.3 bouts for control and subclinical
hypocalcemia cows, respectively; P = 0.90). The initial
analysis of standing time between the groups revealed
a day × calcium status interaction (P = 0.01), so the
data were stratified by day. Cows with subclinical hypocalcemia on d 0 spent more time standing on d −1
(16.5 vs. 13.9 h; P = 0.03) and tended to spend less
Table 1. Least squares means (±SE) daily drinking and feeding rate for subclinical (SC) hypocalcemic cows
(n = 15, serum total calcium ≤1.8 mmol/L within 24 h after calving) and control cows (n = 15, calcium >1.8
mmol/L) during the peripartum period
Period
Item
Drinking rate (kg/min)
Control
SC hypocalcemia
Feeding rate (g/min)
Control
SC hypocalcemia
wk −3
wk −2
wk −1
6.1 ± 0.9
5.6 ± 0.9
6.0 ± 0.7
5.6 ± 0.9
6.0 ± 0.7
6.0 ± 0.9
84.3 ± 4
78.7 ± 4
87.9 ± 4
83.6 ± 4
92.4 ± 4
88.9 ± 5
wk +1
wk +2
wk +3
6.8 ± 0.7
6.8 ± 0.9
6.8 ± 0.8
6.8 ± 0.9
7.2 ± 0.8
7.5 ± 0.9
111.8 ± 4
112.3 ± 4
104.6 ± 4
105.9 ± 4
101.9 ± 4
103.4 ± 4
Journal of Dairy Science Vol. 95 No. 3, 2012
1246
JAWOR ET AL.
Figure 5. Least squares means (±SE) standing time (h/d) for cows
with (, n = 12) and without (, n = 11) subclinical hypocalcemia
(serum total calcium ≤1.8 mmol/L within 24 h after calving) during 7
d before and after calving. Day 0 represents the 24-h period following
calving. *P ≤ 0.05; †P ≤ 0.1.
time standing during d +1 (12.4 vs. 15.1 h; P = 0.07)
compared with control cows (Figure 5).
DISCUSSION
Among cows that were identified with subclinical
hypocalcemia within 24 h of calving, milk yield was
greater during wk 2 (third-lactation cows only), 3, and
4 relative to calving. Further, third-lactation cows with
subclinical hypocalcemia (≤1.8 mmol/L) shortly after
calving had greater milk yield throughout the first 280
DIM relative to third-lactation cows with calcium concentrations above 1.8 mmol/L. Although the sample
size in this study was low, comparison groups were carefully balanced according to health status (mild or severe
metritis, fever, and mastitis) and parity so that differences in milk yield and behavior could more confidently
be discussed relative to differences in calcium status,
rather than other extenuating factors. After controlling
for disease and parity, low total calcium concentration
24 h after calving does not appear to be a risk factor for
decreased yield. This supports the claim of Østergaard
and Larsen (2000), although these researchers did not
observe the increase in yield that was observed in the
current study. It is unclear what the mechanism may
be to explain the association of briefly worse hypocalcemia with greater milk yield for several weeks or the
whole lactation. Cows with greater capacity for milk
production may also be prone to greater net loss of
calcium just after calving, yet be able to cope with this
transient metabolic challenge. A weakness of this study
is that the study herd had a preventive treatment protocol for hypocalcemia that involved all cows (parity 3
Journal of Dairy Science Vol. 95 No. 3, 2012
or higher) receiving a bottle of calcium subcutaneously
immediately after parturition. Although blood samples
for the calcium analysis were always taken before the
exogenous calcium was given, this preventive program
may have helped those cows utilizing more endogenous
calcium reserves to avoid clinical milk fever and maintain high milk yield. However, this dose and route of
calcium in Holstein cows would only raise blood calcium modestly for 4 h (Goff, 1999).
These results do not refute the undesirable effects
of clinical milk fever or the association of subclinical
hypocalcemia with worse measures of energy status
(e.g., increased NEFA; Reinhardt et al., 2011) or the
inconsistent association with risk of displaced abomasum (Massey et al., 1993; LeBlanc et al., 2005). Rather,
the results of this study underline the association of
subclinical hypocalcemia with increased milk yield in
early lactation when comparison groups are balanced
for disease or health status.
Cows with subclinical hypocalcemia had greater DMI
during the 2 wk leading up to calving; however, after
calving (when milk production was increased), a tendency for increased DMI only occurred during wk 2.
Increased DMI after calving may suggest associations
among regulators of feed intake and calcium metabolism. Increased milk yield after calving is expected to
be associated with increased DMI (NRC, 2001); however, increased prepartum intake observed in the cows
with subsequent subclinical hypocalcemia could not be
explained by an increase in nutrient requirements to
support increased milk yield, as these cows were not yet
lactating. It is unclear what mediators are responsible
for this observed increase in intake; however, intake
level could be related to non-nutritional factors such as
social dominance or a cow’s level of success at competing for access to the feed bunk.
No differences in water intake were detected between
cows with and without subclinical hypocalcemia at calving. Increased milk yield is typically associated with an
increase in free water intake (drinking); however, cattle
acquire, on average, 17% of their requirements from
water obtained in the feed they are consuming (NRC,
2001). Although cows with subclinical hypocalcemia
did not have greater water intakes compared with control cows despite their higher level of milk yield, they
may have achieved their increased water needs through
an increase in DMI.
Cows with subclinical hypocalcemia made fewer
visits to both the feed and water troughs during the
weeks following calving; however, no differences existed
in the number of visits to the feeder during the weeks
leading up to calving. These results suggest that cows
with subclinical hypocalcemia may use feeding and
drinking resources more efficiently during the period
BEHAVIOR AND MILK YIELD DURING HYPOCALCEMIA
following calving; they acquired their water and feed
requirements in fewer visits to the bins. This increase in
efficiency of resource use has previously been described
for dairy cows facing health challenges during the
postpartum period. The correlation coefficient between
feeding time and DMI during the 3-wk period after
calving among cows with severe metritis was higher
than the coefficient for cows without metritis (r = 0.90
vs. 0.82; Huzzey et al., 2007). These results highlight
the importance of ensuring that cows have adequate
access (via a low stocking density) to feeding and drinking areas during the period following calving so that
they can meet their nutrient requirements, allowing for
variation in efficiency of use of feeding and drinking
resources between subgroups of cows.
Low plasma calcium concentrations can affect contraction of calcium-dependent smooth muscle and skeletal
muscle (Murray et al., 2008) and, thus, could compromise physical movements to and from the feed or water
bins. Muscle weakness due to calcium deficiency may
explain the observed decrease in the number of visits
to the feed and water bins and the decrease in standing
time following calving among cows with subclinical hypocalcemia. Alternatively, these differences in behavior
might also be attributed to social dominance or genetic
potential for milk production rather than low calcium
concentrations directly. For example, high-producing
cows may be less likely to submit to competition (i.e.,
be displaced) at the feed or water trough or lying stalls;
this would allow them adequate opportunity to eat or
drink to support their increased nutrient requirements
and to retain lying stalls for longer resting times. Being more competitive at the bunk has been shown to
be associated with healthier cows (Huzzey et al., 2007;
Goldhawk et al., 2009) and may, therefore, also play a
role in a cow’s ability to achieve high milk yield.
Cows with subclinical hypocalcemia spent almost
3 h longer standing during the 24-h period preceding
parturition compared with control cows. It is difficult
to explain these acute differences in standing behavior
based on subsequent level of milk production. These
differences may have been more directly associated
with reduced circulating calcium concentrations during the period around parturition. Huzzey et al. (2005)
reported that standing time between d −1 to d +1
relative to calving is higher than at other times during
the transition period and that the number of standing bouts (transitions from lying to standing) almost
double between d −1 and the day of calving compared with all other times relative to calving. These
behavioral changes are typical and attributed to the
discomfort associated with labor and the process of
parturition. Calcium is essential for proper myometrial
smooth muscle cell contractility (López Bernal, 2003).
1247
In calcium-deficient animals, uterine contractions during the final stages of labor may be weaker, thus prolonging the calving process. Prolonged labor attributed
to hypocalcemia and the corresponding prolonged discomfort could potentially explain the greater standing
times; however, this hypothesis is only speculative. An
alternative theory for the greater time spent standing
during the 24-h before parturition could be that these
animals, due to their increased milk yield postpartum,
had greater udder fill before parturition, which may
have made resting during this time more uncomfortable
and, thus, resulted in longer standing times.
The present data should be built upon with studies
that include measurements of plasma calcium throughout the transition period, including daily samples during the days around calving. These studies should also
include sufficient numbers of animals so that behavioral changes associated with subclinical hypocalcemia
at calving might be described for cows with different
subsequent health outcomes (disease or culling risk) or
milk production levels.
CONCLUSIONS
Dairy cattle with subclinical hypocalcemia (serum
calcium ≤1.8 mmol/L) during the 24-h period following calving did not exhibit production or behavioral
changes that would classically be associated with poor
health. Cows with subclinical hypocalcemia produced
almost 6 kg/d more milk during wk 2 (third-lactation
cows only), wk 3 and 4 after calving compared with
control cows and had greater DMI during the 2-wk
period before calving. Dry matter intake also tended to
be greater among cows with subclinical hypocalcemia
during wk 2 after calving. Although no differences existed in water intake between the experimental groups,
cows with subclinical hypocalcemia visited both the
water and feed bins less frequently than did the control
cows; this may suggest that they use their time more
efficiently at these resources, allowing them to maintain
the same level of water intake and greater feed intake
in fewer visits. Standing time was almost 3 h longer
during the 24-h period before calving among cows
with subclinical hypocalcemia; this may suggest these
animals experience additional discomfort associated
with labor and highlights the importance of ensuring
that cows have a well-bedded and comfortable resting
area during parturition. These results do not refute the
undesirable effects of clinical milk fever or studies that
suggest subclinical hypocalcemia may be a potential
health risk for transition cows. Comparison groups in
this study (control vs. subclinical hypocalcemic cows)
were balanced based on health status and so this study
underlines the association of subclinical hypocalcemia
Journal of Dairy Science Vol. 95 No. 3, 2012
1248
JAWOR ET AL.
with increased milk yield and changes in behavior in
early lactation in the absence of the confounding effects of disease incidence. The mechanisms by which
subclinical hypocalcemia is associated with behavior,
disease risk, and production require further investigation.
ACKNOWLEDGMENTS
The authors thank Katy Proudfoot and Dan Weary
of the University of British Columbia Animal Welfare
Program (Vancouver, BC, Canada) for the numerous
discussions that took place during the preparation of
this manuscript. P. E. Jawor thanks the Dekaban Foundation for Visiting Polish Scholars to the University of
British Columbia (Vancouver, BC, Canada). The Animal Welfare Program is funded by Canada’s Natural
Sciences and Engineering Research Council (NSERC)
Industrial Research Chair Program (Ottawa, ON,
Canada) with industry contributions from the Dairy
Farmers of Canada (Ottawa, ON, Canada), Westgen
Endowment Fund (Milner, BC, Canada), Pfizer Animal Health (Kirkland, QC, Canada), BC Cattle Industry Development Fund (Kamloops, BC, Canada),
the BC Milk Producers (Burnaby, BC, Canada), BC
Dairy Foundation (Burnaby, BC, Canada), BC Dairy
Education and Research Association (Abbotsford, BC,
Canada), and Alberta Milk (Edmonton, AB, Canada).
REFERENCES
Canadian Council on Animal Care. 1993. Guide to the Care and Use
of Experimental Animals. Vol. 1. E. D. Olfert, B. M. Cross, and A.
A. McWilliam, ed. CCAC, Ottawa, Ontario, Canada.
Chapinal, N., D. M. Veira, D. M. Weary, and M. A. G. von Keyserlingk. 2007. Validation of a system for monitoring individual feeding and drinking behavior and intake in group housed cattle. J.
Dairy Sci. 90:5732–5736.
DeGaris, P. J., and I. J. Lean. 2008. Milk fever in dairy cows: A review
of pathophysiology and control principles. Vet. J. 176:58–69.
Duffield, T., S. LeBlanc, and K. Leslie. 2005. Impact of subclinical
metabolic disease on risk of early lactation culling. J. Dairy Sci.
88(Suppl. 1):199–200. (Abstr.)
Erb, H. N., R. D. Smith, P. A. Oltenacu, C. L. Guard, R. B. Hillman,
P. A. Powers, M. C. Smith, and M. E. White. 1985. Path model of
reproductive disorders and performance, milk fever, mastitis, milk
yield and culling in Holstein cows. J. Dairy Sci. 68:3337–3349.
Goff, J. P. 1999. Treatment of calcium, phosphorus and magnesium
balance disorders. Vet. Clin. North Am. Food Anim. Pract.
15:619–639.
Journal of Dairy Science Vol. 95 No. 3, 2012
View publication stats
Goff, J. P., and R. L. Horst. 1997. Physiological changes at parturition and their relationship to metabolic disorders. J. Dairy Sci.
80:1260–1268.
Goldhawk, C., N. Chapinal, D. M. Veira, D. M. Weary, and M. A. G.
Keyserlingk. 2009. Prepartum feeding behavior is an early indicator of subclinical ketosis. J. Dairy Sci. 92:4971–4977.
Horst, R. L., J. P. Goff, and T. A. Reinhardt. 1994. Calcium and vitamin D metabolism in the dairy cow. J. Dairy Sci. 77:1936–1951.
Huzzey, J. M., M. A. G. Keyserlingk, and D. M. Weary. 2005. Changes
in feeding, drinking, and standing behavior of dairy cows during
the transition period. J. Dairy Sci. 88:2454–2461.
Huzzey, J. M., D. M. Veira, D. M. Weary, and M. A. G. Keyserlingk.
2007. Prepartum behavior and dry matter intake identify dairy
cows at risk for metritis. J. Dairy Sci. 90:3220–3233.
Kimura, K., T. A. Reinhardt, and J. P. Goff. 2006. Parturition and
hypocalcaemia blunts calcium signals and immune cells of dairy
cattle. J. Dairy Sci. 89:2588–2595.
LeBlanc, S. J., K. E. Leslie, and T. F. Duffield. 2005. Metabolic predictors of displacement abomasum in dairy cattle. J. Dairy Sci.
88:159–170.
López Bernal, A. 2003. Mechanisms of labour—Biochemical aspects.
BJOG 110:39–45.
Massey, C. D., C. Wang, G. A. Donovan, and D. K. Beede. 1993. Hypocalcemia at parturition as a risk factor for left displacement of the
abomasum in dairy cows. J. Am. Vet. Med. Assoc. 203:852–853.
Murray, R. D., J. E. Horsfield, W. D. McCormick, H. J. Williams, and
D. Ward. 2008. Historical and current perspectives on the treatment, control and pathogenesis of milk fever in dairy cattle. Vet.
Rec. 163:561–565.
NRC. 2001. Nutrient Requirements of Dairy Cattle. 7th rev. ed. National Academy Press, Washington, DC.
O’Driscoll, K., L. Boyle, and A. Hanlon. 2008. A brief note on the
validation of a system for recording lying behaviour in dairy cows.
Appl. Anim. Behav. Sci. 111:195–200.
Østergaard, S., and T. Larsen. 2000. Associations between blood calcium status at calving and milk yield in dairy cows. J. Dairy Sci.
83:2438–2440.
Proudfoot, K. L., J. M. Huzzey, and M. A. G. Keyserlingk. 2009. The
effect of dystocia on dry matter intake and behavior of Holstein
cows. J. Dairy Sci. 92:4937–4944.
Quiroz-Rocha, G. F., S. J. LeBlanc, T. F. Duffield, D. Wood, K. E.
Leslie, and R. M. Jacobs. 2009. Reference limits for biochemical
and hematological analytes of dairy cows one week before and one
week after parturition. Can. Vet. J. 50:383–388.
Rajala-Schultz, P. J., Y. T. Gröhn, and C. H. McCulloch. 1999. Effects
of milk fever, ketosis, and lameness on milk yield in dairy cows. J.
Dairy Sci. 82:288–294.
Ramberg, C. F. Jr., E. K. Johnson, R. D. Fargo, and D. S. Kronfeld.
1984. Calcium homeostasis in cows, with special reference to parturient hypocalcemia. Am. J. Physiol. 246:R689–R704.
Ramberg, C. F., G. P. Mayer, D. S. Kronfeld, J. M. Phang, and M.
Berman. 1970. Calcium kinetics in cows during late pregnancy,
parturition, and early lactation. Am. J. Physiol. 219:1166–1177.
Reinhardt, T. A., J. D. Lippolis, B. J. McCluskey, J. P. Goff, and R. L.
Horst. 2011. Prevalence of subclinical hypocalcemia in dairy herds.
Vet. J. 188:122–124.
SAS Institute. 2003. SAS User’s Guide. Version 9.1. SAS Inst. Inc.,
Cary, NC.
Keep reading this paper — and 50 million others — with a free Academia account
Used by leading Academics

Christian Dunker
Universidade de São Paulo

Marisol Mora
Universitat Autònoma de Barcelona

Zoran Josipovic
New York University

Eric S . Kim (UBC)
University of British Columbia